01 / 21

Impacts of
Overfishing

Explore how excessive harvest disrupts marine food webs, collapses fish populations, and threatens ocean biodiversity worldwide.

AP Environmental Science

What Is Overfishing?

Overfishing occurs when fish are harvested faster than they can reproduce. The population drops below levels that allow it to replenish naturally, pushing species toward commercial or biological collapse.

Essential Vocabulary

Bycatch
Non-target organisms unintentionally caught and usually discarded: sea turtles, dolphins, juvenile fish
Trophic Cascade
Chain of ecological effects when removing a species at one trophic level impacts levels above and below
Bycatch Reduction Device
Gear modifications (e.g., TEDs) that allow non-target species to escape nets or traps
Stock Collapse
When a population falls below \(10\%\) of its historic unfished biomass, recovery may take decades
Maximum Sustainable Yield
The greatest harvest rate a fishery can sustain long-term without declining: the peak of the surplus production curve

Why Overfishing Matters

Roughly 3 billion people depend on wild-caught and farmed seafood as a primary protein source. When fisheries collapse, the consequences ripple through ecosystems, economies, and food security.

1
Ecological: Loss of keystone predators triggers trophic cascades that restructure entire marine ecosystems.
2
Economic: The global fishing industry employs over 260 million people: collapsed stocks eliminate livelihoods.
3
Cultural: Coastal and Indigenous communities lose traditional practices tied to healthy fish populations.

The MSY Curve

Fishing Effort Yield (Catch) MSY Overfishing Zone Sustainable Zone

Population Dynamics of Fisheries

Fish population change over time can be expressed as:

$$\Delta N = (B + I) - (D + E + H)$$

Inputs
\(B\) = births, \(I\) = immigration into the stock
Outputs
\(D\) = natural death, \(E\) = emigration, \(H\) = harvest (catch)

Trophic Cascade Effects

Apex Predators ✕ Overfished population drops Mesopredators ↑ Increase more predation Small Fish / Herbivores ↓ Decrease less grazing Algae / Phytoplankton ↑ Algal bloom TL 4 TL 3 TL 2 TL 1

An otter’s feeding link changes an entire underwater forest
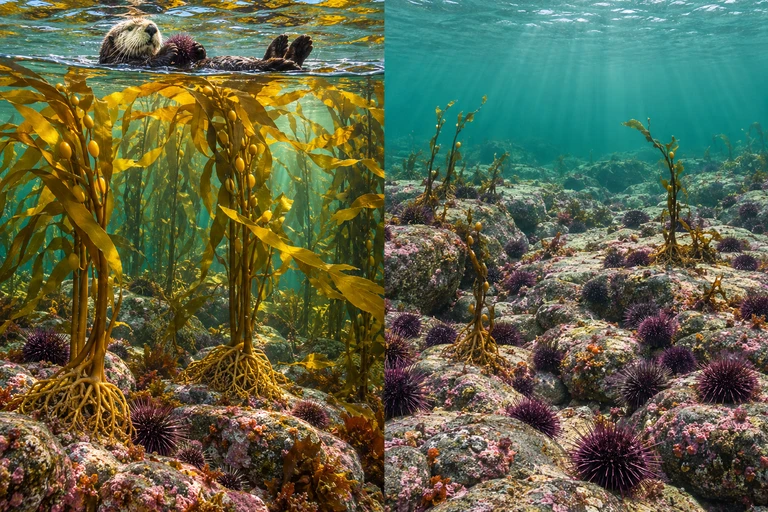
An otter floats above a lush kelp forest beside a conceptual urchin-dominated rocky state with sparse kelp.In this kelp–urchin–otter food web, otter feeding can limit urchin grazing and indirectly favor kelp. Other environmental conditions and interactions also influence kelp-forest outcomes.

Direct feeding can cause indirect effects
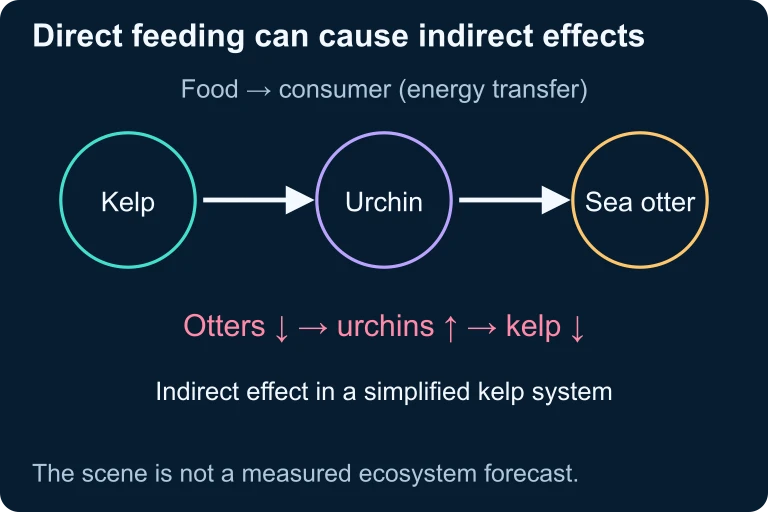
Direct feeding can cause indirect effects. In this kelp–urchin–otter food web, otter feeding can limit urchin grazing and indirectly favor kelp. Other environmental conditions and interactions also influence kelp-forest outcomes.In this kelp–urchin–otter food web, otter feeding can limit urchin grazing and indirectly favor kelp. Other environmental conditions and interactions also influence kelp-forest outcomes.

Sustainable vs. Unsustainable Harvest

Sustainable Fishing Overfishing
Harvest Rate \(H \leq \text{MSY}\) \(H > \text{MSY}\)
Population Trend Stable or growing Declining
Bycatch Minimized with BRDs High, often unmonitored
Ecosystem Health Food web intact Trophic cascades, biodiversity loss
Long-term Yield Consistent income Boom then collapse

Destructive Fishing Methods

Bottom Trawling
Heavy nets dragged along the seafloor destroy coral reefs and benthic habitats while capturing enormous bycatch.
Drift Nets
Massive gill nets up to 60 km long: "walls of death" that entangle marine mammals, sharks, and seabirds.
Cyanide / Dynamite
Illegal in most nations, these methods stun or kill fish while destroying reef structures that take centuries to grow.

How to Analyze Overfishing Impacts

1
Identify the target species and its trophic level in the food web.
2
Determine the harvest rate: Is \(H > \text{MSY}\)? Compare reported catch data to stock assessments.
3
Trace the trophic cascade: Predict effects one level up and one level down from the depleted species.
4
Assess bycatch: Evaluate which non-target species are affected and their conservation status.
5
Evaluate management strategies: Quotas, marine protected areas, gear restrictions, or fishing moratoriums.

Case Study: Atlantic Cod Collapse

Year Catch (tonnes) 1960 1970 1980 1990 2000 Peak: 1968 1992 Moratorium No recovery

Case Study: Bluefin Tuna

Atlantic bluefin tuna populations have declined by over 80% since the 1970s. High demand for sushi-grade tuna drives intense fishing pressure even as stocks plummet.

Economic Driver
A single bluefin has sold for over \(\$3\) million at auction, creating extreme incentive to overfish.
Ecological Role
As apex predators, bluefin regulate populations of herring, mackerel, and squid: their loss cascades downward.

Case Study: Shark Finning

Sharks ✕ Rays / Skates ↑ Large Fish ↑ Shellfish ↓ Small Fish ↓ Water Quality Declines (less filtration)

Fishing Down the Food Web

Decade Mean Trophic Level 2.0 3.0 4.0 5.0 1950s 1970s 1990s 2010s Now Mean trophic level of global catch declines

Management Solutions

Marine Protected Areas
No-take zones allow fish populations to recover and spill over into adjacent fishing grounds.
Catch Quotas
Science-based Total Allowable Catch (TAC) limits enforced by monitoring and penalties.
Gear Restrictions
Banning destructive gear (drift nets, bottom trawls) and mandating Bycatch Reduction Devices (BRDs).
Consumer Choice
Eco-labels (MSC certification) help consumers select sustainably harvested seafood.
International Treaties
UNCLOS and Regional Fisheries Management Organizations (RFMOs) coordinate across national boundaries.

Bycatch reduction changes gear selectivity
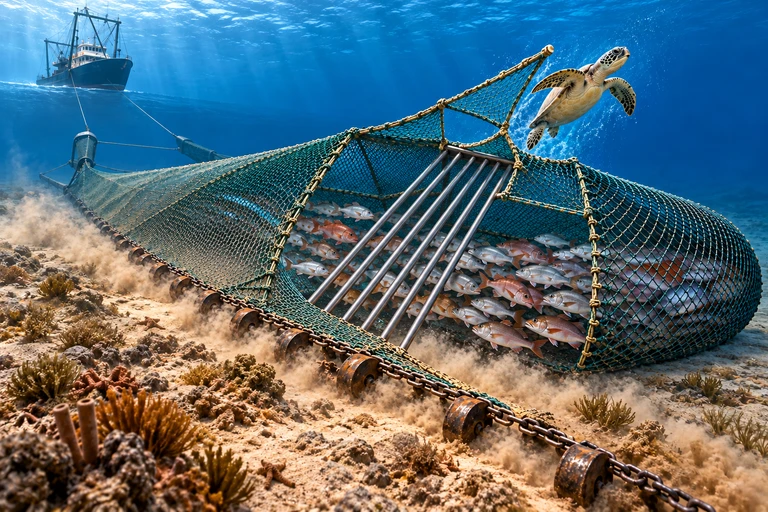
Net, codend, slanted grid and upper escape region are visible; a turtle exits and small fish remain within the net. Apparatus angle requires independent engineering verification.A size-selective grid can guide a large animal toward an escape opening while smaller target catch passes toward the codend. Performance depends on species, gear and operating conditions.

A size-selective grid creates an escape route
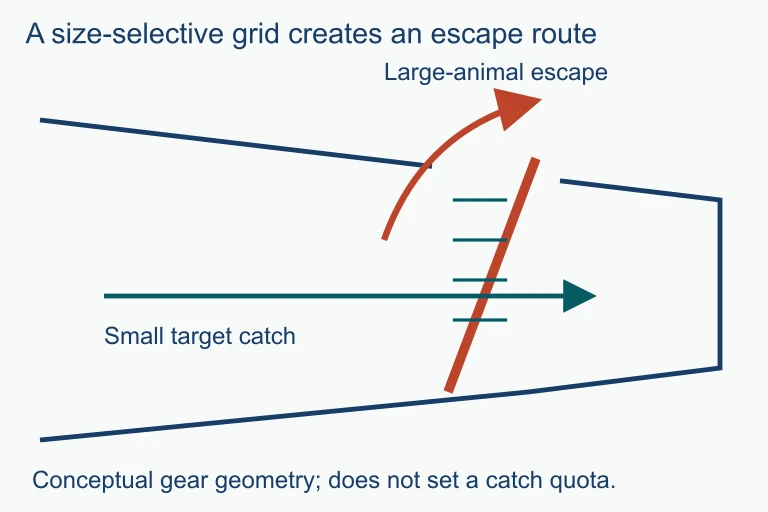
A size-selective grid creates an escape route. A size-selective grid can guide a large animal toward an escape opening while smaller target catch passes toward the codend. Performance depends on species, gear and operating conditions.A size-selective grid can guide a large animal toward an escape opening while smaller target catch passes toward the codend. Performance depends on species, gear and operating conditions.

Common Mistakes

✕ Confusing Overfishing with Extinction
Overfishing means populations drop below sustainable levels, not that the species disappears entirely. Commercial extinction (not worth catching) can happen long before biological extinction.
✕ Ignoring Bycatch
Students often focus only on the target species. On the AP exam, always consider bycatch impacts on non-target organisms like marine mammals and sea turtles.
✕ Forgetting Trophic Cascades
Removing one species doesn't just affect that species. Always trace effects up and down the food web: predators, prey, and producers are all connected.

Question 1 of 5

What does Maximum Sustainable Yield (MSY) represent?

Question 2 of 5

If apex predators like sharks are removed from a marine ecosystem, what is the most likely immediate effect?

Question 3 of 5

The concept of "fishing down the food web" describes which trend?

Question 4 of 5

The Newfoundland cod fishery collapsed in 1992. Which statement best explains why the stock has not recovered decades later?

Question 5 of 5

Which management strategy directly addresses the problem of bycatch?