01 / 21

Hydroelectric
Power

Explore how falling water is converted into electrical energy, the physics behind dams, and the environmental trade-offs of one of the world's oldest renewable energy sources.

AP Environmental Science

What Is Hydroelectric Power?

Hydroelectric power (hydropower) is the generation of electricity using the kinetic energy of flowing or falling water. Water stored behind a dam possesses gravitational potential energy, which is converted to kinetic energy as it flows downhill, spinning turbines connected to generators.

Key Terms to Know

Reservoir
An artificial lake behind a dam that stores water at an elevated height, providing gravitational potential energy.
Turbine
A rotary device that converts the kinetic energy of moving water into mechanical energy by spinning blades.
Generator
A machine coupled to the turbine that converts mechanical rotation into electrical energy via electromagnetic induction.
Head
The vertical distance water falls from the reservoir surface to the turbine: a critical factor in power output.
Flow Rate
The volume of water passing through the turbine per unit time, measured in \( \text{m}^3/\text{s} \).

Anatomy of a Hydroelectric Dam

Reservoir Dam Penstock Turbine Gen. Generator Power Lines Head (h) Outflow

The Power Equation

The theoretical power output of a hydroelectric system is given by:

\( P \)
Power output in watts (W)
\( \eta \)
Efficiency of the system (0 to 1)
\( \rho \)
Density of water: \( 1000\;\text{kg/m}^3 \)
\( g \)
Gravitational acceleration: \( 9.8\;\text{m/s}^2 \)
\( Q \)
Flow rate in \( \text{m}^3/\text{s} \)
\( h \)
Hydraulic head (height) in meters

Energy Conversion Chain

Gravitational PE Kinetic Energy Mechanical Energy Electrical Energy Reservoir Falling Water Turbine Spin Generator

Hydraulic head and discharge drive turbine power
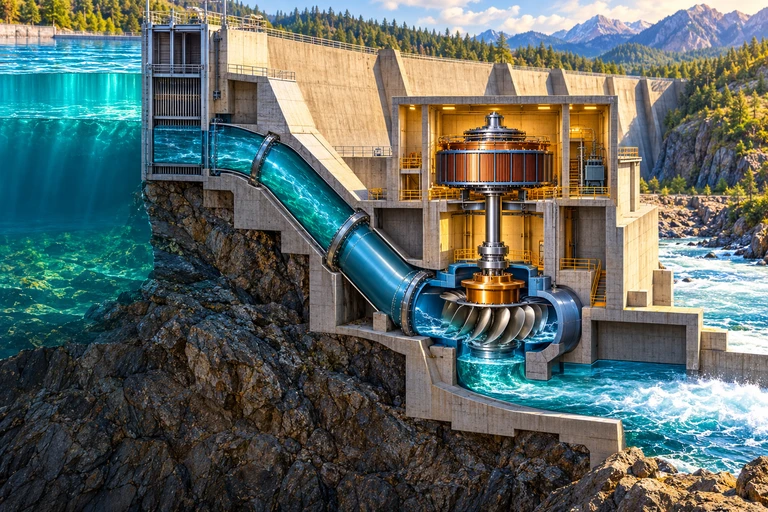
A cutaway dam showing intake, descending penstock, turbine, generator shaft and downstream tailrace.At 80 m of net head, a flow of 25 m³/s produces 17.64 MW with 90% conversion efficiency. Annual energy additionally depends on how long the plant operates and its capacity factor.

Head and flow deliver energy to the turbine
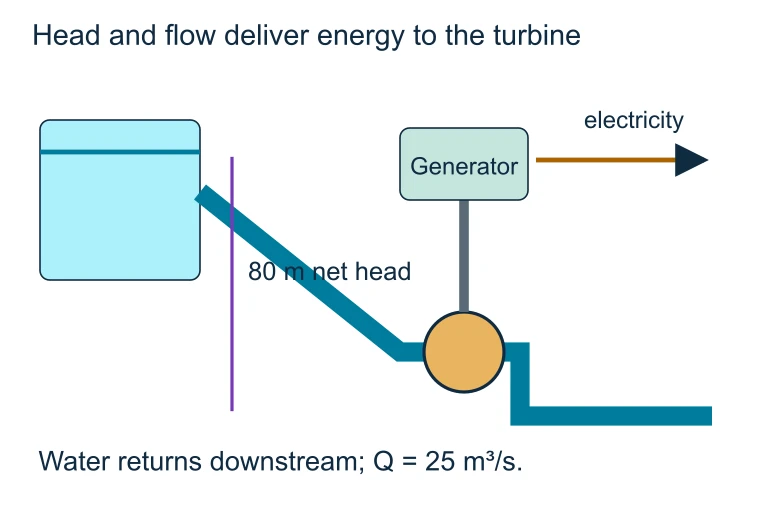
Head and flow deliver energy to the turbine. At 80 m of net head, a flow of 25 m³/s produces 17.64 MW with 90% conversion efficiency. Annual energy additionally depends on how long the plant operates and its capacity factor.At 80 m of net head, a flow of 25 m³/s produces 17.64 MW with 90% conversion efficiency. Annual energy additionally depends on how long the plant operates and its capacity factor.

Power and annual energy are different
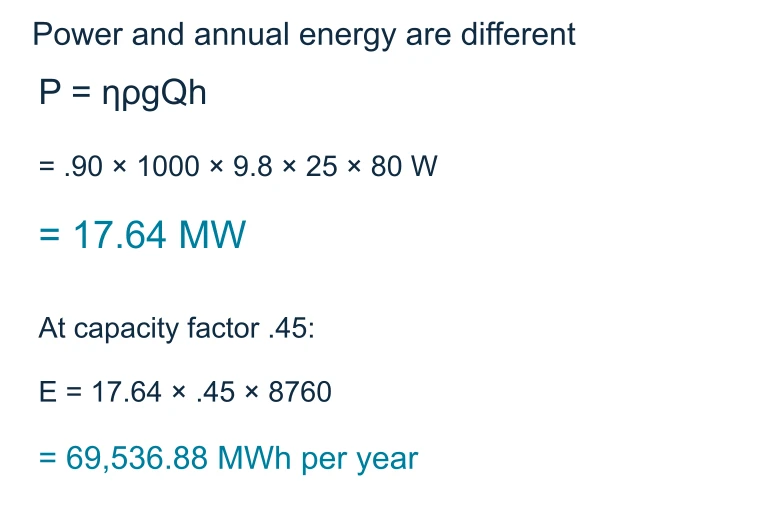
Power and annual energy are different. Hydraulic power depends on water density, gravity, discharge and net head. With 25 m³/s, 80 m net head and 90% efficiency, electrical output is 17.64 MW.Hydraulic power depends on water density, gravity, discharge and net head. With 25 m³/s, 80 m net head and 90% efficiency, electrical output is 17.64 MW.

Types of Hydropower Systems

Conventional Dam
A large dam creates a reservoir. Water is released through penstocks to turbines. Provides baseload power and can be dispatched on demand.
Run-of-River
Diverts a portion of river flow through turbines without a large reservoir. Lower environmental impact but output varies with natural flow.
Pumped Storage
Water is pumped uphill during low demand, then released to generate electricity during peak demand. Acts as a giant rechargeable battery.

Explain energy storage rather than a new primary energy source.

Use this illustration to explore the concept described in its caption.
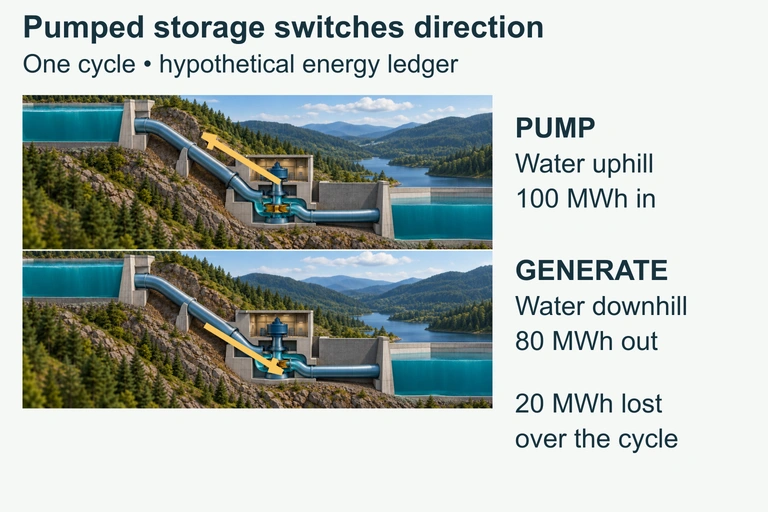
Two matching cross-sections show upper and lower reservoirs connected through a penstock and reversible pump-turbine. Separate exact arrows distinguish uphill pumping from downhill generation, and a cycle account returns 80 MWh from 100 MWh input.
Pumped storage consumes electricity while moving water uphill and returns part of that energy during downhill generation. The hypothetical cycle returns 80 MWh from 100 MWh of input.

Conventional vs Run-of-River

Conventional Dam Run-of-River
Reservoir Large artificial lake Little or no storage
Land Impact High: floods valleys Low: minimal flooding
Flow Control Can regulate release Dependent on river flow
Power Reliability High: dispatchable Variable: seasonal
Fish Migration Major barrier Less disruptive

Benefits of Hydroelectric Power

1
Low greenhouse gas emissions. No direct combustion of fossil fuels during operation.
2
Renewable resource. The water cycle continuously replenishes the supply of water.
3
Dispatchable power. Can ramp up or down quickly to match electricity demand, unlike solar or wind.
4
Long lifespan. Dams can operate for 50-100+ years, with relatively low operating costs.
5
Multi-purpose. Reservoirs also provide flood control, irrigation, and recreational opportunities.

Environmental Drawbacks

1
Habitat destruction. Reservoirs flood terrestrial ecosystems, displacing wildlife and communities.
2
Disrupted fish migration. Dams block upstream spawning routes for species like salmon.
3
Altered sediment flow. Trapping sediment behind the dam degrades downstream ecosystems and erodes deltas.
4
Methane emissions. Decomposing organic matter in reservoirs (especially in tropical regions) releases \( \text{CH}_4 \), a potent greenhouse gas.
5
Downstream flow changes. Reduced water flow harms riparian habitats and can lower water tables.

A dam changes sediment continuity and fish connectivity
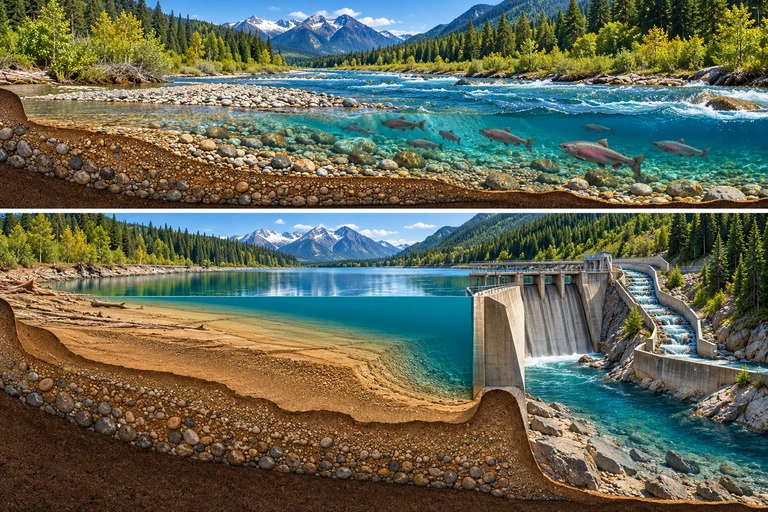
Connected undammed river above a reservoir and dam that trap sediment below.A reservoir can trap sediment while a dam interrupts fish migration. A fish bypass addresses connectivity for particular species and conditions; it does not restore sediment continuity.

A dam breaks two different pathways
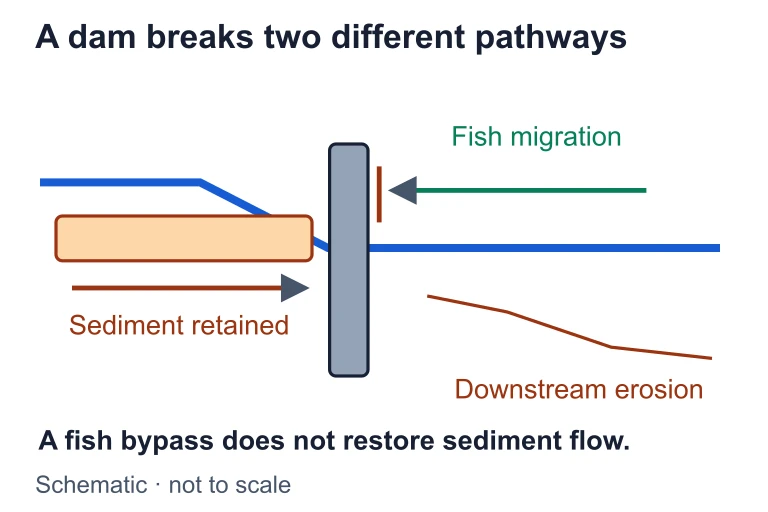
A dam breaks two different pathways. A reservoir can trap sediment while a dam interrupts fish migration. A fish bypass addresses connectivity for particular species and conditions; it does not restore sediment continuity.A reservoir can trap sediment while a dam interrupts fish migration. A fish bypass addresses connectivity for particular species and conditions; it does not restore sediment continuity.

How to Calculate Power Output

1
Identify the variables: head \( h \) (m), flow rate \( Q \) (\( \text{m}^3/\text{s} \)), and efficiency \( \eta \).
2
Use constants: \( \rho = 1000\;\text{kg/m}^3 \) and \( g = 9.8\;\text{m/s}^2 \).
3
Plug into the formula: \( P = \eta \cdot \rho \cdot g \cdot Q \cdot h \).
4
Compute the product. Result is in watts (W). Divide by \( 10^6 \) for megawatts (MW).
5
Interpret: Compare to known capacities. A typical home uses about \( 1\;\text{kW} \) on average.

Example 1: Small Dam

A small hydroelectric dam has a head of \( h = 20\;\text{m} \), a flow rate of \( Q = 5\;\text{m}^3/\text{s} \), and a turbine efficiency of \( \eta = 0.85 \). Find the power output.

Example 2: Large Dam

A major dam has a head of \( h = 180\;\text{m} \), a flow rate of \( Q = 600\;\text{m}^3/\text{s} \), and efficiency \( \eta = 0.90 \). Calculate the power output in megawatts.

Example 3: Efficiency Matters

Two dams have the same head (\( h = 50\;\text{m} \)) and flow rate (\( Q = 100\;\text{m}^3/\text{s} \)). Dam A has \( \eta = 0.90 \) and Dam B has \( \eta = 0.70 \). How much more power does Dam A produce?

Common Mistakes

✕ Calling hydro "zero emissions"
Reservoirs can emit significant \( \text{CH}_4 \) from decomposing organic matter, especially in tropical climates. Say low-emission, not zero.
✕ Confusing head with depth
Head \( h \) is the vertical drop from reservoir surface to turbine, not the depth of the reservoir itself.
✕ Ignoring efficiency
The theoretical max is never reached. Always include \( \eta \) in calculations. Omitting it overestimates output by 10-15%.
✕ Run-of-river = no impact
While lower impact than dams, run-of-river still alters water flow, temperature, and dissolved oxygen levels downstream.
✕ Assuming constant output
Droughts and seasonal changes reduce reservoir levels and flow rates, decreasing actual power generation.

Hydropower at a Glance

Conventional Run-of-River Pumped Storage
Primary Purpose Baseload generation Continuous generation Energy storage
Reservoir Size Large None / small Two (upper + lower)
Dispatchable? Yes Limited Yes
Ecological Impact High Moderate Moderate
Capacity Factor 40-60% 30-50% 20-40%

Question 1 of 5

In the hydroelectric power equation \( P = \eta \rho g Q h \), which variable represents the vertical distance water falls from the reservoir to the turbine?

Question 2 of 5

A hydroelectric plant has \( h = 40\;\text{m} \), \( Q = 10\;\text{m}^3/\text{s} \), and \( \eta = 0.85 \). What is the approximate power output?

Question 3 of 5

Which type of hydropower system functions primarily as an energy storage mechanism, pumping water uphill during low demand?

Question 4 of 5

Which of the following is a significant environmental concern associated with large conventional hydroelectric dams?

Question 5 of 5

Why is it inaccurate to describe hydroelectric reservoirs as producing "zero greenhouse gas emissions"?