01 / 24

Human Impacts on
Biodiversity

Explore how human activities drive species loss, disrupt ecosystems, and discover the strategies scientists use to protect biological diversity.

AP Environmental Science

What Is Biodiversity?

Biodiversity is the variety of life at every level of biological organization: from genes within a single population, to the range of species in an ecosystem, to the mosaic of ecosystems across the planet.

Genetic Diversity
Variation in DNA within a species: alleles, gene frequencies, and heritable traits that help populations adapt.
Species Diversity
The number and relative abundance of different species in a given area: richness and evenness combined.
Ecosystem Diversity
The variety of habitats, biological communities, and ecological processes across a landscape or biosphere.

Why Biodiversity Matters

Biodiversity provides ecosystem services that sustain all life on Earth: clean air, water filtration, pollination, nutrient cycling, and climate regulation. The economic value of these services has been estimated at trillions of dollars annually.

1
Provisioning: Food, timber, medicine, fresh water, and genetic resources for agriculture.
2
Regulating: Climate stability, flood control, disease regulation, and water purification by wetlands.
3
Supporting: Nutrient cycling, soil formation, and primary production that underpin all other services.
4
Cultural: Recreational, aesthetic, spiritual, and educational value drawn from natural systems.

The Biodiversity Crisis

Scientists estimate that current extinction rates are 100 to 1,000 times the natural background rate. The Living Planet Index shows a 69% decline in monitored wildlife populations since 1970.

100% 75% 50% 25% 1970 1980 1990 2000 2020 31% Living Planet Index (1970 = 100%) 100%

The HIPPCO Framework

Environmental scientists use the acronym HIPPCO to categorize the six major drivers of biodiversity loss. Understanding each driver is essential for the AP exam.

H
Habitat destruction: Deforestation, urbanization, and agriculture converting natural habitats.
I
Invasive species: Non-native organisms that outcompete, prey upon, or spread disease to native species.
P
Population growth: Rising human population increases resource demand and land conversion.
P
Pollution: Chemical, nutrient, and plastic pollution degrades air, water, and soil quality.
C
Climate change: Shifting temperatures and weather patterns alter habitats faster than species can adapt.
O
Overexploitation: Overharvesting species through hunting, fishing, or logging beyond sustainable rates.

Multiple biodiversity threats interact through one landscape
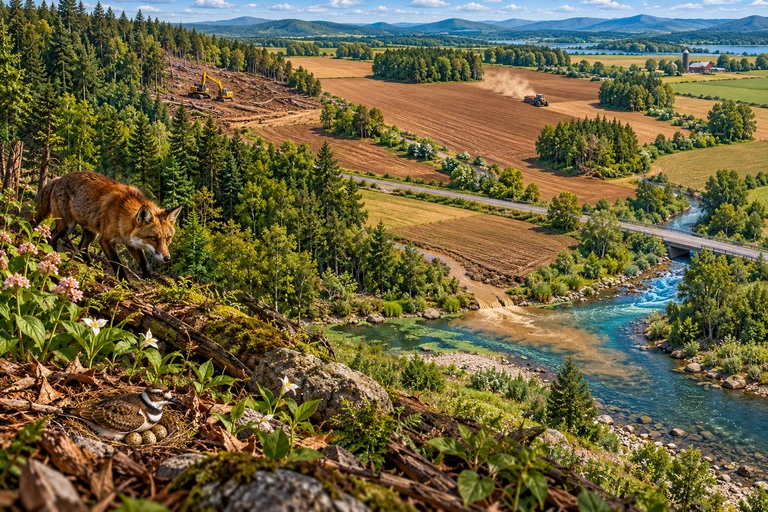
Forest remnants,cropland,road and runoff share a hypothetical watershed with a predator near a bird nest.Habitat barriers can restrict movement, while pollution, climate change and other pressures affect organisms through additional mechanisms. Evidence is needed to determine whether their combined effects are additive, antagonistic or synergistic.

Fragmentation can reduce connectivity
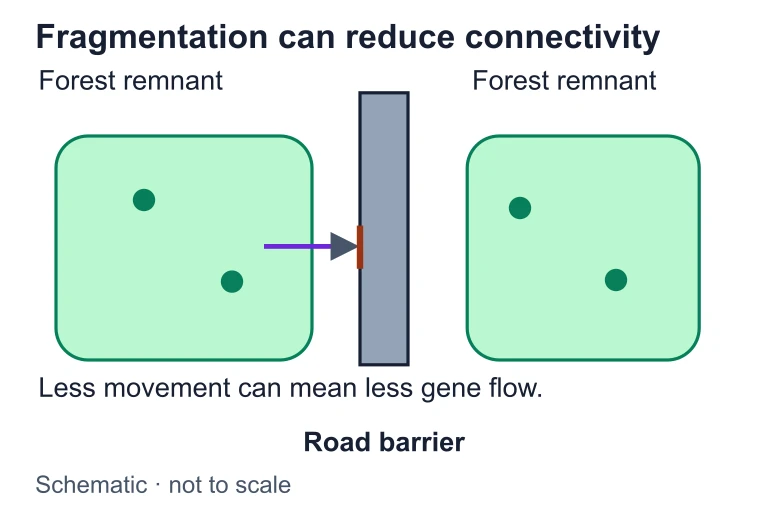
Fragmentation can reduce connectivity. Habitat barriers can restrict movement, while pollution, climate change and other pressures affect organisms through additional mechanisms. Evidence is needed to determine whether their combined effects are additive, antagonistic or synergistic.Habitat barriers can restrict movement, while pollution, climate change and other pressures affect organisms through additional mechanisms. Evidence is needed to determine whether their combined effects are additive, antagonistic or synergistic.

Habitat Loss: The Leading Driver

Habitat destruction accounts for the largest share of biodiversity loss worldwide. Forests, wetlands, and grasslands are converted to farmland, cities, and infrastructure at an alarming rate.

Intact Forest High biodiversity Fragmented Reduced diversity Destroyed Collapse Edge effects minimal Edge effects increase Habitat gone Fragmentation Conversion

Invasive vs. Native Species

Not every non-native species becomes invasive. Understanding the distinction is key for AP Environmental Science.

Native Species Invasive Species
Origin Evolved in the ecosystem Introduced from elsewhere
Natural predators Present in food web Often absent
Population control Regulated by ecosystem Grows unchecked
Ecological role Fills established niche Outcompetes natives for niche
Example American chestnut Kudzu vine

Pollution and Bioaccumulation

Bioaccumulation is the buildup of toxins in an organism's body over time. Biomagnification amplifies those toxins at each trophic level of a food chain.

Producers (Phytoplankton) Toxin: low concentration Primary Consumers Toxin: moderate Secondary Consumers Apex Predator Toxin concentration Biomagnification Through Trophic Levels

Climate Change and Shifting Ranges

As global temperatures rise, species must either migrate, adapt, or face extinction. Many species cannot move fast enough to track their shifting climate envelope.

Range Shifts
Species move poleward or to higher elevations. Mountaintop species run out of habitat as warming pushes their range upward.
Phenology Mismatch
Timing of migrations, blooms, and breeding shifts unevenly. Pollinators may arrive before or after flowers bloom.
Ocean Acidification
Increased \(\text{CO}_2\) dissolves in seawater, lowering pH and threatening coral reefs and shell-forming organisms.

Distinguish movement of suitable climate from successful organism dispersal.

Use this illustration to explore the concept described in its caption.
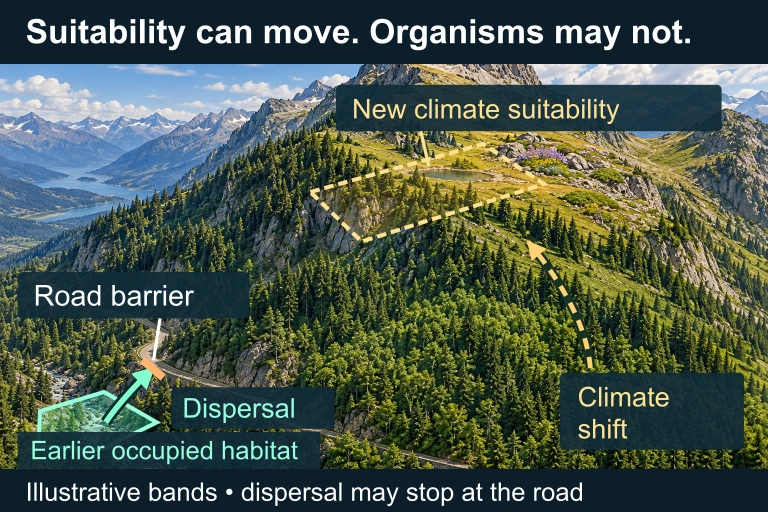
A mountain landscape has an earlier occupied lower habitat band below a road and a separate upper climate-suitability band. A solid dispersal arrow stops at the road; a separate dashed arrow marks climate suitability shifting uphill. New suitability does not establish occupancy.
A shifting climate envelope can leave suitable habitat separated by roads or development. Adult immobility does not preclude dispersal by seeds or larvae. Colored bands and arrows are conceptual overlays, not measured species locations. The upper suitability band does not establish occupancy; the road can constrain the shown dispersal path but is not universally impermeable.

Overexploitation of Resources

When humans harvest a species faster than it can reproduce, the population declines toward extinction. This applies to fishing, hunting, logging, and the wildlife trade.

Population Time Sustainable K Overexploited Recovery Management begins Population Dynamics Under Harvesting

The Species-Area Relationship

One of ecology's most reliable patterns: larger areas support more species. This is modeled by the power function:

Species (S) Area (A)
\(S = cA^z\)
Species-Area Curve

Implication: When habitat area is halved, we don't lose half the species, but the loss is significant: approximately 16% of species when \(z = 0.25\), since \(0.5^{0.25} \approx 0.84\).

How to Analyze Biodiversity Impacts

Use this step-by-step approach when evaluating a scenario on the AP exam:

1
Identify the HIPPCO driver(s): Determine which of the six threats are at play in the scenario.
2
Determine the scale: Is this local (one wetland), regional (a watershed), or global (climate change)?
3
Trace the ecological mechanism: How does the driver affect species? Loss of food source, breeding habitat, genetic bottleneck?
4
Consider cascading effects: Does removing one species trigger trophic cascades or ecosystem collapse?
5
Propose mitigation strategies: What conservation approaches (protected areas, corridors, regulations) would reduce the impact?

Example: Deforestation in the Amazon

Suppose 30% of the Amazon rainforest is cleared for cattle ranching. Use the species-area relationship (\(z = 0.25\)) to estimate species loss.

Example: Invasive Cane Toads in Australia

Cane toads (Rhinella marina) were introduced in 1935 to control beetle pests in sugarcane fields. Instead, they became one of Australia's worst invasive species.

1
HIPPCO driver: Invasive species (I)
2
Mechanism: Cane toads are toxic: native predators (quolls, snakes, monitor lizards) that eat them die from the poison, causing population crashes.
3
Cascading effects: Loss of predators alters insect populations and prey dynamics. Toads also compete with native frogs for food and breeding sites.
4
Mitigation: "Toad-smart" predator training programs, gene-drive research, and physical barriers are being tested.

Example: Coral Bleaching and Climate Change

Coral reefs support ~25% of marine species but cover <1% of the ocean floor. Rising sea temperatures cause coral bleaching: corals expel symbiotic zooxanthellae algae and turn white.

Healthy Coral Zooxanthellae present
\(+1\text{–}2^\circ\text{C}\)
Bleached Coral Algae expelled Recovery (if temps drop) Death (prolonged stress) Coral Bleaching Cascade

Common Mistakes on the AP Exam

✕ Confusing Introduced and Invasive
Not all non-native species are invasive. A species is invasive only if it causes ecological or economic harm.
✕ Ignoring Synergistic Effects
HIPPCO threats rarely act alone. Climate change + habitat loss together are worse than the sum of their parts.
✕ Bioaccumulation vs. Biomagnification
Bioaccumulation is toxin buildup in one organism. Biomagnification is increasing concentration across trophic levels.
✕ Equating Habitat Loss with Proportional Species Loss
The species-area relationship is a power function, not linear. Losing 50% of habitat does not mean losing 50% of species.
✕ Forgetting Genetic Diversity
Biodiversity is not just species counts. Loss of genetic diversity within a species reduces adaptive potential and resilience.

HIPPCO Summary Comparison

Driver Mechanism Example Scale
Habitat Destruction Land conversion, fragmentation Amazon deforestation Local → Global
Invasive Species Competition, predation, disease Cane toads in Australia Regional
Population Growth Resource demand, land use Urban sprawl Global
Pollution Toxins, eutrophication DDT, Gulf dead zones Local → Regional
Climate Change Range shifts, acidification Coral bleaching Global
Overexploitation Harvest exceeds reproduction Atlantic cod collapse Regional

Conservation Strategies

Protected Areas
National parks, marine reserves, and wilderness areas that restrict human activity to preserve habitats and species.
Wildlife Corridors
Strips of habitat connecting fragmented patches, allowing gene flow and species migration between isolated populations.
Legislation
Laws such as the Endangered Species Act (ESA), CITES, and the Clean Water Act that regulate human impacts on species and habitats.
Captive Breeding
Breeding programs for critically endangered species (California condor, black-footed ferret) with eventual reintroduction to the wild.

Habitat fragmentation, corridors and gene flow
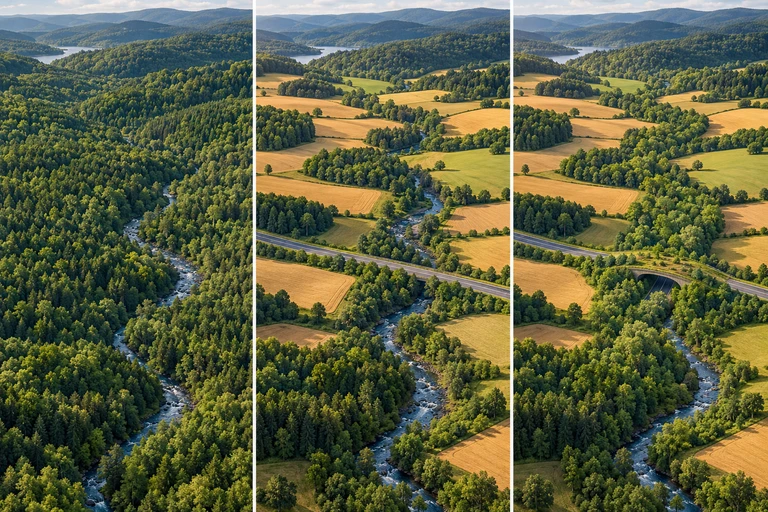
Three qualitative forest landscapes show continuous woodland, fragmented woodland and a restored vegetated road crossing.Movement between fragments does not by itself establish gene flow. Movement tracking, reproduction and parentage evidence answer different parts of the conservation question.

Movement does not prove gene flow
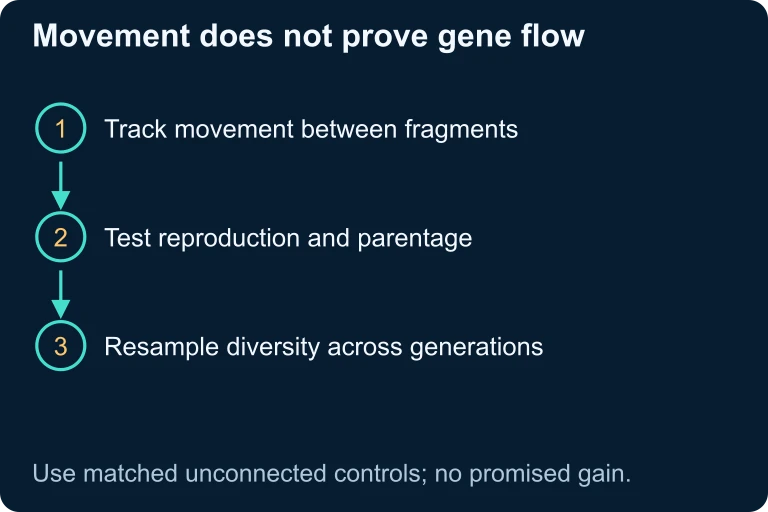
Movement does not prove gene flow. Tracking movement tests connectivity. Parentage, successful reproduction and changes in genetic composition supply additional evidence for gene flow.Tracking movement tests connectivity. Parentage, successful reproduction and changes in genetic composition supply additional evidence for gene flow.

Key Takeaways

1
Biodiversity operates at three levels: genetic, species, and ecosystem diversity all matter for resilience.
2
HIPPCO summarizes six major threats: Habitat loss, Invasive species, Population growth, Pollution, Climate change, Overexploitation.
3
Habitat destruction is the leading driver, and the species-area relationship (\(S = cA^z\)) quantifies expected losses.
4
Biomagnification concentrates toxins up food chains: apex predators are most affected.
5
Conservation strategies include protected areas, corridors, legislation, and captive breeding programs.

Question 1 of 5

Which of the following is not one of the three levels of biodiversity?

Question 2 of 5

Using the species-area relationship \(S = cA^z\) with \(z = 0.25\), if 50% of a habitat is destroyed, approximately what percentage of species would be expected to survive?

Question 3 of 5

DDT was found at the highest concentration in which organisms?

Question 4 of 5

A developer plans to build a road through a national forest, splitting it into two separate sections. Which ecological concern is most directly addressed by building a wildlife corridor?

Question 5 of 5

Which HIPPCO category best describes the primary threat posed by cane toads in Australia?