01 / 21

Global
Climate Change

Explore the science behind rising temperatures, the greenhouse effect, feedback loops, and the evidence driving our understanding of Earth's changing climate.

AP Environmental Science

What Is Climate Change?

Climate is the long-term average of weather patterns in a region, typically measured over 30 years or more. Climate change refers to significant, lasting shifts in these patterns: temperature, precipitation, wind, and ocean currents.

While Earth's climate has changed naturally over geological time, the current rate of warming is unprecedented in the past 10,000 years, driven primarily by anthropogenic (human-caused) emissions of greenhouse gases.

The Greenhouse Effect

Sun Shortwave (visible) Earth's Surface Longwave (IR) Atmosphere (GHGs) Trapped heat Some escapes Space

Key Greenhouse Gases

\(\text{CO}_2\)
Carbon dioxide: fossil fuel combustion, deforestation. Accounts for ~76% of anthropogenic GHG emissions.
\(\text{CH}_4\)
Methane: agriculture (livestock), landfills, natural gas. ~28× more potent than \(\text{CO}_2\) over 100 years.
\(\text{N}_2\text{O}\)
Nitrous oxide: fertilizers, combustion. ~265× the warming potential of \(\text{CO}_2\) over 100 years.

Radiative Forcing: The Energy Imbalance

Radiative forcing (\(\Delta F\)) measures the change in net energy flux at the top of the atmosphere, in watts per square meter (\(\text{W/m}^2\)). A positive forcing warms the planet; a negative forcing cools it.

Forcing (W/m²) Source 0 +2 -1 +1.82 CO₂ +0.48 CH₄ +0.17 N₂O -0.75 Aerosols

Evidence for Climate Change

1
Temperature records: Global average surface temperature has risen approximately \(1.1\)°C since the pre-industrial era (1850–1900).
2
Ice core data: Air bubbles trapped in Antarctic ice cores show \(\text{CO}_2\) levels correlating with temperature over 800,000 years.
3
Sea level rise: Global sea level has risen ~21 cm since 1900 due to thermal expansion and ice melt.
4
Glacier retreat: Mountain glaciers worldwide are losing mass at accelerating rates.
5
Ocean acidification: Oceans have absorbed ~30% of anthropogenic \(\text{CO}_2\), lowering pH by ~0.1 units since 1900.

\(\text{CO}_2\) Concentration Over Time

CO₂ (ppm) Year 280 320 360 400 420 1750 1850 1950 2000 2024 Pre-industrial ~280 ppm ~421 ppm (2024)

Weather vs Climate

Weather Climate
Timescale Hours to days Decades to millennia
Scale Local or regional Regional to global
Predictability ~10-day forecast limit Long-term trends modelable
Example "It snowed in April" "Winters are 2°C warmer on average"
Data Type Instantaneous observations 30+ year statistical averages

Positive and Negative Feedback Loops

Positive Feedback
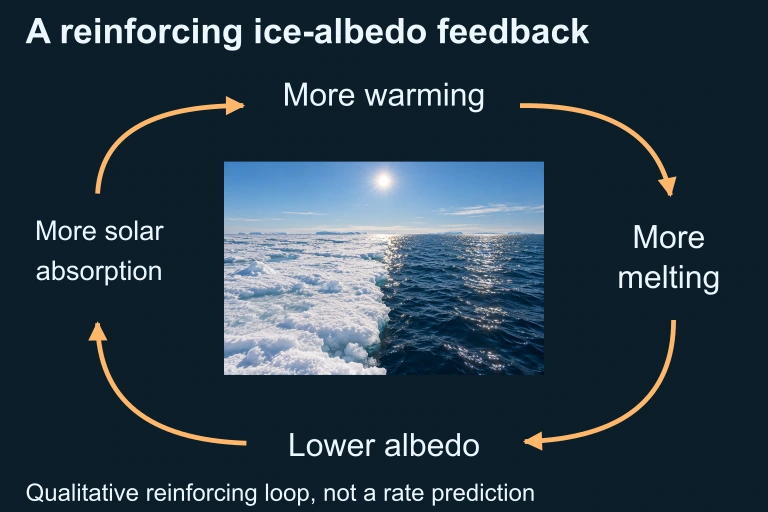
Amplifies the initial change. Example: warming melts ice, reducing albedo, which absorbs more heat, causing more warming.
Negative Feedback
Counteracts the initial change. Example: warming increases evaporation, forming more clouds that reflect sunlight, slightly cooling Earth.
Ice-Albedo Positive Feedback Temperature rises Ice & snow melt Albedo decreases More heat absorbed +

Trace the sign of a reinforcing feedback.

Use this illustration to explore the concept described in its caption.
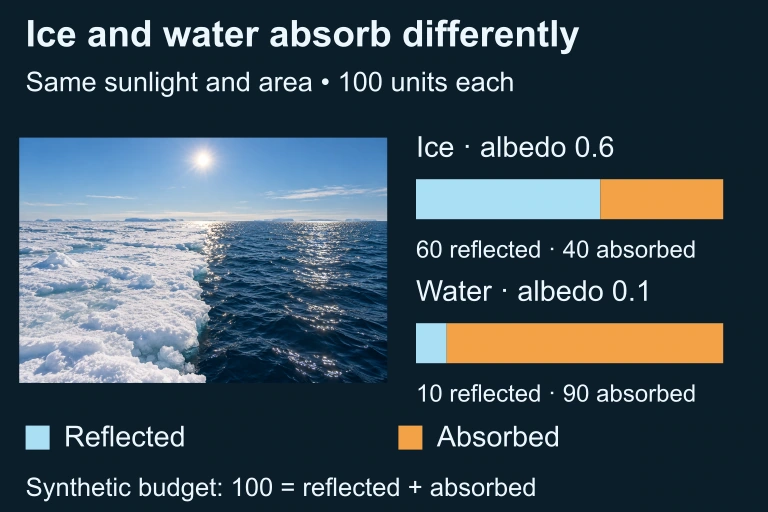
Preserved ice and open-water artwork is paired with two equal-length 100-unit budget bars: ice 60 reflected plus 40 absorbed, water 10 reflected plus 90 absorbed. A separate loop connects warming, melting, lower albedo and more solar absorption.
Under equal sunlight, the selected darker-water surface absorbs more radiation than the ice surface. Additional warming can reinforce melting and further reduce albedo. The synthetic budget gives 100 incident units to equal areas: ice reflects 60 and absorbs 40, while open water reflects 10 and absorbs 90. Bar lengths encode these exact totals; the separate feedback arrows are qualitative.
A loop links warming, ice melt, lower albedo and greater solar absorption back to warming.
Ice–albedo feedback reinforces an initial warming; the arrows show relationships, not feedback magnitude.

The Carbon Cycle Connection

Atmosphere Fossil Fuels +9.5 Gt C/yr Deforestation +1.1 Gt C/yr Ocean Uptake -2.5 Gt C/yr Land Sink -3.1 Gt C/yr Net imbalance: +5.0 Gt C/yr

How to Analyze Climate Data

1
Identify the variable: Determine what is being measured: temperature anomaly, \(\text{CO}_2\) concentration, sea level, ice extent, etc.
2
Establish the baseline: Climate data is often presented as anomalies (deviations from a reference period, e.g. 1951–1980 average).
3
Look for trends, not single points: Short-term variability is natural. Focus on the long-term direction over 30+ year windows.
4
Consider multiple lines of evidence: Temperature records, ice cores, sea level gauges, satellite data, and ocean chemistry all corroborate each other.
5
Evaluate uncertainty: Climate models include confidence intervals. Higher confidence means stronger agreement among models and datasets.

Example: Temperature Anomaly

A dataset shows global mean temperature anomalies relative to the 1951–1980 baseline. In 1980, the anomaly was \(+0.26\)°C. In 2023, it was \(+1.17\)°C. What was the rate of warming?

Example: Sea Level Rise

Thermal expansion accounts for about 40% of observed sea level rise. If total sea level rose 3.6 mm/yr from 2006–2018, what was the contribution from thermal expansion alone?

Thermal Expansion
Water expands as it warms. Even a fraction of a degree across the entire ocean raises sea level significantly.
Ice Sheet Loss
Greenland and Antarctic ice sheets are losing mass at accelerating rates, contributing ~1.4 mm/yr combined.

Example: Carbon Budget

The IPCC estimates a remaining carbon budget of ~500 Gt \(\text{CO}_2\) for a 50% chance of limiting warming to \(1.5\)°C. Current annual emissions are ~40 Gt \(\text{CO}_2\)/yr. How many years remain at current rates?

Mitigation and adaptation act on different parts of the risk pathway

A coastal community with elevated homes, wetland buffer, warning mast, solar arrays and wind turbines.Cleaner electricity and carbon storage can reduce future climate forcing. Elevated infrastructure, warnings, buffers and retreat can reduce exposure or vulnerability. Wetlands can support both responses through different mechanisms.

Mitigation and adaptation intervene differently
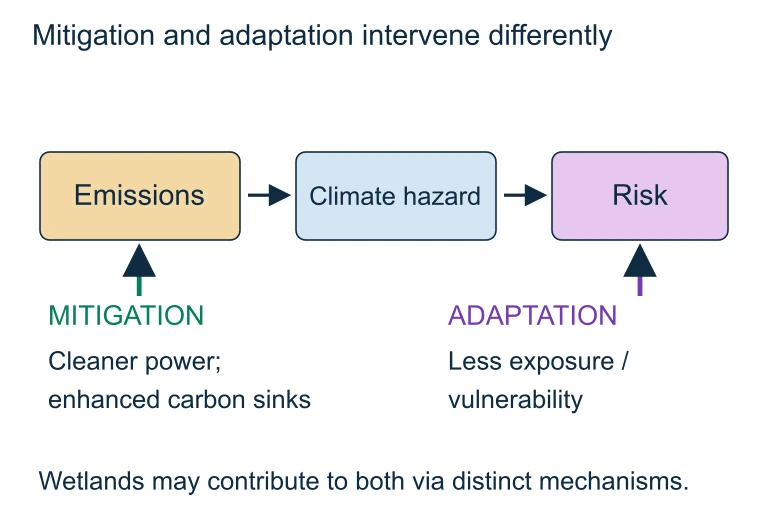
Mitigation and adaptation intervene differently. Cleaner electricity and carbon storage can reduce future climate forcing. Elevated infrastructure, warnings, buffers and retreat can reduce exposure or vulnerability. Wetlands can support both responses through different mechanisms.Cleaner electricity and carbon storage can reduce future climate forcing. Elevated infrastructure, warnings, buffers and retreat can reduce exposure or vulnerability. Wetlands can support both responses through different mechanisms.

Common Mistakes

✕ Confusing Weather and Climate
Using a single weather event ("It's cold today") to argue against long-term climate trends. Climate requires 30+ year analysis.
✕ Ignoring Feedback Loops
Assuming warming is purely linear. Positive feedbacks (ice-albedo, permafrost methane) can amplify initial changes exponentially.
✕ Mixing Up Positive and Negative
"Positive feedback" does NOT mean beneficial. In climate science, positive = amplifying, negative = stabilizing.

Summary of Key Concepts

Concept Key Detail AP Relevance
Greenhouse Effect GHGs trap longwave IR radiation Fundamental mechanism
Radiative Forcing +2.72 W/m² (net anthropogenic) Energy balance questions
CO₂ Trend 280 → 421 ppm since 1750 Graph interpretation
Feedback Loops Ice-albedo, water vapor, clouds Amplification questions
Carbon Budget ~500 Gt CO₂ for 1.5°C target Calculation problems
Sea Level Rise ~3.6 mm/yr (thermal + ice melt) Impact assessment

Question 1 of 5

Which greenhouse gas has the highest global warming potential (GWP) per molecule over 100 years among the following?

Question 2 of 5

The ice-albedo feedback is an example of a:

Question 3 of 5

If total anthropogenic radiative forcing is \(+2.72\,\text{W/m}^2\) and aerosols contribute \(-0.75\,\text{W/m}^2\), what is the radiative forcing from greenhouse gases alone?

Question 4 of 5

A student argues: "The climate has changed naturally before, so current warming must also be natural." Which of the following best refutes this argument?

Question 5 of 5

If the remaining carbon budget for \(1.5\)°C is 500 Gt \(\text{CO}_2\) and a country emits 5 Gt \(\text{CO}_2\)/yr, how much of the global budget does this country consume in 10 years?