Food Chains &
Food Webs
Explore how energy flows through ecosystems, from producers to top predators, and discover how interconnected feeding relationships shape ecological communities.
What Is a Food Chain?
A food chain is a linear sequence that shows the transfer of energy and nutrients from one organism to the next. Each step in the chain is called a trophic level.
Understanding Trophic Levels
Why Do Food Chains Matter?
Understanding food chains is essential because they reveal the pathways of energy transfer that sustain all life. Disruption at any trophic level can trigger cascading effects throughout the ecosystem.
The 10% Rule of Energy Transfer
At each trophic level, approximately only \(10\%\) of the energy is passed on to the next level. The remaining \(90\%\) is lost as metabolic heat, used in cellular respiration, or lost as waste.
Calculating Energy Transfer
You can calculate the energy available at any trophic level using the formula:
Example: If producers store 20,000 kcal, how much energy is available to a tertiary consumer (\(n = 3\))?
Food Chain vs. Food Web
| Feature | Food Chain | Food Web |
|---|---|---|
| Structure | Linear, single pathway | Interconnected network of chains |
| Complexity | Simple | Complex |
| Realism | Simplified model | Closer to actual ecosystems |
| Stability | Disruption easily collapses it | More resilient due to alternative pathways |
| Organisms | Each has one food source | Each may have multiple food sources |
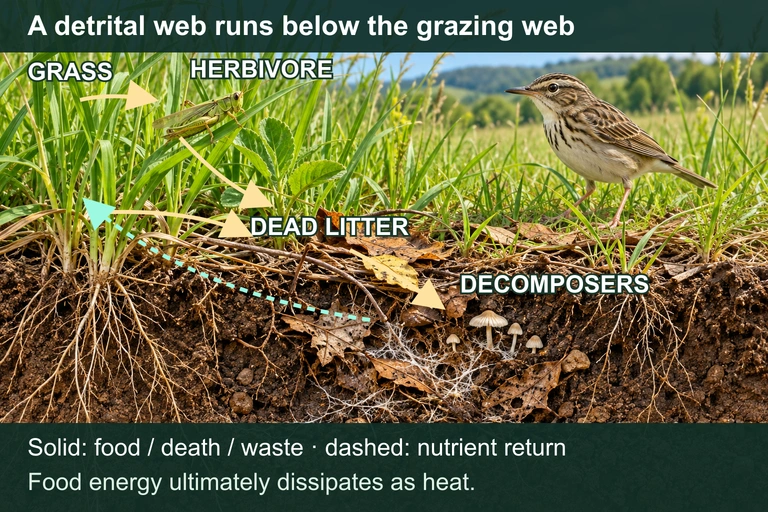
A Simple Food Web
Locate decomposers in many pathways rather than one final trophic tier.
Use this illustration to explore the concept described in its caption.
Keystone Species and Trophic Cascades
A keystone species has a disproportionately large effect on its ecosystem relative to its abundance. Removing a keystone species triggers a trophic cascade: a chain reaction of population changes across multiple trophic levels.
An otter’s feeding link changes an entire underwater forest
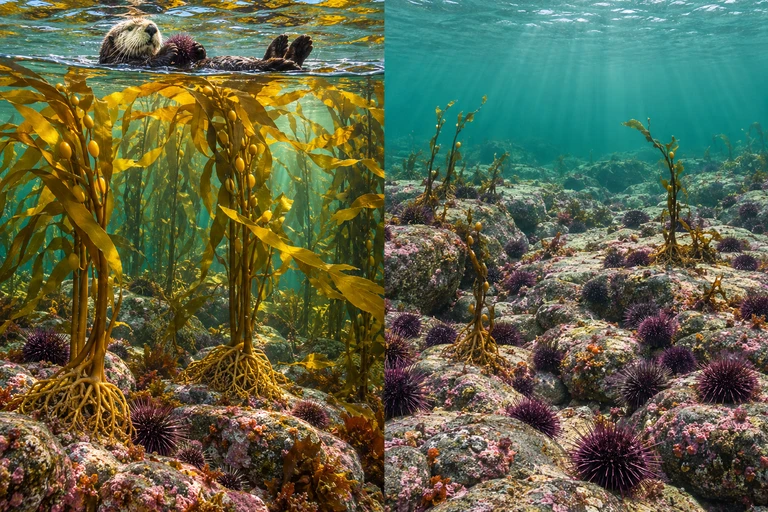 In this kelp–urchin–otter food web, otter feeding can limit urchin grazing and indirectly favor kelp. Other environmental conditions and interactions also influence kelp-forest outcomes.
Direct feeding can cause indirect effects
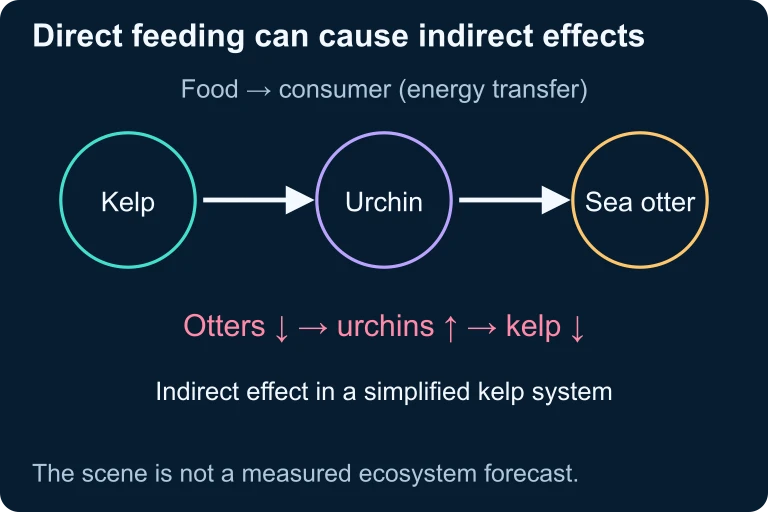 In this kelp–urchin–otter food web, otter feeding can limit urchin grazing and indirectly favor kelp. Other environmental conditions and interactions also influence kelp-forest outcomes.
How to Analyze a Food Web
Example: Energy Calculation
Problem: A grassland ecosystem's producers fix 50,000 kcal of energy per year. How much energy is available to a secondary consumer?
Example: Predicting Removal Effects
Question: If small fish are removed from this marine food web, what happens?
Example: Bioaccumulation of Toxins
Biomagnification occurs when toxins become more concentrated at higher trophic levels. DDT in an aquatic food chain is a classic example:
Bottom-Up vs. Top-Down Control
Common Mistakes to Avoid
Key Concepts Summary
| Concept | Definition | AP Exam Tip |
|---|---|---|
| Food Chain | Linear energy pathway | Simplified model: know limitations |
| Food Web | Interconnected feeding network | More realistic: predict cascading effects |
| 10% Rule | \(\sim 10\%\) energy transferred per level | Use \(E_n = E_0 \times (0.10)^n\) |
| Trophic Cascade | Multi-level population shifts | Classic example: wolves in Yellowstone |
| Biomagnification | Toxin concentration increases up chain | Top predators most affected |
| Keystone Species | Disproportionate ecological impact | Removal triggers trophic cascade |
Question 1 of 5
In a food chain, arrows represent the direction of:
Question 2 of 5
If producers in an ecosystem fix 80,000 kcal of energy, approximately how much energy is available to a tertiary consumer?
Question 3 of 5
In a food web, the removal of a keystone predator would most likely result in:
Question 4 of 5
Biomagnification of DDT in an aquatic food chain means that the highest concentrations of DDT would be found in:
Question 5 of 5
Scenario: In a pond ecosystem, algae are eaten by tadpoles and small crustaceans. Tadpoles are eaten by dragonfly larvae, and crustaceans are eaten by both dragonfly larvae and minnows. Minnows and dragonfly larvae are both consumed by a bass. A researcher removes all the minnows from the pond.
Which of the following is the most likely immediate result of removing minnows?