01 / 21

El Niño & La Niña
Pacific Ocean Oscillations

Explore how sea surface temperature anomalies in the tropical Pacific drive global weather patterns, disrupt ecosystems, and shape climate variability.

AP Environmental Science

What Is ENSO?

ENSO stands for El Niño–Southern Oscillation: a recurring climate pattern involving changes in sea surface temperatures (SST) across the tropical Pacific Ocean. It has three phases: El Niño (warm), La Niña (cool), and Neutral.

ENSO episodes typically last 9 to 12 months and recur every 2 to 7 years. They influence temperature, precipitation, and storm tracks on every continent.

Normal Pacific Conditions

Warm Pool
\( \approx 28\text{–}30\,{}^\circ\text{C}\)
Cool Upwelling
\( \approx 20\text{–}24\,{}^\circ\text{C}\)
Trade Winds Walker Circulation Upwelling Thermocline (tilted) West Pacific East Pacific

Why ENSO Matters

Weather Extremes
El Niño can shift jet streams, causing floods in South America and droughts in Australia and Southeast Asia.
Ecosystem Disruption
Reduced upwelling during El Niño can decrease nutrient supply and disrupt fisheries along the Peruvian coast.
Economic Impact
The 1997–98 El Niño caused an estimated $35 billion in global damages from crop failures and disasters.

El Niño Conditions

Warm Water Spreads East
SST anomaly: \(+1.5\) to \(+3\,{}^\circ\text{C}\)
Weakened Trade Winds Thermocline (flattened) Upwelling suppressed Convection shifts eastward West Pacific East Pacific

La Niña Conditions

Enhanced Cool Water
SST anomaly: \(-1\,{}^\circ\text{C}\) to \(-2\,{}^\circ\text{C}\)
Warm Pool Stronger Trade Winds Thermocline (steeper tilt) Enhanced Upwelling West Pacific East Pacific

El Niño vs. La Niña

Feature El Niño La Niña
SST Anomaly (East Pacific) Warmer (\(+1\,{}^\circ\text{C}\) to \(+3\,{}^\circ\text{C}\)) Cooler (\(-1\,{}^\circ\text{C}\) to \(-2\,{}^\circ\text{C}\))
Trade Winds Weaken / Reverse Strengthen
Thermocline Flattens Steepens
Upwelling (East) Suppressed Enhanced
Rainfall Shift East / Central Pacific Western Pacific
U.S. Winter Effect Warmer N., Wetter S. Colder N., Drier S.

Winds reshape the equatorial Pacific

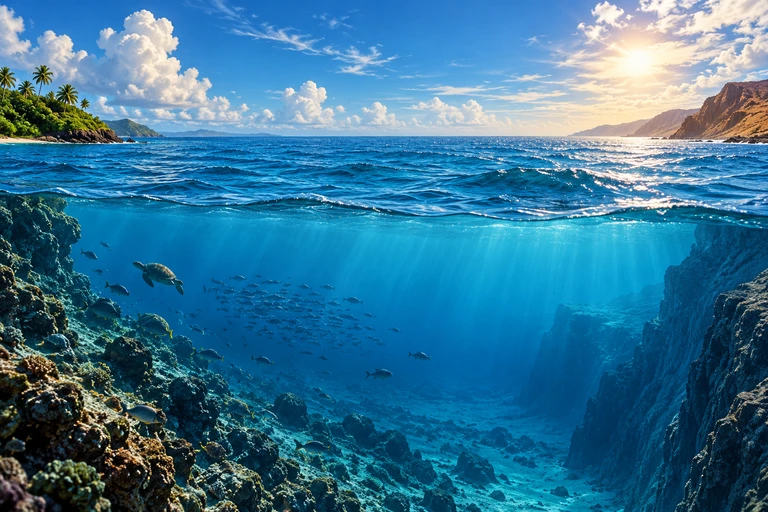
An ocean cutaway spans tropical western shores and the eastern Pacific margin, with cloud cover above and subsurface water visible.Trade winds reorganize warm surface water and the thermocline, changing the supply of cold water to the eastern Pacific surface.

Compare the three ENSO states
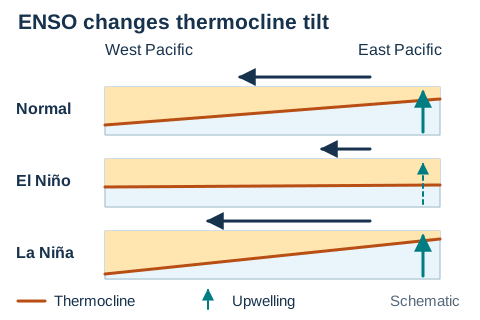
Aligned west-to-east Pacific cross-sections compare typical, El Niño and La Niña conditions. Wind arrows point westward, thermocline curves change tilt, and the reduced El Niño upwelling arrow is dashed.Typical trade winds drive surface water westward, leaving the thermocline deeper in the west and shallower in the east. Weaker winds during El Niño flatten this contrast and reduce eastern upwelling; stronger La Niña winds strengthen the contrast and eastern upwelling.Open full diagram

Measuring ENSO: the SOI

The Southern Oscillation Index (SOI) measures the pressure difference between Tahiti (east) and Darwin, Australia (west). It is one of the primary indicators scientists use to identify ENSO phases.

Negative SOI
Lower pressure in the east relative to west indicates El Niño conditions.
Positive SOI
Higher pressure in the east relative to west indicates La Niña conditions.

Positive Feedback in ENSO

Warm SST Anomaly Weaker Trades Less Upwelling / Warmer East Lower Pressure East Bjerknes Feedback

Global Teleconnections

ENSO does not just affect the tropical Pacific: it teleconnects to distant regions via shifts in atmospheric circulation patterns such as the jet stream and Hadley cells.

El Niño Effects
Wetter winters in southern U.S., drought in Australia/Indonesia, reduced Atlantic hurricane activity, coral bleaching in the Pacific.
La Niña Effects
Drier southern U.S., increased rainfall in Southeast Asia, more active Atlantic hurricane seasons, stronger Indian monsoons.

How to Identify the ENSO Phase

1
Check Niño 3.4 SST anomaly. Above \(+0.5\,{}^\circ\text{C}\) = El Niño. Below \(-0.5\,{}^\circ\text{C}\) = La Niña. In between = Neutral.
2
Look at the SOI. Sustained negative SOI supports El Niño; sustained positive SOI supports La Niña.
3
Examine trade wind behavior. Weakening or reversal indicates El Niño; strengthening indicates La Niña.
4
Observe precipitation patterns. Rainfall shifting to the central/eastern Pacific = El Niño; concentrated in the west = La Niña.
5
Confirm duration. Anomalies must persist for at least five consecutive overlapping 3-month periods to qualify as an official episode.

Example: 1997–98 El Niño

+3 +1.5 0 -1.5 -3
SST Anomaly (\(^\circ\text{C}\))
J F M A M J J A S O N D +0.5
\(+2.8\,{}^\circ\text{C}\) peak
1997

Example: 2010–11 La Niña

+3 +1.5 0 -1.5 -3
SST Anomaly (\(^\circ\text{C}\))
J F M A M J J A S O N D -0.5
\(-1.7\,{}^\circ\text{C}\) trough
2010

Ecological Impacts of ENSO

1
Marine food webs can be disrupted. Weaker nutrient-rich upwelling during El Niño can reduce phytoplankton and affect fish, seabirds, and marine mammals; responses vary by region and season.
2
Coral bleaching events. Elevated SSTs stress coral symbionts (zooxanthellae), triggering mass bleaching and potential reef death.
3
Terrestrial ecosystem shifts. Altered precipitation changes wildfire risk, vegetation growth, and species migration patterns globally.
4
Disease outbreaks. Warmer, wetter conditions in some regions expand the range of mosquito-borne diseases like malaria and dengue.

Trace an ocean-atmosphere perturbation into contrasting ecological impacts.

Use this illustration to explore the concept described in its caption.
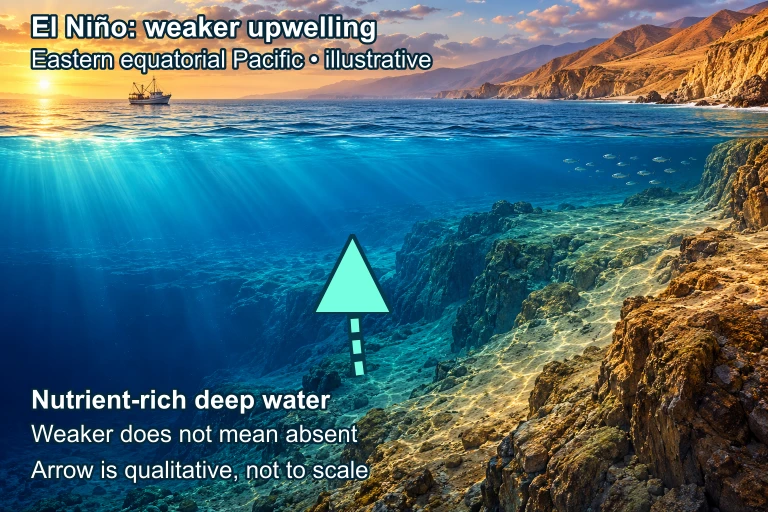
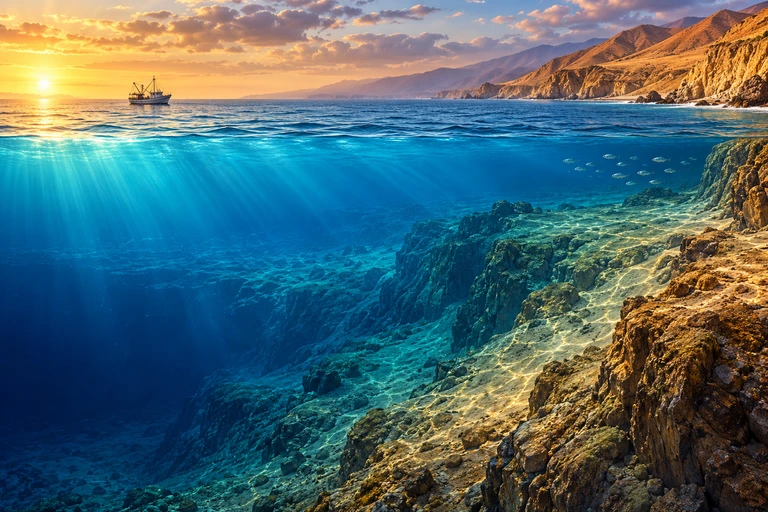
Illustrative coastal ocean with a fishing vessel and a turquoise upward arrow over deep water. Labels identify weaker upwelling during El Niño and note that the arrow is qualitative.
During the selected El Niño scenario, nutrient-rich upwelling in the eastern equatorial Pacific can weaken without stopping. Fishery and rainfall responses vary by region and season. The scene and arrow are qualitative, not measurements.
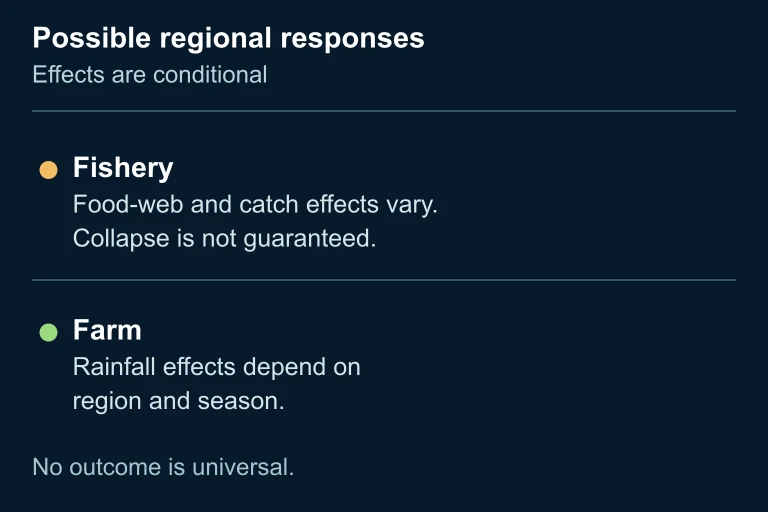
Two explanatory panels describe conditional fishery effects and region-dependent farm rainfall during El Niño.
Fishery food webs and catches can respond to weaker nutrient supply; rainfall effects on farms vary with region and season. Collapse is not inevitable.
A coastal ocean cutaway shows a fishing vessel and marine life above deeper water.
Illustrative coastal context; use the adjacent upwelling and regional-effects panels for the mechanism.

ENSO and Climate Change

Scientists are actively researching how anthropogenic climate change may alter ENSO behavior. While ENSO is a natural cycle, a warming planet could change its frequency, intensity, or teleconnection patterns.

Stronger Events?
Some models project more frequent extreme El Niño events as the baseline SST rises.
Shifted Patterns
Warming may shift ENSO's center of action or alter how it connects to mid-latitude weather.
Compound Risks
A strong El Niño atop a warming trend amplifies heat records: years like 2016 and 2023, which featured strong El Niños, have set new global temperature records.

Common Mistakes

✕ Confusing Cause and Effect
Students often say "El Niño causes trade winds to weaken." In reality, the weakening is part of a coupled feedback: the ocean and atmosphere influence each other simultaneously.
✕ Mixing Up the Phases
El Niño = warm east Pacific. La Niña = cool east Pacific. A common error is reversing which phase warms or cools the eastern side.
✕ Assuming Global Uniformity
ENSO effects vary by region. El Niño brings drought to some areas and flooding to others: never describe it as "warming the whole planet."

Question 1 of 5

During an El Niño event, what happens to the thermocline in the eastern Pacific?

Question 2 of 5

A sustained negative Southern Oscillation Index (SOI) most likely indicates which ENSO phase?

Question 3 of 5

Which of the following is a direct ecological consequence of suppressed upwelling during El Niño along the South American coast?

Question 4 of 5

The Bjerknes feedback is best described as:

Question 5 of 5

How does La Niña typically affect Atlantic hurricane activity?