Dose Response
Curve
Understand how organisms respond to increasing concentrations of a substance: from no observable effect to the lethal dose and everything in between.
What Is a Dose Response Curve?
A dose response curve is a graph that shows the relationship between the dose of a substance (chemical, drug, pollutant) and the magnitude of effect it produces in an organism or population. The x-axis represents dose (often on a logarithmic scale), and the y-axis represents the percentage of a population showing a specific response.
Key Terminology
Critical Dose Values
Anatomy of the S-Curve
The Threshold Model
For most toxic substances, there exists a threshold dose: below this level, the body can detoxify or repair any damage, so no adverse effects are observed. Above the threshold, effects increase with dose.
Threshold vs. Non-Threshold
The Therapeutic Index
When a substance is used as a drug, we care about the gap between the effective dose and the toxic dose. The therapeutic index (TI) quantifies this margin of safety:
How to Read a Dose Response Curve
Distinguish intrinsic hazard from exposure-dependent risk.
Use this illustration to explore the concept described in its caption.

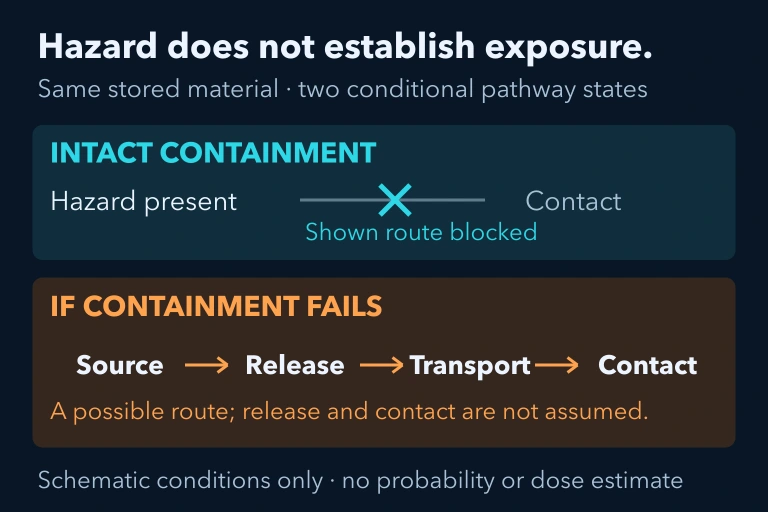
Example: Comparing Substance A vs. Substance B
Example: Finding \(\text{LD}_{50}\) from Data
A lab exposes 10 groups of 20 rats each to increasing doses of Pesticide X. Here are the mortality results:
| Dose (\(\text{mg/kg}\)) | Deaths / 20 | % Mortality |
|---|---|---|
| 1 | 0 | 0% |
| 5 | 2 | 10% |
| 10 | 5 | 25% |
| 20 | 8 | 40% |
| 30 | 10 | 50% |
| 50 | 16 | 80% |
Example: Calculating the Therapeutic Index
A new anti-inflammatory drug has the following dose response data:
Factors Affecting Dose Response
Bioaccumulation and Biomagnification
Dose response is not just about a single exposure event. Many pollutants accumulate in organisms over time, shifting the effective dose upward even at low environmental concentrations.
Common Mistakes
Summary Comparison
| Concept | Definition | Key Detail |
|---|---|---|
| \(\text{LD}_{50}\) | Lethal dose killing 50% | Lower = more toxic |
| \(\text{ED}_{50}\) | Effective dose for 50% | Desired therapeutic effect |
| \(\text{TD}_{50}\) | Toxic dose harming 50% | Non-lethal adverse effect |
| Therapeutic Index | \(\text{TD}_{50} / \text{ED}_{50}\) | Higher = safer drug |
| Threshold | Minimum dose for effect | Exists for most non-carcinogens |
| LNT Model | No safe dose exists | Used for carcinogens, radiation |
Question 1 of 5
Substance X has an \(\text{LD}_{50}\) of \(5~\text{mg/kg}\) and Substance Y has an \(\text{LD}_{50}\) of \(500~\text{mg/kg}\). Which statement is correct?
Question 2 of 5
A drug has an \(\text{ED}_{50}\) of \(10~\text{mg/kg}\) and a \(\text{TD}_{50}\) of \(50~\text{mg/kg}\). What is its therapeutic index?
Question 3 of 5
The linear no-threshold (LNT) model is most appropriately applied to which type of substance?
Question 4 of 5
On a dose response graph, Substance A's curve is shifted to the left of Substance B's curve. What does this indicate?
Question 5 of 5
DDT concentration was measured at \(0.04~\text{ppm}\) in lake water but \(25~\text{ppm}\) in osprey (a fish-eating bird). This increase through the food chain is an example of: