Carrying
Capacity
Explore how ecosystems set population limits, the math behind logistic growth, and why understanding \( K \) is critical for conservation and sustainability.
What Is Carrying Capacity?
Carrying capacity, symbolized as \( K \), is the maximum population size of a species that an environment can sustain indefinitely, given the available food, water, habitat, and other resources.
Limiting Factors That Determine \( K \)
Exponential vs Logistic Growth
The Logistic Growth Equation
$$ \frac{dN}{dt} = r_{\max} \cdot N \cdot \left(\frac{K - N}{K}\right) $$
Understanding the Braking Term
r-Selected vs K-Selected Species
| r-Selected | K-Selected | |
|---|---|---|
| Offspring count | Many | Few |
| Parental care | Little to none | Extensive |
| Body size | Small | Large |
| Lifespan | Short | Long |
| Growth pattern | Boom-and-bust | Near \( K \), stable |
| Examples | Insects, bacteria | Elephants, whales |
What Happens When Populations Overshoot \( K \)?
When a population temporarily exceeds \( K \), resources are depleted faster than they regenerate. This triggers a die-off (population crash), after which the population may oscillate around \( K \) or stabilize, depending on how severely resources were degraded.
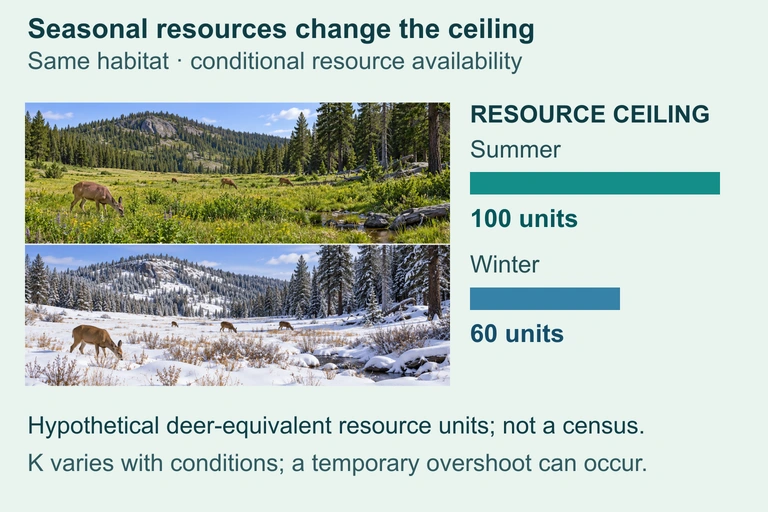
How \( K \) Can Shift Over Time
Explain why K changes with available resources.
Use this illustration to explore the concept described in its caption.
How to Solve Logistic Growth Problems
Worked Example: Deer Population
A forest can support \( K = 500 \) deer. The current population is \( N = 100 \) and the maximum per capita growth rate is \( r_{\max} = 0.5 \) per year. What is the population growth rate?
Worked Example: Near Capacity
Now suppose the same forest has \( N = 450 \) deer, with \( K = 500 \) and \( r_{\max} = 0.5 \). How does the growth rate compare?
Worked Example: Maximum Growth at \( \frac{K}{2} \)
With the same parameters (\( K = 500 \), \( r_{\max} = 0.5 \)), what is \( \frac{dN}{dt} \) when \( N = 250 \)?
Real-World Applications
Common Mistakes to Avoid
Question 1 of 5
A population of rabbits has \( K = 1{,}000 \), \( N = 500 \), and \( r_{\max} = 0.3 \). What is \( \frac{dN}{dt} \)?
Question 2 of 5
At what population size does the logistic growth rate reach its maximum?
Question 3 of 5
A severe drought reduces available water in a grassland. What is the most likely effect on the resident bison population?
Question 4 of 5
Which of the following is a density-dependent limiting factor?
Question 5 of 5
A fish population has \( K = 10{,}000 \), \( r_{\max} = 0.4 \), and \( N = 9{,}500 \). The population growth rate \( \frac{dN}{dt} \) is: