01 / 21

Bioaccumulation &
Biomagnification

Understand how toxic substances concentrate within organisms and amplify through trophic levels in food webs.

AP Environmental Science

What Is Bioaccumulation?

Bioaccumulation is the gradual buildup of a chemical substance in the tissues of a living organism over time. It occurs when the rate of intake exceeds the organism's ability to metabolize or excrete the substance.

Intake
Through food, water, or direct absorption from the environment
Persistence
Substance resists metabolic breakdown: it is lipophilic or chemically stable

What Is Biomagnification?

Biomagnification (also called biological magnification) is the increasing concentration of a substance as it moves up through successive trophic levels in a food chain. Each predator inherits the accumulated toxins of all its prey.

Why Does This Matter?

Ecological Harm
DDT caused eggshell thinning in birds of prey, nearly driving bald eagles to extinction
Human Health
Mercury in seafood causes neurological damage: Minamata disease in Japan (1950s)
Policy Impact
Rachel Carson's Silent Spring (1962) led to the U.S. ban on DDT in 1972

Toxin Concentration Across Trophic Levels

Producers (Phytoplankton) Primary Consumers (Zooplankton) Secondary Consumers (Small Fish) Top Predators
\( 0.01~\text{ppm} \)
\( 0.1~\text{ppm} \)
\( 1~\text{ppm} \)
\( 10~\text{ppm} \)
Toxin Conc.
\( \sim 10\times \) increase

The Bioconcentration Factor

Scientists quantify bioaccumulation using the Bioconcentration Factor (BCF):

\( \text{BCF} < 1 \)
Organism eliminates the substance effectively: no significant accumulation
\( \text{BCF} > 1,000 \)
Substance is highly bioaccumulative: regulatory concern (EPA threshold)
\( \text{BCF} > 5,000 \)
Very high bioaccumulation potential: likely persistent organic pollutant

Bioaccumulation vs. Biomagnification

Bioaccumulation Biomagnification
Scale Within a single organism Across multiple trophic levels
Mechanism \( \text{Absorption} > \text{excretion over time} \) Predator consumes many prey
Source Environment (water, soil, air) Diet (food chain transfer)
Result Tissue concentration rises in one organism Concentration increases at each level
Example Mercury in a single tuna DDT from algae to eagles

Separate within-organism accumulation from between-trophic concentration ratios.

Use this illustration to explore the concept described in its caption.
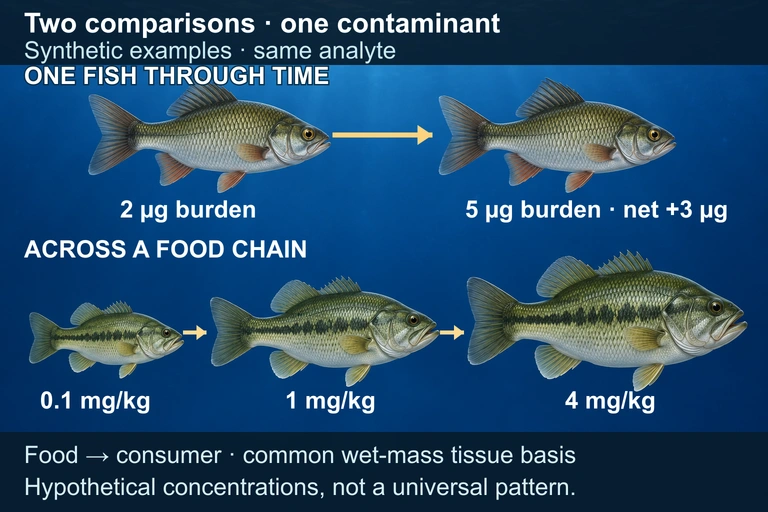
Two equal-size fish symbols compare one fish at two times,with tissue burden rising from2 to5 micrograms. A separate row shows three feeding-level fish symbols with synthetic tissue concentrations0.1,1 and4mg/kg on the same measurement basis.
Bioaccumulation tracks uptake and loss within an organism over time. Biomagnification compares tissue concentrations across feeding relationships on a common measurement basis.

Conditions for Biomagnification

Not all pollutants biomagnify. Three conditions must be met for a substance to increase in concentration up a food chain:

1
Persistent: The substance resists chemical and biological degradation. It has a long environmental half-life (years to decades).
2
Lipophilic (fat-soluble): The substance dissolves in fats and oils, not in water. It accumulates in fatty tissues rather than being excreted in urine.
3
Biologically active at low doses: Even trace amounts can cause harm, which is why concentration through trophic levels becomes dangerous.

How to Analyze a Biomagnification Problem

1
Identify the pollutant: Is it persistent and lipophilic? (DDT, mercury, PCBs = yes. Nitrogen, phosphorus = no.)
2
Map the food chain: List organisms from producer to top predator. Identify each trophic level.
3
Track concentration: Note the toxin level at each trophic level. Expect roughly a \( 10\times \) increase per level.
4
Predict the impact: The top predator will have the highest concentration. Assess ecological and health risks at that level.
5
Evaluate solutions: Consider banning the pollutant at the source, bioremediation, or dietary advisories for humans.

Example 1: DDT in an Aquatic Food Chain

Water 0.000003 ppm Plankton 0.04 ppm Small Fish 0.5 ppm Large Fish 2.0 ppm Osprey 25.0 ppm Total magnification:
\( \sim 10,000,000 \times \)
from water to top predator

Example 2: Mercury in the Ocean

Methylmercury enters aquatic systems primarily through coal-fired power plants and industrial discharge. It bioaccumulates in fish and biomagnifies through marine food chains.

Seawater 0.001 ppm Phytoplankton 0.01 ppm Shrimp 0.1 ppm Tuna 1.0 ppm Swordfish 3.0 ppm

Example 3: Calculating the BMF

The Biomagnification Factor (BMF) measures how much a toxin's concentration increases between two adjacent trophic levels:

\( \text{BMF} = 1 \)
No magnification occurring between levels
\( \text{BMF} > 1 \)
Biomagnification is occurring: toxin is concentrating upward
\( \text{BMF} < 1 \)
Trophic dilution: substance is being metabolized or excreted

Case Study: PCBs in the Great Lakes

Polychlorinated biphenyls (PCBs) were used in electrical equipment and industrial coolants until banned in the 1970s. Despite the ban, PCBs persist in Great Lakes sediments and continue to biomagnify through the food web.

1
Sediment: PCBs bind to lake-bottom particles at 0.005 ppm
2
Zooplankton: Filter feeders ingest particles, concentrating to 0.5 ppm
3
Smelt (small fish): Each smelt eats thousands of zooplankton, reaching 2.0 ppm
4
Lake Trout: Apex predator accumulates 25 ppm: a 5,000-fold increase from sediment

Factors Affecting Accumulation Rate

Lipid Content
Organisms with higher body fat store more lipophilic toxins in their adipose tissue
Metabolic Rate
Slower metabolism means slower excretion, allowing greater accumulation over time
Trophic Position
Higher in the food chain = more prey consumed = greater total toxin intake
Lifespan
Longer-lived organisms have more time to accumulate persistent chemicals

Common Mistakes to Avoid

✕ Confusing the Two Terms
Bioaccumulation is within one organism. Biomagnification is across trophic levels. They are related but distinct processes.
✕ All Pollutants Biomagnify
Only persistent, lipophilic substances biomagnify. Water-soluble pollutants like nitrates cause eutrophication, not biomagnification.
✕ Highest at the Bottom
Students sometimes think producers have the most toxin because they are most numerous. In biomagnification, concentration is highest at the top.

Summary of Key Pollutants

Pollutant Source Primary Impact Status
DDT Pesticide Eggshell thinning in birds Banned (1972)
Mercury (MeHg) Coal, mining Neurological damage Regulated
PCBs Industrial coolants Cancer, immune disruption Banned (1979)
Dioxins Incineration, herbicides Cancer, endocrine disruption Persistent
PFAS Nonstick coatings, foam Immune, thyroid damage Emerging concern

Question 1 of 5

Which process describes the increasing concentration of a toxin across successive trophic levels in a food chain?

Question 2 of 5

A pesticide is found at \( 0.02~\text{ppm} \) in zooplankton and \( 5.0~\text{ppm} \) in the lake trout that feeds on them (through intermediate species). What is the overall biomagnification factor from zooplankton to lake trout?

Question 3 of 5

Which characteristic of a pollutant is most essential for biomagnification to occur?

Question 4 of 5

In a food chain contaminated with DDT, which organism would have the highest concentration of DDT in its tissues?

Question 5 of 5

Nitrogen from agricultural runoff enters a lake and causes an algal bloom. A student claims this is an example of biomagnification. Is the student correct?