Atmospheric \(\text{CO}_2\)
and Particulates
Explore how carbon dioxide and particulate matter shape Earth's climate, air quality, and environmental policy.
What Is Atmospheric \(\text{CO}_2\)?
Carbon dioxide (\(\text{CO}_2\)) is a naturally occurring greenhouse gas that traps infrared radiation in the atmosphere. While essential for the natural greenhouse effect, its concentration has risen sharply since the Industrial Revolution: from roughly 280 ppm (pre-industrial) to over 420 ppm today.
What Are Particulates?
Particulate matter (PM) consists of tiny solid or liquid droplets suspended in the air. They originate from both natural sources (dust, volcanic ash, sea spray) and anthropogenic sources (combustion engines, power plants, agriculture).
Particle size classes and deposition in the respiratory system
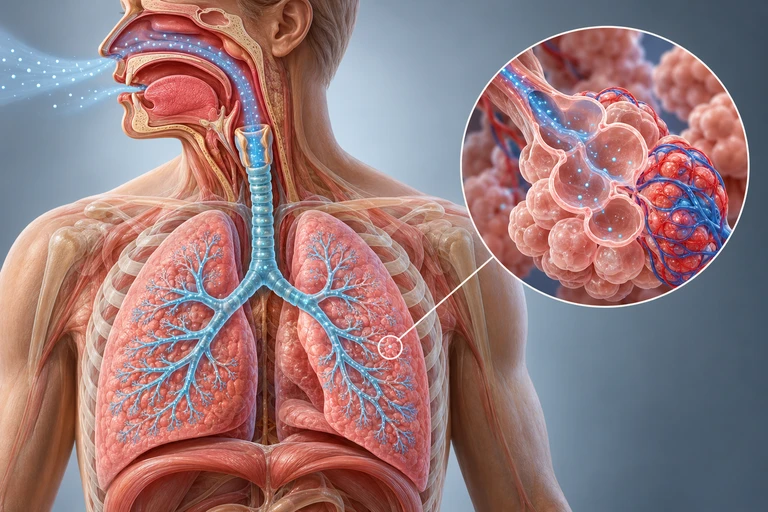 PM₂.₅ is a subset of PM₁₀; the coarse fraction is approximately PM₁₀ minus PM₂.₅. Aerodynamic size, particle properties and breathing conditions influence where particles deposit in the respiratory system.
Nested particulate size classes
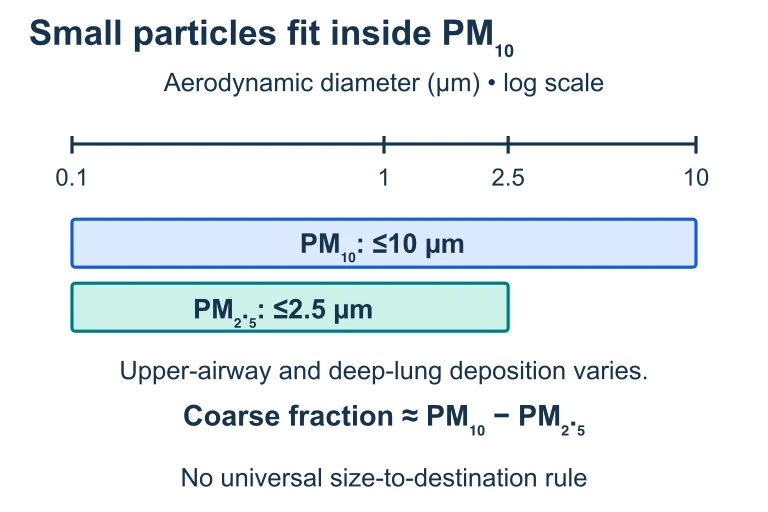 PM₂.₅ is a subset of PM₁₀; the coarse fraction is approximately PM₁₀ minus PM₂.₅. Aerodynamic size, particle properties and breathing conditions influence where particles deposit in the respiratory system.
Why This Matters
The Greenhouse Effect Mechanism
Radiative Forcing of \(\text{CO}_2\)
The additional energy trapped by an increase in \(\text{CO}_2\) is quantified by the radiative forcing equation:
Because forcing scales with the natural logarithm, each doubling of \(\text{CO}_2\) adds approximately \(5.35 \ln(2) \approx 3.7 \;\text{W/m}^2\) of forcing.
The Keeling Curve: Rising \(\text{CO}_2\)
Major Sources of \(\text{CO}_2\) and PM
\(\text{CO}_2\) vs Particulates: Key Differences
| Property | \(\text{CO}_2\) | Particulates (PM) |
|---|---|---|
| Phase | Gas | Solid / liquid droplets |
| Atmospheric Lifetime | 300 to 1,000+ years | Days to weeks |
| Climate Effect | Warming (traps IR) | Cooling or warming (scatters/absorbs light) |
| Scale of Impact | Global, long-term | Regional, short-term |
| Health Effect | Indirect (via climate) | Direct (respiratory, cardiovascular) |
| Measurement | ppm | \(\mu\text{g/m}^3\) |
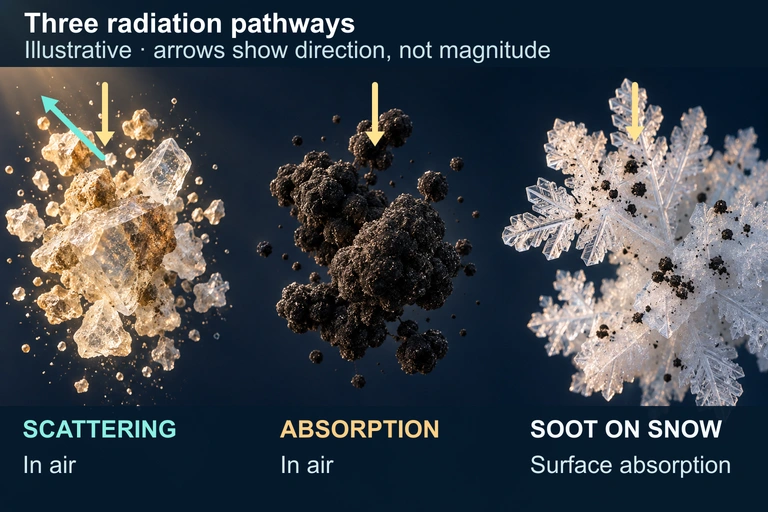
Particulates and Climate Forcing
Distinguish scattering, atmospheric absorption and surface darkening.
Use this illustration to explore the concept described in its caption.
The Carbon Cycle Connection
How to Analyze \(\text{CO}_2\) and PM Data
Example 1: Radiative Forcing Calculation
Problem: Calculate the radiative forcing caused by the increase in \(\text{CO}_2\) from the pre-industrial level of 280 ppm to today's level of 420 ppm.
Example 2: Air Quality Index and \(\text{PM}_{2.5}\)
Problem: A city measures \(\text{PM}_{2.5}\) at 55.4 \(\mu\text{g/m}^3\) (24-hour average). What AQI category does this fall into?
| AQI Category | \(\text{PM}_{2.5}\) Range (\(\mu\text{g/m}^3\)) | AQI Range |
|---|---|---|
| Good | 0.0 – 12.0 | 0 – 50 |
| Moderate | 12.1 – 35.4 | 51 – 100 |
| Unhealthy for Sensitive Groups | 35.5 – 55.4 | 101 – 150 |
| Unhealthy | 55.5 – 150.4 | 151 – 200 |
Example 3: Doubling \(\text{CO}_2\)
Problem: If \(\text{CO}_2\) doubles from 280 ppm to 560 ppm, what is the radiative forcing? By how much might temperature increase?
Common Mistakes to Avoid
Summary Comparison
| Feature | \(\text{CO}_2\) | Particulates |
|---|---|---|
| Type | Greenhouse gas | Aerosols (solid/liquid) |
| Lifetime | Centuries | Days to weeks |
| Primary Forcing | \( +3.7 \;\text{W/m}^2 \) per doubling | \( -0.5 \text{ to } -1.5 \;\text{W/m}^2 \) (net cooling) |
| Main Health Risk | Indirect (climate) | Direct (lungs, heart) |
| Key Legislation | Paris Agreement, EPA CPP | Clean Air Act, NAAQS |
| Measurement | ppm (Keeling Curve) | \(\mu\text{g/m}^3\) (AQI monitors) |
Question 1 of 5
What is the approximate radiative forcing from a doubling of atmospheric \(\text{CO}_2\) (from 280 ppm to 560 ppm)?
Question 2 of 5
Which statement best describes the difference between \(\text{CO}_2\) and particulate matter in terms of atmospheric lifetime?
Question 3 of 5
A city records a 24-hour \(\text{PM}_{2.5}\) reading of 42 \(\mu\text{g/m}^3\). According to the EPA AQI scale, this falls in which category?
Question 4 of 5
Sulfate aerosols released by volcanic eruptions primarily affect climate by:
Question 5 of 5
The Keeling Curve shows a clear seasonal oscillation superimposed on the long-term \(\text{CO}_2\) rise. This oscillation is primarily caused by: