01 / 20

Aquatic
Biomes

Explore the world's freshwater and marine ecosystems, the factors that shape them, and why they matter for global biodiversity and environmental science.

AP Environmental Science

What Are Aquatic Biomes?

Unlike terrestrial biomes defined by climate and vegetation, aquatic biomes are classified primarily by the physical and chemical properties of water: salinity, depth, flow rate, temperature, and light penetration.

Key Abiotic Factors

Salinity
Freshwater: < 0.05% salt. Marine: ~3.5% salt. Estuaries: variable mixing zone.
Light
Photic zone supports photosynthesis. Aphotic zone: no light, chemosynthesis dominates.
Temperature
Surface warming creates thermocline: a sharp temperature gradient limiting mixing.
Dissolved O\(_2\)
Cold, turbulent water holds more oxygen. Warm, stagnant water leads to hypoxia.

Why Aquatic Biomes Matter

1
Climate regulation: Oceans absorb ~30% of anthropogenic \(\text{CO}_2\) and redistribute heat via thermohaline circulation.
2
Biodiversity hotspots: Coral reefs, estuaries, and wetlands support disproportionate species richness per unit area.
3
Ecosystem services: Fisheries, water purification, flood control, and nutrient cycling depend on healthy aquatic systems.
4
Human dependence: Over 3 billion people rely on aquatic protein as a primary food source.

Freshwater Lake Zones

Littoral Shallow, rooted plants Limnetic Open water, photic Profundal Deep, aphotic zone Benthic Bottom sediments Sunlight Thermocline Surface

Freshwater Ecosystem Types

Lentic
Standing water: lakes, ponds, wetlands. Stratified by temperature and light. Productivity depends on nutrient input.
Lotic
Flowing water: streams, rivers. High dissolved oxygen. Community structure changes from headwaters to mouth.
Wetlands
Saturated soils: marshes, swamps, bogs. Exceptional water filtration, carbon storage, and nursery habitat.

A lake’s invisible seasonal layers become visible
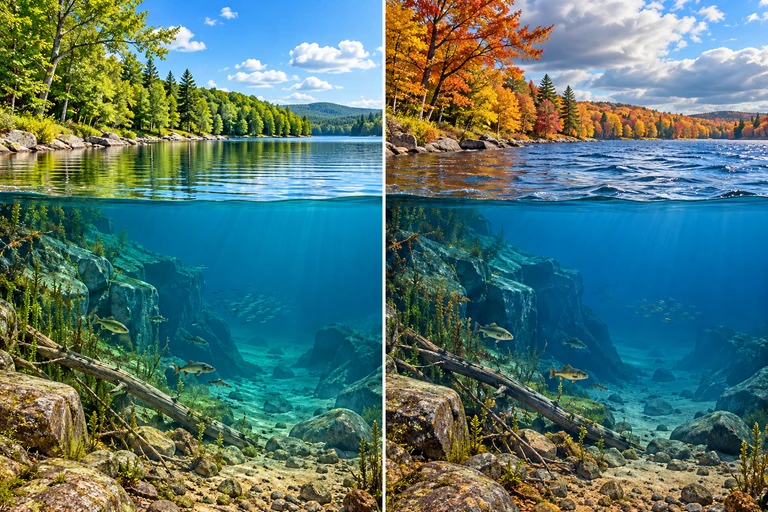
Matched summer and autumn lake cutaways accompany temperature-versus-depth profiles on the same axes.The summer profile has warm surface water above colder deep water. In autumn, a weaker density difference allows mixing when sufficient wind energy is available.

A thermal gradient can resist mixing
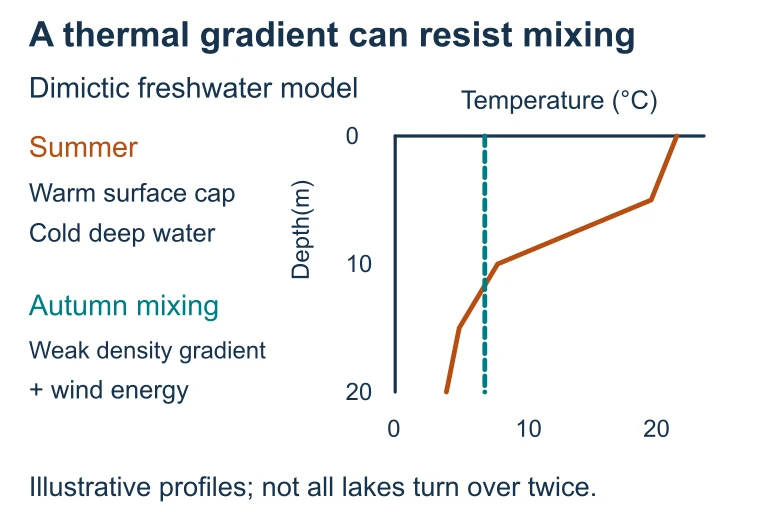
A thermal gradient can resist mixing. The summer profile has warm surface water above colder deep water. In autumn, a weaker density difference allows mixing when sufficient wind energy is available.The summer profile has warm surface water above colder deep water. In autumn, a weaker density difference allows mixing when sufficient wind energy is available.

Marine Ocean Zones

Epipelagic Mesopelagic Bathypelagic Abyssopelagic Hadal 0-200 m 200-1,000 m 1,000-4,000 m 4,000-6,000 m >6,000 m Photic zone, most marine life Twilight zone, some bioluminescence No light, high pressure Near-freezing, sparse life Trenches, chemosynthetic organisms Photic / Aphotic boundary (200 m)

Aquatic habitat zones in two spatial dimensions
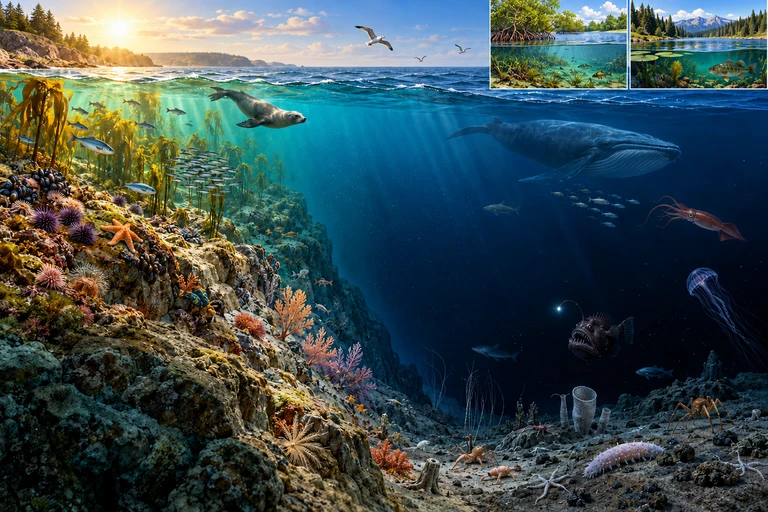
A coastal-to-deep ocean cutaway with kelp, fish and marine mammals, continuous seafloor, and separate mangrove and lake insets.Nearshore and offshore describe horizontal position; photic and aphotic describe light conditions. Benthic habitat is the seafloor at any depth.

Aquatic zones use different spatial dimensions
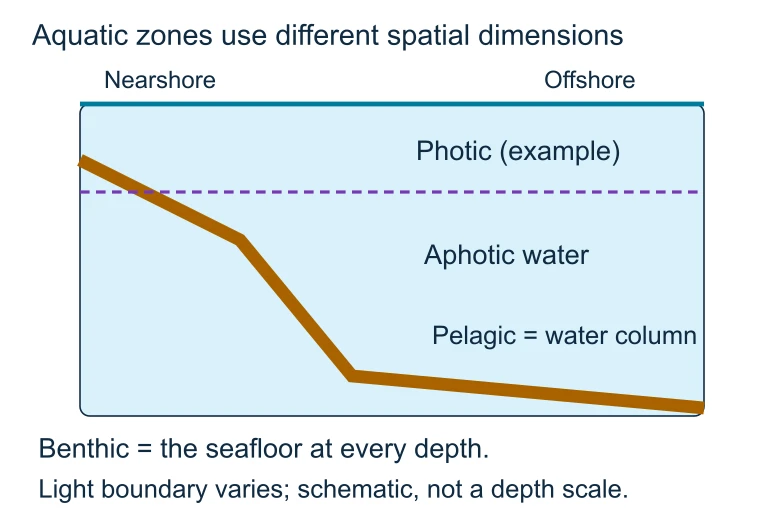
Aquatic zones use different spatial dimensions. Nearshore and offshore describe horizontal position; photic and aphotic describe light conditions. Benthic habitat is the seafloor at any depth.Nearshore and offshore describe horizontal position; photic and aphotic describe light conditions. Benthic habitat is the seafloor at any depth.

Two underwater worlds share one light threshold
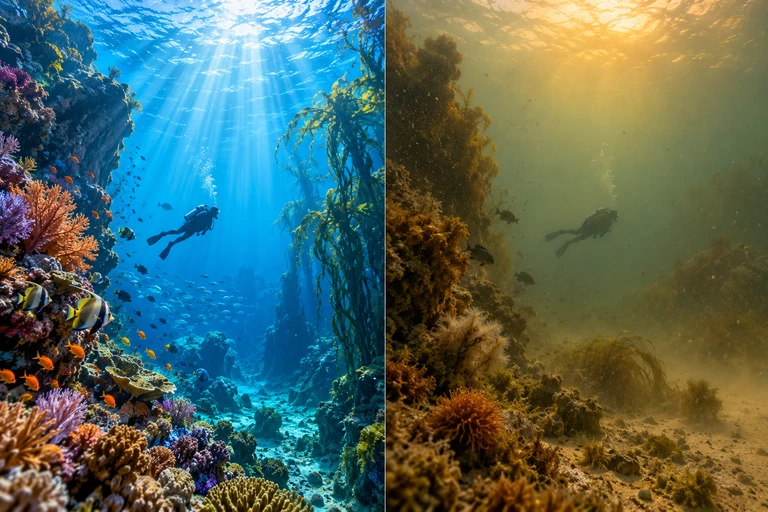
Two complete underwater scenes with a diver, one clear blue and one turbid, with differing penetration of visible sunlight.Using the stated light-attenuation model, the 1% surface-light reference occurs at 92.1 m when k = 0.05 m⁻¹ and 23.0 m when k = 0.20 m⁻¹. Light requirements vary among organisms.

Light attenuation: depth increases downward
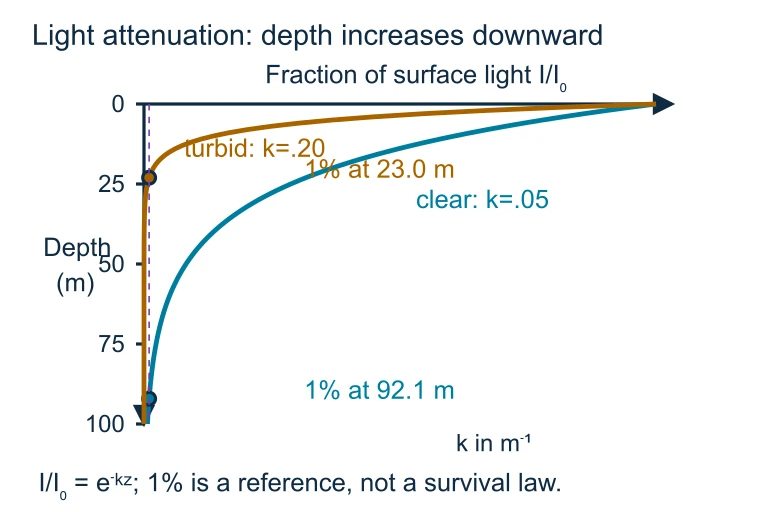
Light attenuation: depth increases downward. Using the stated light-attenuation model, the 1% surface-light reference occurs at 92.1 m when k = 0.05 m⁻¹ and 23.0 m when k = 0.20 m⁻¹. Light requirements vary among organisms.Using the stated light-attenuation model, the 1% surface-light reference occurs at 92.1 m when k = 0.05 m⁻¹ and 23.0 m when k = 0.20 m⁻¹. Light requirements vary among organisms.

Freshwater vs. Marine

Freshwater Marine
Salinity < 0.05% ~3.5%
Coverage ~2.5% of Earth's water ~97% of Earth's water
Depth range Shallow to ~1,600 m Surface to ~11,000 m
Primary producers Algae, aquatic plants Phytoplankton, kelp
Key threat Eutrophication, dams Ocean acidification, overfishing

Marine Ecosystems In Depth

Coral Reefs
Built by cnidarians in warm, shallow water. Support 25% of all marine species. Threatened by bleaching when temperatures rise > 1-2 °C above normal.
Estuaries
Where rivers meet the ocean. Brackish water supports nursery habitat for 75% of commercial fish species. High productivity from nutrient mixing.
Open Ocean
Pelagic zone covers 65% of Earth's surface. Low nutrient "biological desert" except at upwelling zones where deep nutrients fuel productivity.

Net Primary Productivity

Net Primary Productivity (NPP) measures the rate at which producers convert sunlight into biomass, minus respiration:

How Eutrophication Works

Excess N & P Runoff enters water Algal Bloom Rapid algae growth Light Blocked Submerged plants die Decomposition Bacteria consume O₂ Hypoxia Dead zone forms Fish & organisms die Dead Zones: >500 globally, including the Gulf of Mexico Primary cause: agricultural runoff (fertilizers, animal waste)

How to Classify an Aquatic Biome

1
Check salinity: Is it freshwater (< 0.05%), brackish (0.05-3%), or marine (~3.5%)?
2
Determine flow: Is the water standing (lentic) or flowing (lotic)?
3
Assess depth and light: Is the zone photic (light penetrates) or aphotic? Where is the thermocline?
4
Identify organisms: What primary producers dominate? Rooted plants suggest littoral; phytoplankton suggest open water or pelagic.
5
Evaluate threats: Eutrophication? Acidification? Thermal pollution? Match the threat to the biome type.

Example: Identifying a Lake Zone

A researcher samples an area of a lake with the following characteristics: rooted aquatic plants, high biodiversity, water depth of 2 meters, and abundant sunlight reaching the bottom.

Example: Calculating NPP

An estuary has a gross primary productivity of \(1,\!800 \; \text{g C/m}^2\text{/yr}\) and producer respiration of \(600 \; \text{g C/m}^2\text{/yr}\). What is its NPP?

Example: Tracing Eutrophication

A lake near farmland shows green water, fish kills, and low dissolved oxygen. A scientist measures phosphorus at \(0.08 \; \text{mg/L}\), well above the eutrophic threshold of \(0.02 \; \text{mg/L}\). Explain the causal chain.

1
Source: Phosphorus enters from agricultural runoff (fertilizer).
2
Response: Excess P triggers algal bloom, turning water green.
3
Cascade: Algae die, decomposers consume \(\text{O}_2\), creating hypoxic conditions.
4
Result: Fish and other aerobic organisms suffocate: a dead zone forms.

Common Mistakes

✕ Confusing Zones
Mixing up limnetic (open water, photic) with profundal (deep, aphotic). Remember: limnetic gets light, profundal does not.
✕ Salinity Errors
Calling estuaries "freshwater." Estuaries have brackish water: a mix of freshwater and saltwater with variable salinity.
✕ NPP vs. GPP
Forgetting to subtract respiration. NPP = GPP - R. GPP is total photosynthesis; NPP is what's available to consumers.

Question 1 of 5

Which zone of a freshwater lake is characterized by rooted aquatic plants, shallow water, and the highest biodiversity?

Question 2 of 5

If a marine ecosystem has a GPP of \(2,\!400 \; \text{g C/m}^2\text{/yr}\) and producer respiration of \(900 \; \text{g C/m}^2\text{/yr}\), what is the NPP?

Question 3 of 5

Which of the following is the primary cause of eutrophication in freshwater lakes?

Question 4 of 5

Coral reefs are primarily threatened by ocean warming because elevated temperatures cause:

Question 5 of 5

An estuary is best described as an ecosystem where: