Age Structure
Diagrams
Learn to read and interpret population pyramids to predict growth trends, analyze demographic transitions, and understand environmental impacts.
What Is an Age Structure Diagram?
An age structure diagram (also called a population pyramid) is a horizontal bar chart that shows the distribution of a population by age group and sex. Males are typically on the left, females on the right.
Why Do They Matter?
Anatomy of a Population Pyramid
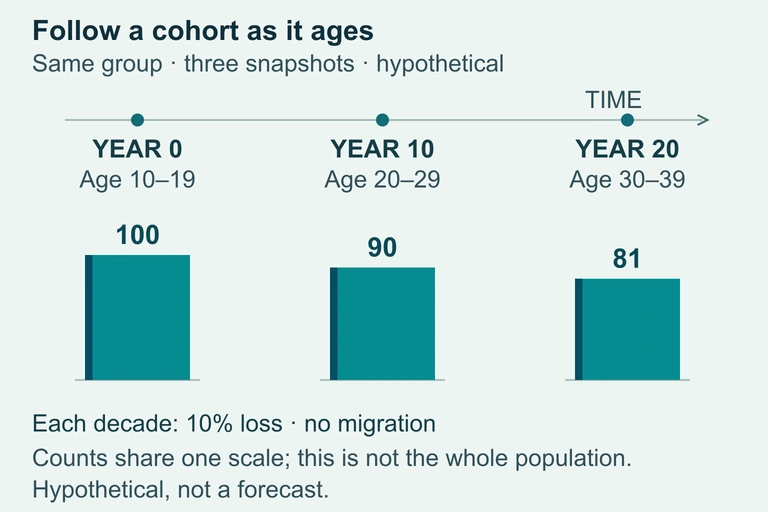
Track a hypothetical cohort through successive age bins while distinguishing cohort size from the whole age distribution.
Use this illustration to explore the concept described in its caption.
The Three Classic Shapes
Rapid Growth: The Expansive Pyramid
Stable vs. Declining
Growth Rate vs. Age Structure
| Growth Rate (\( r \)) | Age Structure Diagram | |
|---|---|---|
| What it tells you | Current speed of change | Future trajectory of growth |
| Format | Single number (\( r = b - d \)) | Visual bar chart by age/sex |
| Momentum? | Cannot reveal it | Reveals population momentum |
| Policy use | Quick snapshot | Long-term planning |
Connection to the DTM
Each stage of the Demographic Transition Model produces a characteristic pyramid shape:
How to Read a Pyramid
Example 1: Country X
Example 2: Country Y
Example 3: Spotting Anomalies
Population Momentum
Even when a country reduces its total fertility rate (TFR) to replacement level (\( \text{TFR} \approx 2.1 \)), the population can continue to grow for decades because of the large number of people in reproductive age cohorts.
Common Mistakes
Summary Table
| Expansive | Stationary | Constrictive | |
|---|---|---|---|
| Shape | Wide base, narrow top | Roughly equal bars | Narrow base, wider middle |
| Growth Trend | Rapid increase | Stable / zero growth | Decline |
| TFR | \( > 2.1 \) | \( \approx 2.1 \) | \( < 2.1 \) |
| DTM Stage | Stage 2 | Stage 3-4 | Stage 4-5 |
| Example | Nigeria, Ethiopia | USA, Australia | Japan, Germany |
| Key Concern | Resource strain | Sustainability | Aging workforce |
Question 1 of 5
A population pyramid with a wide base that tapers sharply toward the top most likely indicates which of the following?
Question 2 of 5
Which of the following best describes population momentum?
Question 3 of 5
A country's age structure diagram shows the widest bars in the 40-64 age range, with progressively narrower bars below. This country is most likely in which stage of the Demographic Transition Model?
Question 4 of 5
An indentation (notch) in a single age cohort of an otherwise smooth pyramid most likely indicates which of the following?
Question 5 of 5
Country A has a total fertility rate of \( 1.4 \) and an age structure diagram with a narrow base. Which environmental consequence is least likely to occur in Country A over the next 30 years?