

SECTION 1
Historical Context & Motivation
Humans have captured the kinetic energy of wind for millennia, but the modern push to generate electricity from moving air is driven by concerns over fossil fuel combustion, climate change, and finite reserves of nonrenewable resources. Early windmills ground grain and pumped water across Persia and the Netherlands, demonstrating that atmospheric motion could perform useful mechanical work. By the late nineteenth century, inventors realized that the same rotational force could spin electrical generators, opening the door to what we now call wind power. The twentieth century saw wind energy oscillate between obscurity—when cheap oil dominated—and resurgence during energy crises. Today, wind energy ranks as one of the fastest-growing electricity sources worldwide, raising an essential question for environmental scientists: how can societies scale this resource while managing its ecological and social trade-offs?
~500 BCE • Ancient Persian Windmills
1888 • Brush Wind Turbine
1941 • Smith–Putnam Turbine
1978 • U.S. Energy Tax Act
2023 • Global Capacity Exceeds 1,000 GW
From ancient grain mills to offshore megaturbines, wind energy has evolved into a cornerstone of the global energy transition. The central question this lesson addresses is: what physical, environmental, and economic factors determine how much electricity a wind turbine can generate, and what are the ecological trade-offs associated with scaling this technology?
SECTION 2
Core Principles & Definitions
Wind energy is ultimately a form of solar energy. Differential heating of Earth's surface by the sun creates pressure gradients in the atmosphere; air moves from high-pressure to low-pressure zones, producing wind. Wind turbines convert the kinetic energy of this moving air into rotational mechanical energy, which a generator then transforms into electrical energy. Understanding wind power requires familiarity with several foundational concepts that connect atmospheric science, physics, and engineering.
Wind as Indirect Solar Energy
Kinetic Energy of Air
Swept Area & Rotor Size
Betz Limit
Capacity Factor
KEY TAKEAWAY
SECTION 3
Anatomy of a Wind Turbine
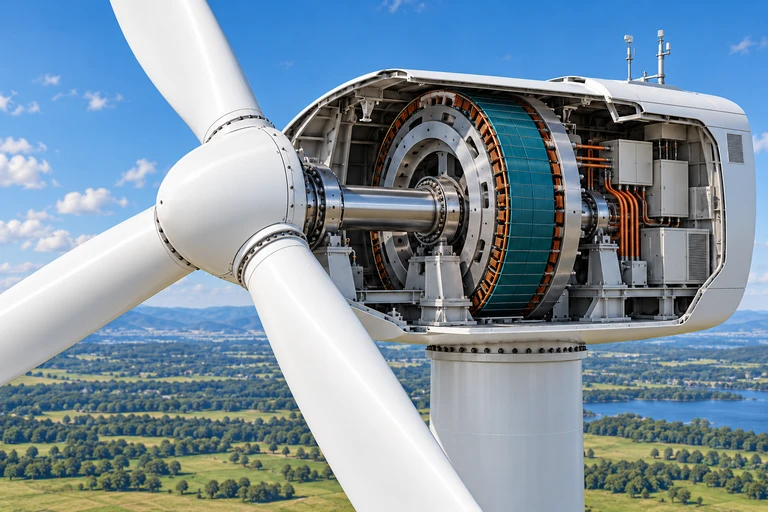
The diagram above illustrates the dominant design in commercial wind power: the three-bladed horizontal-axis wind turbine (HAWT). Wind flows across aerodynamically shaped blades, creating lift and drag forces that cause the rotor to spin. The rotor connects through a low-speed shaft to a gearbox inside the nacelle, which steps up the rotational speed before transferring it to a generator that produces alternating current via electromagnetic induction. A yaw mechanism orients the entire nacelle into the prevailing wind, while a pitch system adjusts blade angles to optimize performance across varying wind speeds. The tower's height is critical because wind speed increases with altitude due to reduced friction with the ground—a phenomenon described by the wind shear profile. Modern utility-scale turbines have hub heights of 80–160 meters and rotor diameters exceeding 150 meters, enabling them to access stronger, more consistent winds aloft.
 A 50 m rotor radius sweeps 7,854 m². At air density 1.225 kg/m³ and wind speed 8 m/s, available kinetic power is 2.463 MW; an assumed 40% overall efficiency gives 0.985 MW of electricity at that operating point.
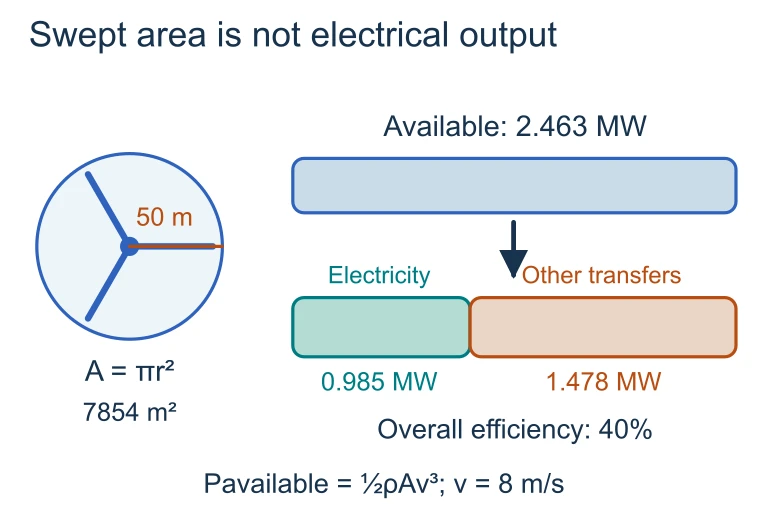 A 50 m rotor radius sweeps 7,854 m². At air density 1.225 kg/m³ and wind speed 8 m/s, available kinetic power is 2.463 MW; an assumed 40% overall efficiency gives 0.985 MW of electricity at that operating point.
SECTION 4
Mathematical Framework
The physics of wind power can be captured in a small set of equations that connect atmospheric conditions to electrical output. These relationships are essential for the AP Environmental Science exam, where you may be asked to calculate power output, compare sites, or evaluate capacity factors.
WIND POWER EQUATION
where P = power available in the wind (watts), ρ = air density (≈ 1.225 kg/m³ at sea level and 15 °C), A = swept area of the rotor (m²), and v = wind speed (m/s). Note the cubic dependence on velocity: doubling wind speed increases available power by a factor of 2³ = 8.
SWEPT AREA
where r = rotor blade length (radius of the rotor disk) in meters. A turbine with 60 m blades has a swept area of π × 60² ≈ 11,310 m².
BETZ LIMIT
The Betz limit states that no turbine can capture more than 59.3% of the wind's kinetic energy. Real turbines achieve 35–45% efficiency after accounting for aerodynamic, mechanical, and electrical losses.
CAPACITY FACTOR
The capacity factor compares a turbine's real output to its theoretical maximum if it ran at full rated power 100% of the time. Onshore wind farms typically have capacity factors of 25–40%; offshore farms may reach 40–55% due to steadier marine winds.
AP Exam Tip
SECTION 5
Turbine Types & Site Selection
Wind turbines fall into two broad categories based on the orientation of their rotational axis, each with distinct advantages. The choice between them—and the decision of where to install them—profoundly affects energy yield, cost, and environmental impact.
Key Siting Factors
| Factor | Why It Matters | Examples |
|---|---|---|
| Average Wind Speed | Power scales with v³, so even small speed differences have large effects. Class 4+ sites (≥ 7.0 m/s at 50 m) are preferred. | Great Plains, coastal ridges, offshore continental shelves |
| Wind Consistency | Steady, predictable winds yield higher capacity factors than gusty, intermittent conditions. | Trade wind belts, offshore sites with minimal terrain turbulence |
| Topography | Ridgetops and passes funnel and accelerate airflow; flat open terrain reduces turbulence. | Mountain passes in California, Danish flatlands |
| Grid Access | Remote high-wind sites require expensive transmission infrastructure, increasing levelized cost. | Texas CREZ transmission lines built to connect Panhandle wind to Dallas–Houston load centers |
| Ecological Sensitivity | Bird and bat migratory corridors, endangered species habitat, and marine ecosystems constrain placement. | Altamont Pass raptor mortality, offshore conflicts with whale migration |
Major factors influencing wind farm site selection
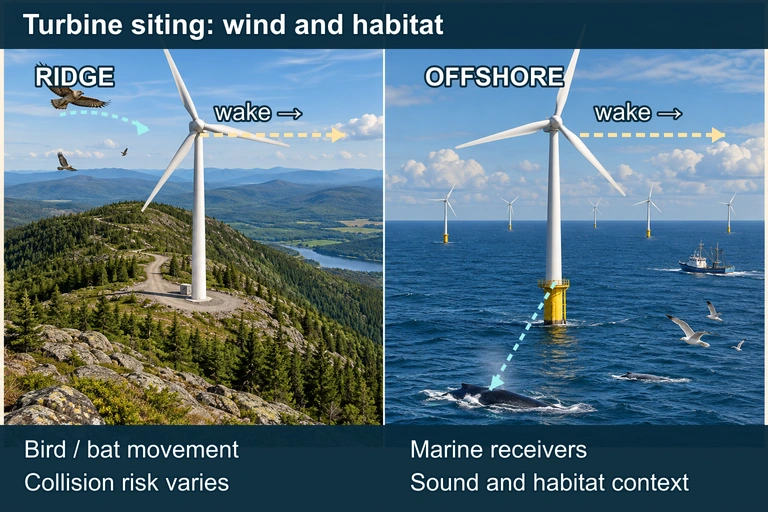 Wind access, wake conditions, habitats and nearby receivers all affect turbine siting. These schematic alternatives illustrate competing considerations without prescribing a particular site, risk ranking or setback. Effects are species and site dependent.
SECTION 6
Worked Example: Calculating Turbine Power Output
A wind farm developer evaluates a site with an average wind speed of 8 m/s at hub height. Each proposed turbine has a rotor blade length of 50 meters and operates at 40% overall efficiency. Assume standard air density of 1.225 kg/m³. Calculate the electrical power output of one turbine, then determine the annual energy production (in kWh) assuming a capacity factor of 35%.
Single-Turbine Power & Annual Energy Output
- 1
Step 1 — Calculate Swept Area
The rotor blade length is the radius of the swept circle. Using A = π × r²: A = π × (50 m)² = π × 2,500 m²A ≈ 7,854 m² - 2
Step 2 — Calculate Available Wind Power
Apply the wind power equation: P_wind = ½ × ρ × A × v³ = ½ × 1.225 kg/m³ × 7,854 m² × (8 m/s)³. First, compute v³ = 8³ = 512 m³/s³. Then, P_wind = 0.5 × 1.225 × 7,854 × 512.P_wind ≈ 2,463,091 W ≈ 2,463 kW - 3
Step 3 — Apply Turbine Efficiency
The turbine converts 40% of available wind power to electricity: P_electrical = 0.40 × 2,463 kWP_electrical ≈ 985 kW (the turbine's rated output under these conditions) - 4
Step 4 — Calculate Annual Energy Output
With a capacity factor of 35%, the turbine produces less than its rated output over the full year because wind is intermittent. There are 8,760 hours per year. Annual Energy = Rated Power × CF × Hours/Year = 985 kW × 0.35 × 8,760 hAnnual Energy ≈ 3,020,010 kWh ≈ 3.02 × 10⁶ kWh per year - 5
Step 5 — Interpret the Result
Approximately 3.02 million kWh per year is sufficient to supply roughly 280 average U.S. households (at ~10,800 kWh/household/year). Note that the capacity factor reduced the output significantly from what continuous full-power operation would yield (985 kW × 8,760 h ≈ 8.63 million kWh).One turbine powers ≈ 280 homes
SECTION 7
Advantages & Disadvantages of Wind Energy
Wind energy offers substantial environmental benefits but carries trade-offs that environmental scientists must evaluate. The AP exam frequently tests your ability to weigh these factors in cost-benefit analyses and policy proposals.
| Advantages | Disadvantages |
|---|---|
| No direct greenhouse gas emissions during operation; lifecycle CO₂ is 7–15 g/kWh, far below fossil fuels. | Intermittency: wind is variable and unpredictable; requires backup generation or energy storage. |
| Renewable and inexhaustible on human timescales; driven by solar radiation. | Bird and bat mortality: estimated 140,000–500,000 bird deaths per year in the U.S. from turbine collisions. |
| Small land footprint per MW; farmland between turbines remains usable for agriculture. | Visual and noise impacts: some communities oppose turbines for aesthetic reasons and low-frequency sound. |
| Low operating costs after installation; no fuel input required, unlike coal or natural gas. | High capital costs and need for transmission infrastructure to connect remote, high-wind sites to load centers. |
| No water consumption for cooling, unlike thermoelectric power plants. | Blade disposal challenges: fiberglass blades are difficult to recycle and often end up in landfills. |
Comparative advantages and disadvantages of wind energy
CONTEXTUALIZING WIND'S TRADE-OFFS
SECTION 8
Policy Frameworks & Future Directions
Wind energy's growth has been heavily shaped by government policy, and understanding the interplay between regulation, subsidies, and technological innovation is crucial for the AP Environmental Science exam. The table below contrasts current policy mechanisms with emerging approaches that may define the next era of wind development.
| Current Policy Tools | Emerging Trends & Technologies |
|---|---|
| Production Tax Credit (PTC): per-kWh federal subsidy in the U.S. that reduces the cost of wind electricity. | Floating offshore turbines: platforms anchored to the seabed by cables can access deep-water sites with stronger, steadier winds. |
| Renewable Portfolio Standards (RPS): state-level mandates requiring utilities to source a percentage of electricity from renewables. | Grid-scale battery storage: lithium-ion and emerging solid-state batteries smooth intermittent wind output, addressing the dispatchability problem. |
| Feed-in Tariffs (FITs): guaranteed above-market rates for wind producers, widely used in Europe (e.g., Germany's Energiewende). | Recyclable blade materials: thermoplastic resins and modular blade designs are being developed to solve the fiberglass landfill problem. |
| Carbon pricing: cap-and-trade or carbon taxes increase the cost of fossil fuels, making wind more competitive. | Hybrid wind-solar parks: co-locating wind and solar on the same site increases capacity factor since wind often peaks at night and in winter when solar output is low. |
Policy mechanisms vs. emerging technologies in wind energy
Looking ahead, the integration of wind power into broader energy systems requires thinking beyond individual turbines. The concept of a smart grid—a digitally managed electrical network that dynamically balances supply and demand—is central to accommodating variable renewables like wind. Students preparing for the AP exam should also recognize that wind energy intersects with broader environmental themes: land-use planning, biodiversity conservation, environmental justice (who benefits from wind projects and who bears the impacts), and the lifecycle analysis of materials from rare-earth magnets in generators to the concrete in foundations.
SECTION 9
Practice Problems
Question 1: CONCEPTUAL
- A. Wind turbines use photovoltaic cells to supplement their electrical output on calm days.
- B. Differential solar heating of Earth's surface creates pressure gradients that drive atmospheric circulation and wind.
- C. Wind turbines must be oriented toward the sun to maximize energy capture throughout the day.
- D. Both wind and solar energy have identical capacity factors, indicating they are functionally equivalent.
Show answer (B)
Question 2: BASIC CALCULATION
- A. 1.5
- B. 2.25
- C. 3.375
- D. 4.5
Show answer (C)
Question 3: INTERMEDIATE
- A. 2,628,000 kWh
- B. 5,256,000 kWh
- C. 17,520,000 kWh
- D. 52,560,000 kWh
Show answer (B)
Question 4: APPLIED
4 ptsShow answer
Question 5: CRITICAL THINKING
4 ptsShow answer
SUMMARY
Wind Energy — Key Concepts Review
Summary
Wind energy is an indirect form of solar energy generated by differential heating of Earth's surface. Wind turbines—predominantly horizontal-axis designs (HAWTs)—convert the kinetic energy of moving air into electricity through a three-stage process: aerodynamic lift on blades → mechanical rotation → electromagnetic induction in a generator. The fundamental equation P = ½ρAv³ reveals that power scales with the cube of wind speed and linearly with swept area, explaining why modern turbines are built taller and with longer blades. The Betz limit (≈ 59.3%) sets a theoretical ceiling on extraction efficiency, and real turbines achieve 35–45%.
Wind energy's key advantages include zero operational greenhouse gas emissions, renewability, low operating costs, and no water consumption. Its disadvantages include intermittency, bird and bat mortality, visual and noise impacts, high capital costs, and blade disposal challenges. The capacity factor (typically 25–50%) captures the reality that wind does not blow consistently. Policy tools such as production tax credits, renewable portfolio standards, and carbon pricing have driven wind energy's rapid expansion, while emerging innovations like floating offshore turbines and grid-scale battery storage promise to address its most significant limitations.