

SECTION 1
Historical Context & Motivation
For most of human history, waste management was largely invisible—organic refuse decomposed naturally, and the volume of durable goods remained low enough to pose few systemic environmental challenges. The Industrial Revolution fundamentally altered this equation by introducing mass production, synthetic materials, and consumer packaging at scales that natural decomposition cycles could not absorb. By the mid-twentieth century, industrialized nations confronted overflowing open dumps, contaminated waterways, and mounting evidence that municipal solid waste (MSW) posed serious threats to public health and ecosystem integrity. These crises catalyzed a transition from simple disposal toward the more sophisticated waste reduction frameworks that now form a cornerstone of environmental policy worldwide.
1965 • Solid Waste Disposal Act
1976 • Resource Conservation and Recovery Act (RCRA)
1987 • Mobro 4000 Garbage Barge Incident
2002 • Cradle to Cradle Published
2015 • UN Sustainable Development Goals
These milestones reveal a clear conceptual arc: early efforts focused on managing waste after it was produced, but over time, environmental scientists and policymakers recognized that the most effective strategy is to prevent waste generation in the first place. This principle—that reduction at the source yields greater environmental benefit than any end-of-pipe treatment—drives the waste management hierarchy that structures modern environmental policy and the AP Environmental Science curriculum.
SECTION 2
Core Principles & Definitions
Waste reduction methods operate within a structured priority system known as the waste management hierarchy, which ranks strategies from most to least environmentally desirable. This hierarchy is not merely a theoretical construct; it directly informs legislation such as the EU Waste Framework Directive and EPA guidelines. Understanding these core principles is essential for the APES exam, which frequently tests students' ability to distinguish between and evaluate different waste reduction approaches in terms of their environmental costs, benefits, and feasibility.
Source Reduction (Prevent)
Reuse
Recycling & Composting
Energy Recovery (Waste-to-Energy)
Disposal (Landfilling)
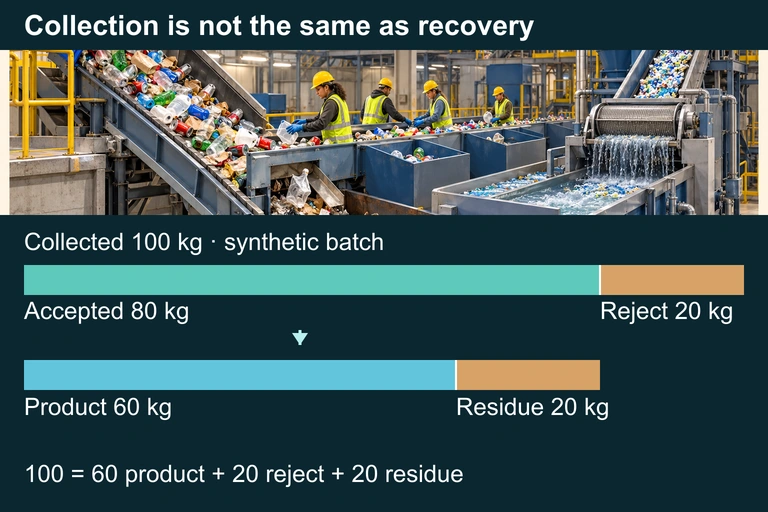 Of 100 kg collected in the synthetic batch, 20 kg is rejected during sorting and 20 kg becomes process residue, leaving 60 kg of secondary product. Collection therefore exceeds actual material recovery in this example.
KEY TAKEAWAY
SECTION 3
The Waste Management Hierarchy
The visual structure of the hierarchy carries quantitative meaning as well. The narrow apex for source reduction reflects the fact that a relatively small investment in prevention can eliminate far more environmental harm than the large-scale infrastructure required for the lower tiers. For instance, eliminating unnecessary product packaging (source reduction) avoids the raw material extraction, manufacturing emissions, transportation energy, and end-of-life management costs that even the best recycling programs cannot fully offset. This principle—that upstream interventions yield outsized downstream benefits—is a recurring theme across APES topics, from integrated pest management to energy conservation.
SECTION 4
How Waste Reduction Works: Mechanisms & Metrics
While the waste management hierarchy provides a qualitative ranking, environmental scientists rely on quantitative metrics to evaluate and compare the effectiveness of different waste reduction strategies. The AP exam may ask you to perform calculations involving diversion rates, per-capita waste generation, or the environmental benefits of specific interventions. Understanding these metrics allows you to move beyond memorization toward analytical reasoning about waste policy effectiveness.
WASTE DIVERSION RATE
Where Mass Diverted includes all waste sent to recycling, composting, or reuse programs (in tons), and Total MSW Generated is the total mass of solid waste produced (in tons). A higher diversion rate indicates more effective waste reduction.
PER-CAPITA WASTE GENERATION
This metric enables meaningful comparisons between countries or cities of different sizes. The U.S. generates approximately 2.0 kg per person per day, while Japan generates roughly 0.9 kg per person per day—a difference largely attributable to Japan's aggressive source reduction and recycling policies.
LANDFILL VOLUME REDUCTION
Simplifies to Vsaved = Voriginal × (Diversion Rate ÷ 100). This calculation is useful for projecting how much additional landfill capacity a community gains by improving its recycling program.
Beyond these direct calculations, environmental scientists use life-cycle assessment (LCA) to evaluate the full environmental footprint of a product from raw material extraction through manufacturing, use, and end-of-life management. LCA quantifies energy consumption, greenhouse gas emissions, water use, and other impacts across a product's entire life span, enabling policymakers to identify which stage of the life cycle offers the greatest opportunity for waste reduction. For example, LCA research has demonstrated that manufacturing aluminum from recycled cans uses approximately 95% less energy than producing it from virgin bauxite ore, making aluminum recycling one of the most energy-efficient material recovery processes available.
SECTION 5
Detailed Breakdown of Reduction Strategies
Each tier of the waste hierarchy encompasses specific, implementable strategies that range from individual behavioral changes to large-scale policy instruments. The AP exam expects you to identify concrete examples within each category and evaluate their relative effectiveness. The following diagram and classification illustrate the major strategies across the spectrum from prevention to disposal.
| Strategy | Mechanism | Example | Environmental Benefit |
|---|---|---|---|
| Reduce | Prevents waste at the point of production or consumption | Double-sided printing; concentrated detergents | Eliminates extraction, manufacturing, and disposal impacts |
| Reuse | Extends product lifespan without reprocessing | Refillable water bottles; tire retreading | Preserves embedded energy; avoids new resource extraction |
| Recycle | Reprocesses materials into new products | Aluminum can → new can; paper → cardboard | Saves 95% energy (Al); reduces landfill volume |
| Compost | Aerobic decomposition of organic waste | Food scraps and yard waste → humus | Reduces CH₄ from landfills; produces soil amendment |
| WTE Incineration | Combustion with energy capture | Mass-burn facilities generating electricity | Reduces landfill volume ~90%; generates energy |
Comparison of major waste reduction strategies by mechanism, example, and environmental benefit
SECTION 6
Worked Example: Evaluating a Community Recycling Program
The following example demonstrates how to calculate key waste metrics and evaluate the effectiveness of a municipal waste reduction initiative—a common task on APES free-response questions.
City of Greenfield Recycling Analysis
- 1
Step 1 — Identify Given Values
The City of Greenfield has a population of 50,000 residents. In 2024, the city generated a total of 36,500 metric tons of municipal solid waste (MSW). Of this, 10,950 metric tons were recycled, and 3,650 metric tons were composted. The remainder was sent to a sanitary landfill. - 2
Step 2 — Calculate Per-Capita Waste Generation
Per-capita generation = Total MSW ÷ Population = 36,500 metric tons ÷ 50,000 people = 0.73 metric tons per person per year. Converting to daily rate: 0.73 × 1,000 kg ÷ 365 days = 2.0 kg per person per day.Per-capita generation ≈ 2.0 kg/person/day - 3
Step 3 — Calculate the Waste Diversion Rate
Total mass diverted = recycled + composted = 10,950 + 3,650 = 14,600 metric tons. Diversion rate = (14,600 ÷ 36,500) × 100 = 40%.Diversion rate = 40% - 4
Step 4 — Calculate Landfill Mass
Mass to landfill = Total MSW − Mass diverted = 36,500 − 14,600 = 21,900 metric tons. This represents 60% of all waste generated.21,900 metric tons sent to landfill (60%) - 5
Step 5 — Evaluate and Recommend
Greenfield's 40% diversion rate exceeds the U.S. national average of approximately 32% but falls short of the EPA's 50% target. To improve, the city could implement a Pay-As-You-Throw (PAYT) pricing system, which charges residents based on the volume of trash they generate, thereby incentivizing source reduction. Additionally, expanding the composting program to include food waste (not just yard waste) could divert an additional 15–20% of the waste stream, since organic materials typically constitute the largest single category of MSW.Recommendation: Implement PAYT pricing and expand composting to food waste
SECTION 7
Strengths, Limitations & Tradeoffs
No waste reduction method is a panacea. The AP exam frequently presents scenarios requiring you to weigh the tradeoffs among different strategies, considering environmental effectiveness, economic cost, social equity, and technological feasibility. The table below compares common approaches across these dimensions.
| Method | Strengths | Limitations |
|---|---|---|
| Source Reduction | Highest environmental benefit per unit effort; reduces upstream extraction and emissions; saves money for consumers and producers | Requires behavioral change and industry cooperation; difficult to measure and enforce; may conflict with economic growth models based on consumption |
| Recycling | Conserves raw materials; reduces energy use (especially for metals); creates jobs in sorting and processing industries | Contamination reduces quality (downcycling); not all materials are recyclable; dependent on commodity markets; transportation generates emissions |
| Composting | Diverts organic waste (largest MSW fraction); produces useful soil amendment; reduces landfill methane emissions | Requires space and management; may produce odors; can attract pests if not properly maintained; limited to organic materials |
| Waste-to-Energy | Drastically reduces landfill volume (~90%); generates electricity; destroys pathogens in waste | Produces air pollutants (PM, dioxins, heavy metals) requiring scrubbers; generates toxic ash requiring landfilling; high capital costs; may disincentivize recycling |
| Sanitary Landfill | Handles all waste types; engineered liners and leachate systems minimize groundwater contamination; methane can be captured for energy | Permanent land use; generates CH₄ (GWP ≈ 28× CO₂); liner failure risk over long time frames; siting often disproportionately affects low-income and minority communities (environmental justice issue) |
Strengths and limitations of major waste management approaches
KEY TAKEAWAY
SECTION 8
Connection to the Circular Economy & Advanced Theory
The waste management hierarchy, while foundational, represents a linear progression—reduce, then reuse, then recycle, with disposal as the final step. A more ambitious framework, the circular economy, reimagines the entire production-consumption system so that the concept of "waste" effectively ceases to exist. In a circular economy, materials cycle continuously through biological nutrient loops (composting, anaerobic digestion) and technical nutrient loops (recycling, remanufacturing), with product design intentionally facilitating disassembly and material recovery at end of life. This represents a paradigm shift from managing waste to eliminating it by design.
| Feature | Linear Economy (Traditional) | Circular Economy (Advanced) |
|---|---|---|
| Material flow | Take → Make → Dispose | Design → Use → Recover → Redesign |
| Design philosophy | Planned obsolescence; minimize production cost | Design for durability, disassembly, and material recovery |
| Goal | Manage waste after creation | Eliminate waste as a concept |
| Resource use | Relies heavily on virgin material extraction | Maximizes use of secondary (recovered) materials |
| APES relevance | Tested as baseline model; identify environmental costs | Tested as sustainability ideal; connect to SDGs and resource depletion |
Linear economy vs. circular economy models
For the APES exam, understanding the circular economy concept allows you to discuss extended producer responsibility (EPR) laws, which require manufacturers to manage the entire life cycle of their products, including take-back and recycling at end of life. EPR shifts the financial and logistical burden of waste management from municipalities and taxpayers to the producers who profit from the products, creating market incentives for more sustainable design. Countries like Germany, Japan, and South Korea have implemented comprehensive EPR systems with measurable reductions in packaging waste and increases in recycling rates. As you move into college-level environmental science or policy courses, you will encounter formal modeling tools—such as material flow analysis and industrial ecology frameworks—that quantify these circular flows at national and global scales.
 Repair and reuse return products to service. Recycling recovers materials for manufacturing. These processes require energy and can produce residual waste.
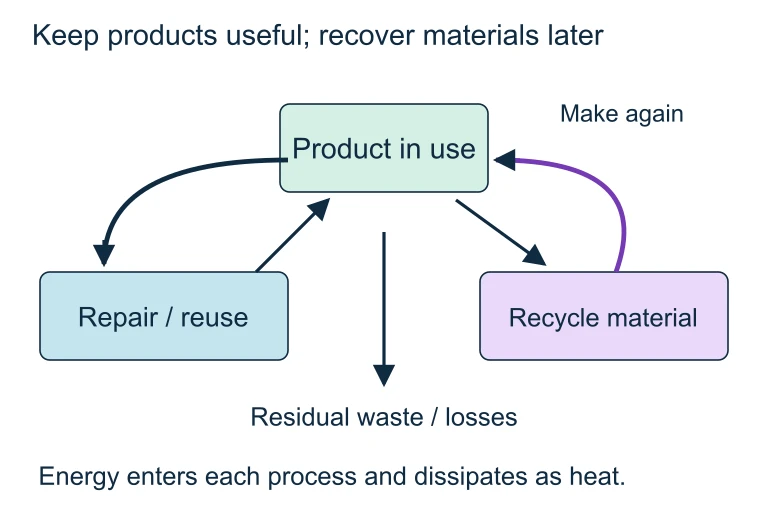 Repair and reuse return products to service. Recycling recovers materials for manufacturing. These processes require energy and can produce residual waste.
SECTION 9
Practice Problems
Question 1: CONCEPTUAL
- A. Installing a new waste-to-energy incinerator to burn non-recyclable waste
- B. Requiring manufacturers to use less packaging material on consumer products
- C. Expanding the curbside recycling program to include additional plastic types
- D. Opening a community composting facility for organic yard waste
Show answer (B)
Question 2: BASIC CALCULATION
- A. 30%
- B. 35%
- C. 40%
- D. 45%
Show answer (C)
Question 3: INTERMEDIATE
- A. Approximately 1.5 years
- B. Approximately 2.7 years
- C. Approximately 5.0 years
- D. Approximately 7.7 years
Show answer (B)
Question 4: APPLIED
4 ptsShow answer
Question 5: CRITICAL THINKING
4 ptsShow answer
SUMMARY
Summary
Summary
Waste reduction methods are organized according to the waste management hierarchy, which prioritizes source reduction (prevention) as the most environmentally effective strategy, followed by reuse, recycling and composting, energy recovery (waste-to-energy), and finally landfill disposal as the least preferred option. Key quantitative metrics include the waste diversion rate and per-capita waste generation, which allow meaningful comparisons between communities and tracking of progress over time.
Policy instruments such as Pay-As-You-Throw (PAYT) pricing, extended producer responsibility (EPR), and bottle deposit laws create economic incentives for waste reduction. The most advanced framework, the circular economy, envisions eliminating the concept of waste entirely through product design for durability, disassembly, and perpetual material cycling. For the AP exam, remember that an integrated waste management approach—combining multiple strategies tailored to local conditions—is more effective than relying on any single method, and that environmental justice considerations are essential when evaluating where and how waste is managed.