

SECTION 1
Historical Context & Motivation
Long before the formal science of ecology existed, naturalists recognized that organisms depend on one another for sustenance—herbivores eat plants, and predators eat herbivores. Yet the concept of organizing these feeding relationships into discrete, hierarchical levels, now called trophic levels, required decades of empirical observation and theoretical refinement. The word 'trophic' derives from the Greek trophē, meaning nourishment or food, underscoring the energetic foundation of the concept. Early ecological thinkers grappled with a fundamental question: how does energy captured by plants propagate through an entire community, and how much is lost along the way? The answers would shape conservation biology, fisheries management, and our understanding of biogeochemical cycles for the next century.
1927 • Elton's Food Chains
1942 • Lindeman's Trophic-Dynamic Model
1953 • Odum's Energy-Flow Diagrams
1960 • The Ten Percent Rule
Lindeman's work raised a question that still drives ecological research: given that only a fraction of energy passes from one trophic level to the next, what determines the maximum number of levels an ecosystem can support, and how do human activities—such as harvesting organisms at specific levels—alter the distribution of energy and biomass? Answering this question is essential for understanding carrying capacity, biodiversity loss, and sustainable food production.
SECTION 2
Core Principles & Definitions
A trophic level is the position an organism occupies in a food chain, defined by the number of energy-transfer steps separating it from the ecosystem's primary source of energy—typically the sun. Producers occupy the first trophic level because they convert abiotic energy into organic molecules through photosynthesis or chemosynthesis. Each subsequent level contains organisms that derive their energy by consuming organisms from the level below. Because the second law of thermodynamics mandates that energy degrades to heat with every metabolic conversion, the amount of usable energy decreases at each successive trophic level, ultimately limiting the length of food chains in nature.
Producers (Autotrophs)
Primary Consumers (Herbivores)
Secondary & Tertiary Consumers
Decomposers & Detritivores
Ecological Efficiency (~10%)
KEY TAKEAWAY
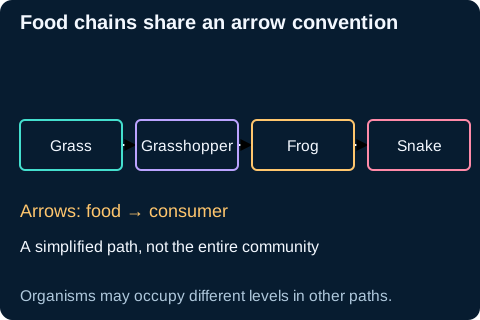 Energy passes from grass to grasshopper to frog to snake. Along this feeding path, these organisms occupy the producer, primary-consumer, secondary-consumer and tertiary-consumer levels; arrows point from food to consumer.Open full diagram
SECTION 3
Visual Explanation — The Ecological Pyramid
The diagram above illustrates the classic pyramid of energy, in which the base is always the broadest tier because producers contain the most total energy. Unlike pyramids of numbers or biomass—which can occasionally be inverted (for example, a single large tree supporting thousands of insects)—the pyramid of energy is never inverted because energy flow is unidirectional and always diminishes due to thermodynamic constraints. Each tier represents the total energy available at that level, measured in units such as kcal/m²/yr or kJ/m²/yr, and the progressive narrowing visually encodes the roughly tenfold decrease at each step.
SECTION 4
Mathematical Framework — Energy Transfer Efficiency
Quantifying energy transfer between trophic levels requires understanding several interrelated measures. The most fundamental relationship is between gross primary productivity (GPP)—the total amount of energy fixed by autotrophs—and net primary productivity (NPP), which subtracts the energy producers use for their own cellular respiration. Only NPP is available for consumption by the next trophic level. At each subsequent level, trophic efficiency quantifies the fraction of energy assimilated by consumers that becomes available to the level above.
NET PRIMARY PRODUCTIVITY
Where NPP = net primary productivity, GPP = gross primary productivity (total photosynthesis), and R = energy lost to the producers' own cellular respiration.
TROPHIC EFFICIENCY
In most ecosystems this value ranges from 5% to 20%, with a commonly cited average of approximately 10%. The 'ten percent rule' is a useful generalization for AP calculations.
ENERGY AVAILABLE AT TROPHIC LEVEL n
Where Eₙ = energy at trophic level n, E₁ = energy at the producer level, and efficiency is expressed as a decimal (e.g., 0.10 for 10%). For a tertiary consumer (n = 4): E₄ = E₁ × (0.10)³ = E₁ × 0.001.
AP Exam Tip
SECTION 5
Food Webs & Trophic Cascades
While the linear food chain is a helpful simplification, real ecosystems are characterized by complex, interconnected food webs in which organisms often feed at multiple trophic levels. An omnivore like a black bear, for instance, eats berries (acting as a primary consumer at TL 2) and also eats salmon (acting as a tertiary consumer at TL 4). This complexity means that the discrete trophic level assignments are approximations; ecologists sometimes assign organisms fractional trophic levels based on their diets. Nevertheless, the trophic level framework remains invaluable because it reveals how perturbations at one level can propagate through the entire web—a phenomenon known as a trophic cascade.
A classic example of a trophic cascade occurred in Yellowstone National Park following the reintroduction of wolves in 1995. Wolves (tertiary consumers) reduced elk populations (primary consumers), which allowed overgrazed willow and aspen stands (producers) to recover, stabilizing riverbanks and increasing biodiversity. This top-down control mechanism demonstrates that the removal or addition of a species at one trophic level can reverberate throughout the entire food web. In contrast, bottom-up control occurs when changes in nutrient availability or producer biomass propagate upward—for example, eutrophication boosting algal growth and subsequently increasing zooplankton and fish populations.
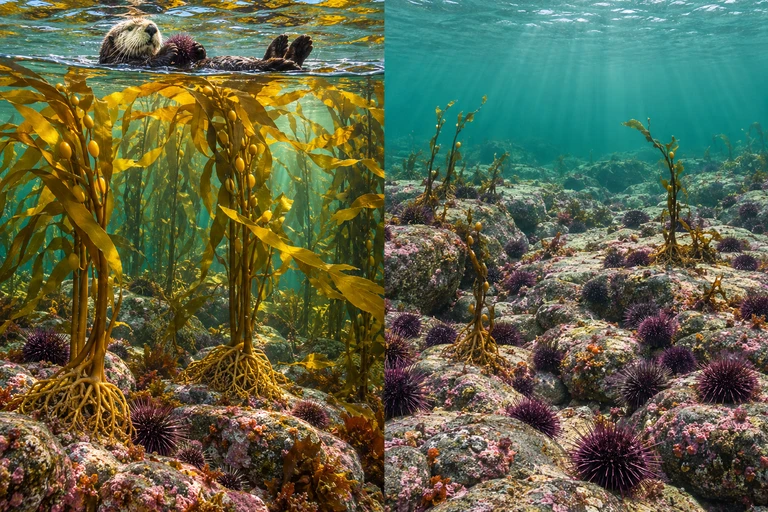 In this kelp–urchin–otter food web, otter feeding can limit urchin grazing and indirectly favor kelp. Other environmental conditions and interactions also influence kelp-forest outcomes.
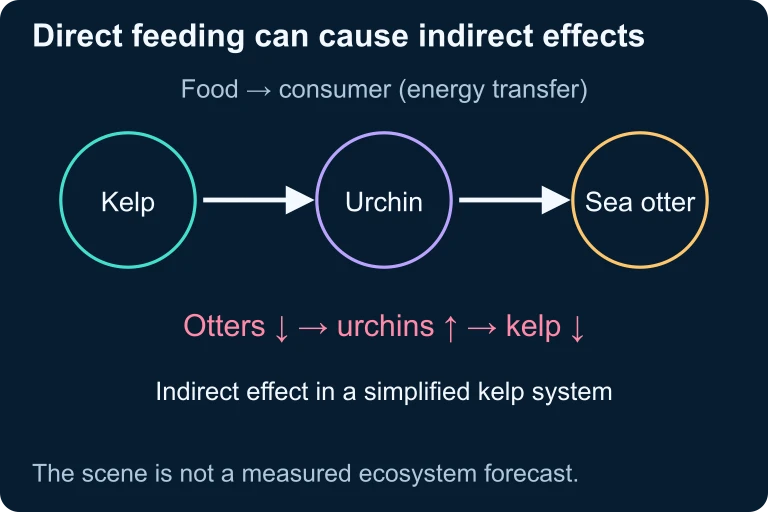 In this kelp–urchin–otter food web, otter feeding can limit urchin grazing and indirectly favor kelp. Other environmental conditions and interactions also influence kelp-forest outcomes.
SECTION 6
Worked Example — Calculating Energy Available at Higher Trophic Levels
A grassland ecosystem has a net primary productivity of 20,000 kcal/m²/yr. Assuming a trophic efficiency of 10% at each level, determine how much energy is available to the tertiary consumers (TL 4) and calculate how many kilograms of grain would be required to produce 1 kg of beef and then 1 kg of human tissue if humans ate only beef.
Energy Flow Across Trophic Levels
- 1
Step 1 — Identify Given Values
NPP at TL 1 (producers) = 20,000 kcal/m²/yr. Trophic efficiency = 10% (0.10) at each transfer. - 2
Step 2 — Calculate Energy at TL 2 (Primary Consumers)
E₂ = E₁ × 0.10 = 20,000 × 0.10 = 2,000 kcal/m²/yr2,000 kcal/m²/yr available to herbivores - 3
Step 3 — Calculate Energy at TL 3 (Secondary Consumers)
E₃ = E₂ × 0.10 = 2,000 × 0.10 = 200 kcal/m²/yr200 kcal/m²/yr available to secondary consumers - 4
Step 4 — Calculate Energy at TL 4 (Tertiary Consumers)
E₄ = E₃ × 0.10 = 200 × 0.10 = 20 kcal/m²/yr. Alternatively, using the shortcut: E₄ = 20,000 × (0.10)³ = 20,000 × 0.001 = 20 kcal/m²/yr.20 kcal/m²/yr available to tertiary consumers - 5
Step 5 — Agricultural Application
For this illustrative biomass conversion only, assume grain, beef and human biomass have equal energy per kilogram. Real feed-conversion ratios cannot be inferred from a 10% energy efficiency alone. With 10% efficiency, producing 1 kg of beef (TL 2) requires 10 kg of grain (TL 1). If humans then eat beef as secondary consumers (TL 3), producing 1 kg of human tissue requires 10 kg of beef, which itself required 100 kg of grain. This is why eating lower on the food chain is significantly more energy-efficient and has a smaller ecological footprint.100 kg of grain → 10 kg of beef → 1 kg of human tissue
SECTION 7
Strengths & Limitations of the Trophic Level Model
| Strengths | Limitations |
|---|---|
| Provides a clear, quantifiable framework for tracking energy flow through ecosystems. | Oversimplifies complex food webs—many organisms feed at multiple trophic levels (omnivory). |
| The ten percent rule allows straightforward calculations for resource management and sustainability planning. | Actual trophic efficiency varies widely (5–20%); using 10% introduces estimation error. |
| Ecological pyramids of energy are always upright, providing a reliable predictive tool. | Decomposers and detritivores do not fit neatly into a single trophic level, complicating the model. |
| Explains why top predators are rare and vulnerable to extinction—key insight for conservation. | Does not account for subsidies (e.g., marine nutrients washing into terrestrial systems) that can inflate productivity at certain levels. |
Comparison of the strengths and limitations of the trophic level model in ecological analysis
KEY TAKEAWAY
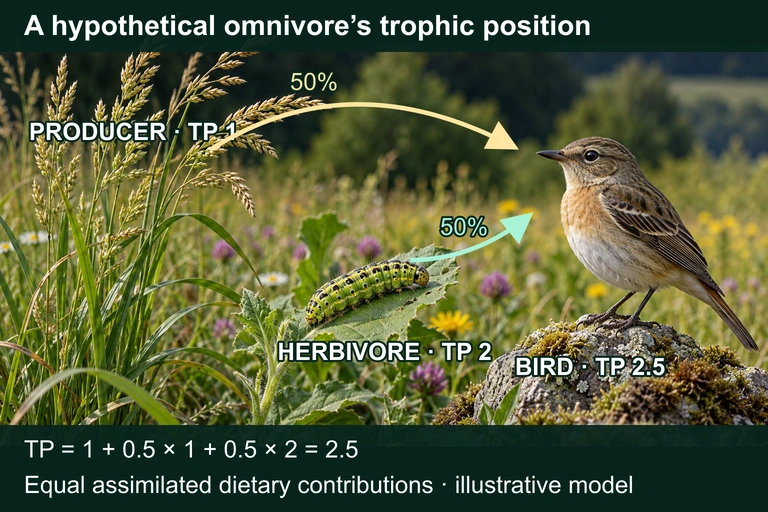 A hypothetical bird obtaining equal assimilated dietary contributions from producers and herbivores has trophic position 2.5 in this simplified model. The fractions describe dietary contributions rather than equal numbers of food items; the image does not assert this particular bird species’ diet.
SECTION 8
Connections to Bioaccumulation, Sustainability & Advanced Ecology
Trophic levels are not only central to understanding energy flow—they also explain the distribution of persistent pollutants in ecosystems. Bioaccumulation refers to the buildup of a toxin (such as mercury or DDT) within an individual organism over its lifetime, while biomagnification describes the progressive increase in toxin concentration at each successive trophic level. Because top predators consume large quantities of contaminated prey and metabolize the organic matter while retaining fat-soluble toxins, pollutant concentrations in apex predators can be millions of times higher than concentrations in the surrounding water or soil. Rachel Carson's Silent Spring (1962) famously documented this phenomenon with DDT and raptors, catalyzing the modern environmental movement.
| Concept | Trophic Level Application | Advanced / College Extension |
|---|---|---|
| Biomagnification | Toxin concentration increases at higher trophic levels because energy is lost but persistent chemicals are retained. | Stable isotope analysis (δ¹⁵N) is used in research to assign organisms to precise trophic positions based on nitrogen fractionation. |
| Sustainable Agriculture | Eating lower on the food chain (plants vs. meat) requires less land, water, and energy per calorie consumed. | Life-cycle assessments compare the trophic-level footprint of different diets, factoring in transportation, processing, and waste. |
| Keystone Species | Removal of a top predator triggers trophic cascades that restructure the entire community. | Network theory models food webs as directed graphs to predict cascading extinctions and community resilience. |
| Eutrophication | Excess nutrients boost TL 1, causing algal blooms that crash dissolved oxygen when decomposers break down dead algae. | Dynamic ecosystem models integrate nutrient loading, trophic transfers, and oxygen budgets to predict hypoxic zones. |
How trophic-level concepts connect to broader environmental science topics and advanced ecological research
As you move beyond AP Environmental Science into college-level ecology, you will encounter increasingly sophisticated treatments of trophic dynamics, including metabolic scaling theory (which links body size to trophic position and energy use) and ecosystem-level modeling with differential equations. For now, the ten percent rule and the conceptual framework of trophic levels provide the foundation upon which all of these advanced approaches are built.
SECTION 9
Practice Problems
Question 1: CONCEPTUAL
- A. Producers always have larger body sizes than consumers, so they contain more total energy.
- B. Energy transfer between trophic levels is inefficient, with most energy lost as heat at each step due to the second law of thermodynamics.
- C. Predators reproduce more slowly than their prey, so their population growth cannot exceed that of the lower levels.
- D. Decomposers consume the majority of energy before it can reach higher trophic levels, keeping the base wide.
Show answer (B)
Question 2: BASIC CALCULATION
- A. 5,000 kcal/m²/yr
- B. 500 kcal/m²/yr
- C. 50 kcal/m²/yr
- D. 5 kcal/m²/yr
Show answer (B)
Question 3: INTERMEDIATE
- A. Bioaccumulation; zooplankton (TL 2) because they are directly exposed to contaminated water.
- B. Biomagnification; large fish (TL 3) because they accumulate DDT faster than they metabolize it.
- C. Biomagnification; osprey (TL 4 or 5) because the highest concentrations of fat-soluble toxins accumulate in top predators.
- D. Eutrophication; producers (TL 1) because excess nutrients increase toxin uptake by algae.
Show answer (C)
Question 4: APPLIED
4 ptsShow answer
Question 5: CRITICAL THINKING
4 ptsShow answer
SUMMARY
Summary — Trophic Levels
Summary
Trophic levels describe the hierarchical positions organisms occupy in a food chain or food web, beginning with producers (TL 1) that fix solar or chemical energy, followed by primary consumers (TL 2), secondary consumers (TL 3), and tertiary consumers (TL 4). The ten percent rule states that approximately 10% of energy is transferred between levels, with the rest lost primarily as metabolic heat in accordance with the second law of thermodynamics. This progressive energy loss explains why the pyramid of energy is never inverted and why most ecosystems support only four to five trophic levels.
Key quantitative relationships include NPP = GPP − R and Eₙ = E₁ × (efficiency)ⁿ⁻¹. Beyond energy, trophic levels explain biomagnification of persistent toxins, trophic cascades triggered by predator removal or addition, and the environmental rationale for eating lower on the food chain to reduce agriculture's ecological footprint. Decomposers process dead organic matter from all levels, recycling nutrients and linking trophic dynamics to biogeochemical cycles. Mastering these interconnections is essential for success on the AP Environmental Science exam and for understanding the ecological principles that underpin environmental policy.