

SECTION 1
Historical Context & Motivation
Phosphorus is essential to all living organisms—it forms the backbone of DNA and RNA, drives energy transfer through ATP, and is a structural component of cell membranes and bones. Yet unlike carbon and nitrogen, phosphorus has no significant gaseous phase under normal environmental conditions, making its cycle fundamentally different from other major biogeochemical cycles. The recognition that phosphorus availability constrains biological productivity emerged gradually through centuries of agricultural experimentation, ecological observation, and geochemical research. Today, human alteration of the phosphorus cycle ranks among the most pressing planetary boundary concerns, as excess phosphorus loading drives eutrophication in aquatic systems worldwide.
1669 • Discovery of Phosphorus
1840 • Liebig's Law of the Minimum
1842 • First Synthetic Fertilizer
1974 • Phosphorus and Eutrophication
2009 • Planetary Boundaries Framework
These milestones reveal a central tension that animates the study of the phosphorus cycle: phosphorus is simultaneously a limiting nutrient essential for life and a pollutant that degrades aquatic ecosystems when mobilized in excess. How does phosphorus move through Earth's systems, why is its cycle so slow compared to atmospheric cycles, and what happens when humans accelerate these fluxes?
SECTION 2
Core Principles of the Phosphorus Cycle
The phosphorus cycle is distinguished from the carbon, nitrogen, and water cycles by several fundamental characteristics. Because phosphorus lacks a stable gaseous form under typical Earth-surface conditions, the cycle is overwhelmingly sedimentary—rocks and sediments serve as the long-term reservoir, and the atmosphere plays a negligible role. This means phosphorus moves through the biosphere far more slowly than carbon or nitrogen, with geological timescales governing its ultimate cycling. Understanding a few core principles provides the scaffolding needed to trace phosphorus through its reservoirs and fluxes.
No Gaseous Phase
Weathering as the Primary Input
Biological Uptake and Recycling
Sedimentation as the Long-Term Sink
Limiting Nutrient in Freshwater
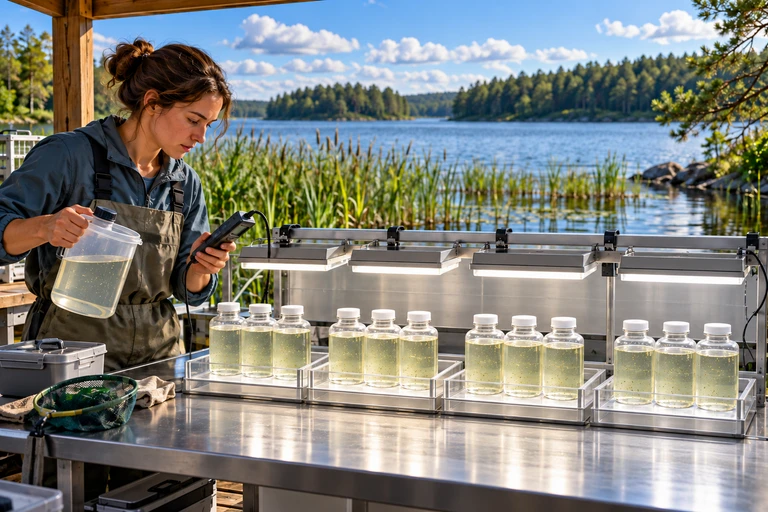 Compare a control, added nitrogen, added phosphorus, and both nutrients, with three independent vessels per treatment. Keep starting conditions, light, handling and measurement time consistent; infer nutrient limitation from measured responses.
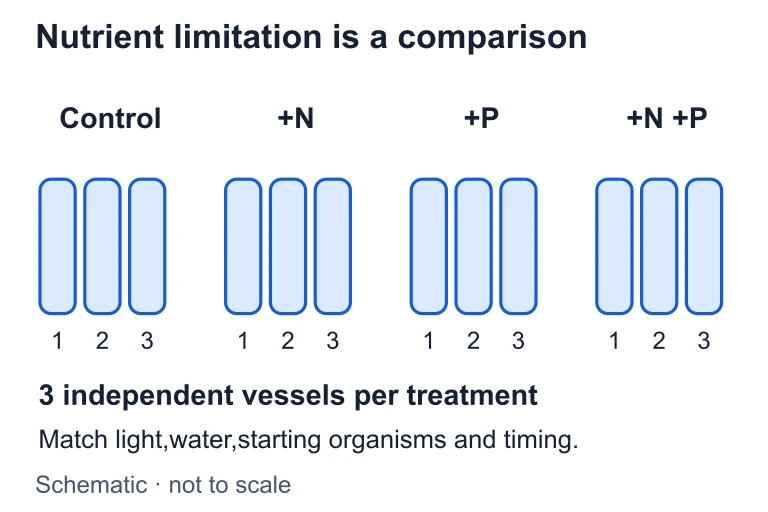 Compare a control, added nitrogen, added phosphorus, and both nutrients, with three independent vessels per treatment. Keep starting conditions, light, handling and measurement time consistent; infer nutrient limitation from measured responses.
SECTION 3
The Phosphorus Cycle — Visual Overview
The diagram above reveals the two nested loops that define the phosphorus cycle. The biological loop (soil → plants → consumers → decomposers → soil) operates on timescales of days to decades, rapidly recycling phosphate through living systems. The geological loop (rock → weathering → runoff → ocean sediment → tectonic uplift → rock) operates over millions of years. Human activities—particularly mining phosphate rock for fertilizer—short-circuit the geological loop by extracting phosphorus from deep reservoirs and introducing it into biological and aquatic systems at rates far exceeding natural weathering.
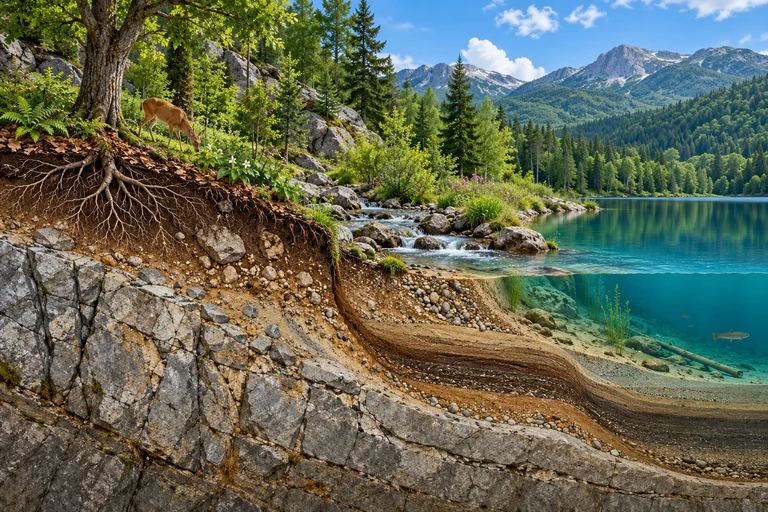 Chemical dissolution releases phosphate, while physical weathering exposes mineral surfaces. Local biological recycling operates within slower burial and uplift pathways. Dissolved material, sediment and atmospheric dust can transport phosphorus.
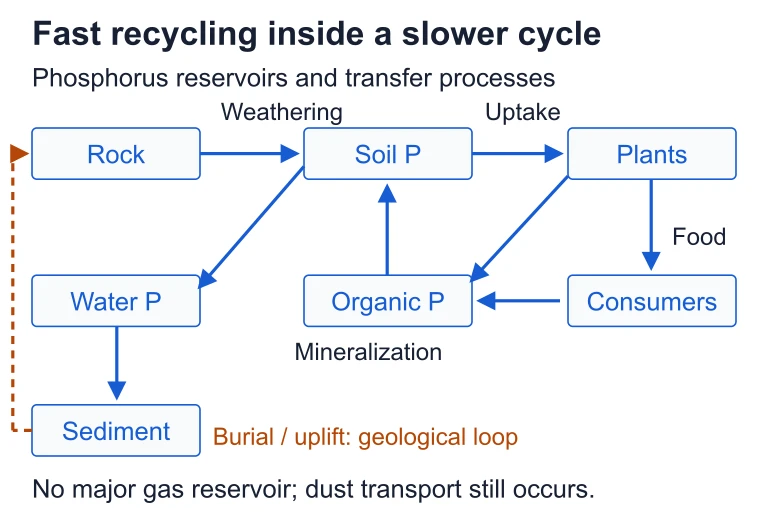 Chemical dissolution releases phosphate, while physical weathering exposes mineral surfaces. Local biological recycling operates within slower burial and uplift pathways. Dissolved material, sediment and atmospheric dust can transport phosphorus.
SECTION 4
How Phosphorus Moves Through Ecosystems
Weathering and Release
The phosphorus cycle begins with the weathering of phosphate-bearing minerals, primarily apatite (Ca₅(PO₄)₃(OH,F,Cl)). Chemical weathering by slightly acidic rainwater or organic acids produced by plant roots and soil microorganisms dissolves the mineral lattice, releasing phosphate ions (H₂PO₄⁻ and HPO₄²⁻) into soil solution. Physical weathering—driven by freeze-thaw cycles, root growth, and mechanical abrasion—breaks rock into smaller fragments, increasing the surface area exposed to chemical attack. This dual process occurs over centuries to millennia, which is why phosphorus availability in natural systems is inherently limited.
Soil Chemistry and Bioavailability
Once dissolved, phosphate in the soil is far from guaranteed to reach plant roots. Soil pH exerts powerful control over phosphorus availability. In acidic soils (pH < 5.5), phosphate reacts with aluminum and iron oxides to form insoluble precipitates. In alkaline soils (pH > 7.5), phosphate binds with calcium. The optimal range for phosphorus bioavailability is pH 6.0–7.0, where these fixation reactions are minimized. Many plants have evolved strategies to cope with low phosphorus availability, including symbiotic associations with mycorrhizal fungi that extend the effective root absorption surface by orders of magnitude and exude organic acids to solubilize bound phosphate.
Biological Cycling
Plants absorb dissolved inorganic phosphate primarily as H₂PO₄⁻ through root hair cells and incorporate it into organic molecules—nucleic acids, phospholipids, and ATP. Herbivores obtain phosphorus by consuming plant tissue, and predators acquire it through animal tissue. Phosphorus is excreted in animal waste and released when organisms die. Decomposers (bacteria and fungi) break down organic matter through a process called mineralization, converting organic phosphorus back to inorganic phosphate that re-enters the soil solution. In healthy ecosystems, this biological recycling can supply the majority of plant phosphorus demand, reducing reliance on new inputs from rock weathering.
Aquatic Transport and Sedimentation
Phosphorus that escapes biological recycling enters waterways through surface runoff and leaching, carrying both dissolved phosphate and particulate phosphorus bound to sediment particles. Rivers transport approximately 20–25 Tg of phosphorus to the oceans each year. In marine systems, phytoplankton assimilate dissolved phosphate near the surface; when they die, their remains sink and are decomposed at depth, creating a vertical gradient. Ultimately, phosphorus precipitates into marine sediments, where it may remain locked for tens to hundreds of millions of years until tectonic processes uplift it as new rock.
 Phosphate can remain dissolved, adsorb to a reactive surface, or enter a new solid phase through precipitation. Solution speciation and the available mineral surfaces help determine which processes occur.
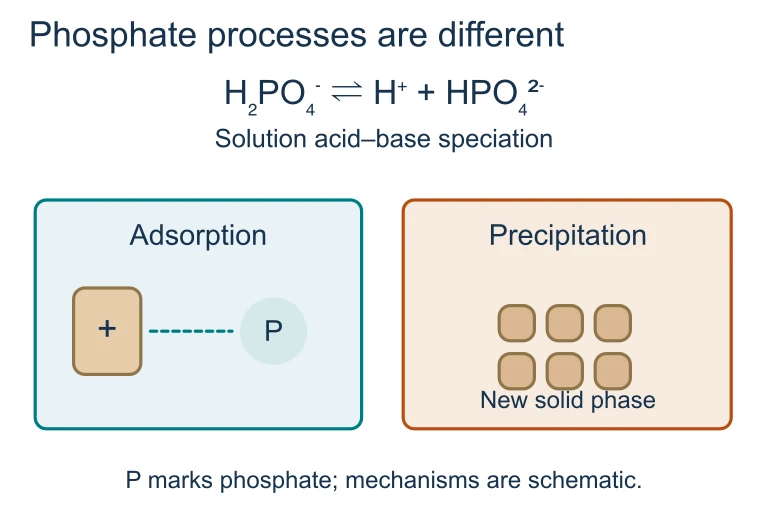 Phosphate solution species include H₂PO₄⁻ and HPO₄²⁻. Adsorption associates phosphate with a suitable reactive surface, while precipitation forms a new solid phase.
SECTION 5
Human Alteration of the Phosphorus Cycle
Humans have dramatically accelerated phosphorus fluxes, primarily through three activities: phosphate rock mining for fertilizers, concentrated animal feeding operations, and municipal wastewater discharge. Approximately 20 Tg of phosphorus per year are mined from deposits—roughly matching the total natural riverine flux to the ocean. Much of this mined phosphorus is applied to agricultural fields, where significant fractions are lost via runoff and erosion before crops can absorb them.
Eutrophication: The Primary Environmental Impact
When excess phosphorus enters a lake or slow-moving river, it fuels explosive growth of algae and cyanobacteria—a process called eutrophication. As these dense algal populations die and decompose, aerobic bacteria consume dissolved oxygen, creating hypoxic (oxygen-depleted) or anoxic conditions. Fish and invertebrates suffocate, light cannot penetrate the murky water to reach submerged vegetation, and some cyanobacterial species produce toxins harmful to wildlife and humans. The result is a cascade of ecological degradation. The Gulf of Mexico dead zone, fueled largely by Mississippi River nutrient loading, routinely exceeds 15,000 km² each summer—an area roughly the size of Connecticut.
Peak Phosphorus: A Finite Resource
Unlike nitrogen, which can be fixed from the atmosphere industrially (via the Haber-Bosch process), there is no technological shortcut for producing phosphorus. All commercial phosphorus comes from mining finite phosphate rock deposits, concentrated primarily in Morocco, China, and the United States. Some estimates suggest economically extractable reserves may be depleted within 50–400 years, raising the concept of peak phosphorus—the point at which extraction rates begin an irreversible decline. This makes phosphorus recovery from wastewater and agricultural recycling critical sustainability challenges.
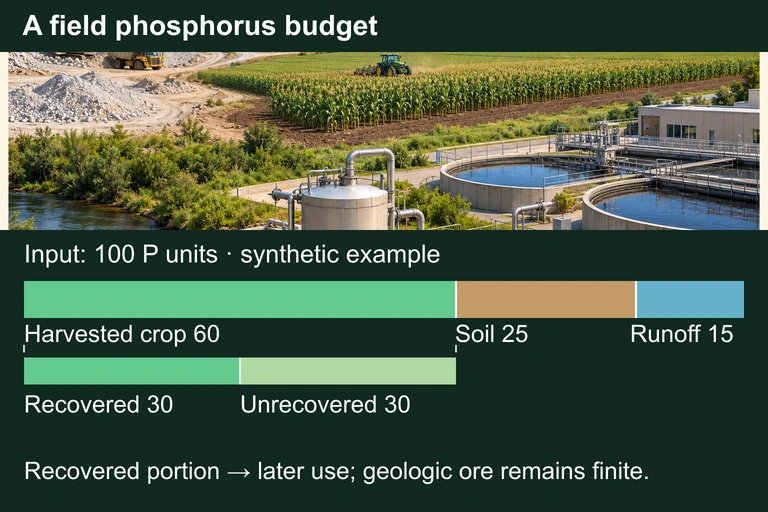 The synthetic 100-unit phosphorus input divides into 60 units of harvested crop uptake, 25 retained in soil and 15 in runoff. Recovering 30 of the harvested units returns a fraction of phosphorus without renewing the mined geologic stock.
SECTION 6
Worked Example: Phosphorus Loading in a Lake
A common quantitative task on the AP Environmental Science exam involves calculating phosphorus loading and determining whether a water body is at risk of eutrophication. The following worked example demonstrates this type of analysis.
Worked example
- 1
Step 1 — Identify Given Values
A farmer applies 50 kg of phosphorus per hectare per year to a 200-hectare field. Studies show that 15% of applied phosphorus is lost to a nearby lake via surface runoff. The lake has a surface area of 5 km². - 2
Step 2 — Calculate Total Phosphorus Applied
Total P applied = 50 kg/ha × 200 ha = 10,000 kg P/yr10,000 kg P/yr applied - 3
Step 3 — Calculate Phosphorus Lost to Runoff
P in runoff = 10,000 kg/yr × 0.15 = 1,500 kg P/yr1,500 kg P/yr enters the lake - 4
Step 4 — Calculate Loading per Unit Lake Area
Convert lake area: 5 km² = 5 × 10⁶ m². Areal loading = 1,500 kg / (5 × 10⁶ m²) = 3 × 10⁻⁴ kg/m²/yr = 0.3 g/m²/yr. Literature thresholds suggest lakes receiving more than approximately 0.3–1.0 g P/m²/yr are at high risk for eutrophication.Loading = 0.3 g P/m²/yr — at the eutrophication threshold - 5
Step 5 — Interpret the Result
The phosphorus loading from this single farm places the lake at the lower boundary of the eutrophication risk zone. Additional inputs from other farms, septic systems, or wastewater could push the lake well into eutrophic conditions. Mitigation strategies such as buffer strips, cover crops, or reduced fertilizer application rates would lower the runoff fraction below 15%.
SECTION 7
Phosphorus Cycle vs. Other Biogeochemical Cycles
The AP exam regularly asks students to compare and contrast the phosphorus cycle with the carbon and nitrogen cycles. The following table highlights the most tested differences and similarities across these three critical biogeochemical cycles.
| Feature | Phosphorus Cycle | Carbon Cycle | Nitrogen Cycle |
|---|---|---|---|
| Main reservoir | Sedimentary rock (lithosphere) | Atmosphere (CO₂), ocean, lithosphere | Atmosphere (N₂) |
| Gaseous phase? | No | Yes (CO₂, CH₄) | Yes (N₂, N₂O, NH₃) |
| Cycle type | Sedimentary | Atmospheric + sedimentary | Atmospheric |
| Geological timescale | 10⁷–10⁸ years | 10⁵–10⁸ years | Days to 10⁶ years |
| Limiting nutrient in | Freshwater ecosystems | Rarely limiting | Marine ecosystems, some terrestrial |
| Key human disruption | Mining, fertilizer runoff | Fossil fuel combustion, deforestation | Haber-Bosch process, combustion |
| Primary environmental consequence | Eutrophication, dead zones | Climate change, ocean acidification | Eutrophication (coastal), smog, acid rain |
Comparison of the three major biogeochemical cycles tested on the AP Environmental Science exam
SECTION 8
Connections to Broader Environmental Science
Understanding the phosphorus cycle connects to several advanced topics within AP Environmental Science and beyond. The concept of planetary boundaries frames phosphorus flows as a critical threshold: if humanity continues to mobilize phosphorus at current rates, the risk of triggering large-scale, abrupt shifts in freshwater and coastal ecosystems increases substantially. The phosphorus cycle also intersects with food security, since the finite nature of phosphate rock deposits poses a long-term threat to agricultural productivity that cannot be solved by atmospheric fixation technologies.
| AP APES Topic | Connection to the Phosphorus Cycle |
|---|---|
| Soil and soil dynamics | Phosphorus availability depends on soil pH, organic matter content, and microbial activity; soil degradation reduces phosphorus recycling efficiency. |
| Water pollution | Non-point source phosphorus from agricultural runoff is the leading cause of freshwater eutrophication and impairment of drinking water sources. |
| Feeding a growing population | Global food production depends on phosphorus fertilizer; peak phosphorus and geopolitical concentration of reserves (Morocco holds ~70%) create supply vulnerability. |
| Sustainability solutions | Phosphorus recovery from wastewater (struvite precipitation), precision agriculture, and buffer strips represent circular-economy approaches to managing phosphorus flows. |
| Biodiversity loss | Eutrophication-driven hypoxia and toxic algal blooms reduce aquatic biodiversity; phosphorus enrichment of terrestrial systems can shift plant community composition in favor of fast-growing species. |
Cross-topic connections relevant to the AP Environmental Science exam
Looking forward, advanced environmental science and sustainability research increasingly frames the phosphorus challenge as a dual crisis: too much phosphorus in the wrong places (aquatic dead zones) and too little in the right places (depleting mine reserves). Closed-loop phosphorus management—recovering phosphorus from waste streams and recycling it to agricultural fields—represents the frontier of this research, drawing on principles from ecology, engineering, and policy.
SECTION 9
Practice Problems
Question 1: CONCEPTUAL
- A. Phosphorus is only found in igneous rocks and cannot be dissolved in water.
- B. Phosphorus does not have a significant gaseous phase under normal environmental conditions, so its long-term reservoir is rock rather than the atmosphere.
- C. Phosphorus is too heavy to evaporate and therefore cannot enter the water cycle.
- D. Bacteria cannot convert phosphorus into a gas, unlike nitrogen and carbon.
Show answer (B)
Question 2: BASIC CALCULATION
- A. 365 kg
- B. 3,650 kg
- C. 10,000 kg
- D. 36,500 kg
Show answer (B)
Question 3: INTERMEDIATE
- A. 0.024 g/m²/yr — well below the eutrophication threshold
- B. 0.24 g/m²/yr — below but approaching the eutrophication threshold
- C. 2.4 g/m²/yr — well above the eutrophication threshold
- D. 0.72 g/m²/yr — above the eutrophication threshold
Show answer (B)
Question 4: APPLIED
Show answer
Question 5: CRITICAL THINKING