

SECTION 1
Historical Context & Motivation
In the decades following World War II, global population surged past 3 billion and was accelerating toward 4 billion, intensifying fears of widespread famine in the developing world. Traditional agricultural practices—rain-fed subsistence farming, open-pollinated seed varieties, and minimal fertilizer use—could not keep pace with demand. The Green Revolution refers to the period from the 1940s through the 1970s during which a suite of agricultural technologies—high-yield crop varieties (HYVs), synthetic fertilizers, chemical pesticides, irrigation infrastructure, and mechanization—was developed and disseminated across Latin America, South Asia, and Southeast Asia. The movement was spearheaded by agricultural scientists, philanthropic foundations, and national governments, and it fundamentally altered the relationship between human societies and arable land.
1943 • Mexican Agricultural Program
1960s • IR8 'Miracle Rice'
1968 • Term 'Green Revolution' Coined
1970 • Borlaug Wins Nobel Peace Prize
1970s–Present • Global Expansion & Critique
The Green Revolution undeniably averted predicted mass famines, but it also raised a question that remains central to AP Environmental Science: Can intensive agricultural practices sustain growing populations without irreversibly degrading the soil, water, and biodiversity on which those practices depend? Understanding the Green Revolution is essential for evaluating modern debates about industrial agriculture, genetically modified organisms, and sustainable land management.
SECTION 2
Core Principles & Definitions
The Green Revolution was not a single innovation but rather a convergent set of technological and policy interventions that, taken together, intensified agriculture beyond anything previously achievable. Each component reinforced the others: high-yield varieties required more nutrients, which demanded synthetic fertilizers, which in turn required reliable irrigation to dissolve and deliver nutrients to root zones. Understanding these interdependencies is critical for analyzing both the successes and the environmental trade-offs of the movement.
High-Yield Varieties (HYVs)
Synthetic Fertilizers
Irrigation Infrastructure
Chemical Pest Control
Mechanization & Monoculture
KEY TAKEAWAY
SECTION 3
Visual Explanation: Inputs, Outputs & Environmental Impacts
Notice how the diagram positions environmental costs as feedback loops rather than one-time consequences. Soil salinization from over-irrigation reduces future yields, requiring yet more fertilizer and water to compensate—a classic example of a positive feedback loop in an ecological context (where "positive" means self-amplifying, not beneficial). Similarly, nitrogen and phosphorus runoff causes eutrophication of downstream waterways, creating hypoxic dead zones that compromise aquatic ecosystems and can affect fisheries that communities depend on for protein. Monoculture reduces genetic diversity within crop species, making large regions vulnerable to a single pest or pathogen—as demonstrated by the 1970 Southern Corn Leaf Blight in the United States, which destroyed roughly 15% of the nation's corn crop because most hybrids shared a single cytoplasmic male-sterility gene.
SECTION 4
How It Works: The Mechanics of Yield Intensification
While the Green Revolution is not typically analyzed through a single unifying equation, several quantitative frameworks help illustrate why its inputs produced such dramatic yield gains—and why those gains come with measurable environmental costs. The AP Environmental Science exam frequently tests your ability to interpret and manipulate these relationships.
Harvest Index & Yield Potential
HARVEST INDEX
The harvest index (HI) measures the fraction of a plant's total aboveground biomass that is economically useful grain. Traditional wheat varieties had an HI of approximately 0.30 (30%), while Green Revolution semi-dwarf varieties achieved HI values of 0.50–0.55 (50–55%). The shorter stems redirect photosynthate toward grain, dramatically increasing yield per hectare without proportionally increasing total plant mass.
Nutrient Loading & Eutrophication Risk
NITROGEN NOT TAKEN UP
Where Nnot taken up is the mass of applied nitrogen not taken up by the crop (kg), Napplied is total nitrogen fertilizer applied (kg), and NUE is the nitrogen use efficiency (the fraction of applied N actually taken up by the crop). For example, an NUE of 0.33 means 67% is not taken up. This remainder may stay in soil or leave through runoff, leaching and gaseous pathways; the formula alone does not determine any one pathway.
Water Use Efficiency
IRRIGATION EFFICIENCY
Flood irrigation, common in early Green Revolution systems, has an IE of only 40–50%. Modern drip irrigation achieves 85–95%. The difference represents water lost to evaporation, seepage, and runoff—often carrying dissolved salts that cause soil salinization over time.
AP EXAM TIP
 With 10 g of aboveground dry biomass, 3 g versus 5 g of grain gives harvest indices of 0.30 and 0.50. At the same 1 N horizontal tip load, heights of 1.2 m and 0.8 m give base moments of 1.2 and 0.8 N·m; actual lodging also depends on stem strength, anchorage and growing conditions.
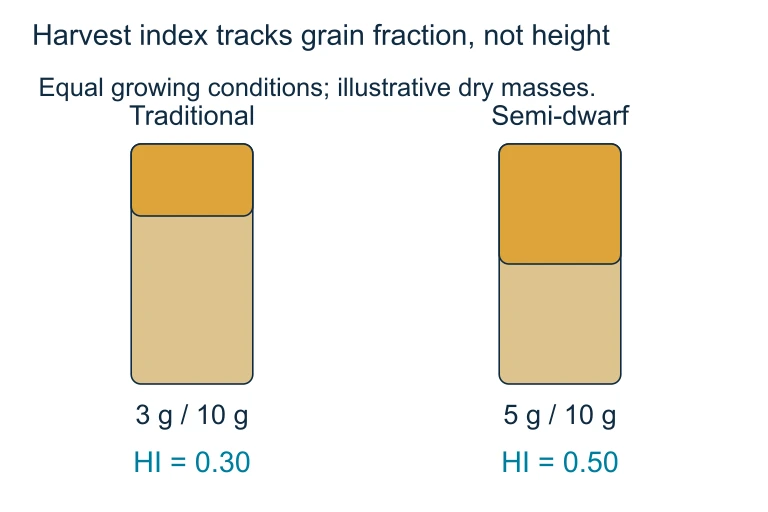 With 10 g of aboveground dry biomass, 3 g versus 5 g of grain gives harvest indices of 0.30 and 0.50. At the same 1 N horizontal tip load, heights of 1.2 m and 0.8 m give base moments of 1.2 and 0.8 N·m; actual lodging also depends on stem strength, anchorage and growing conditions.
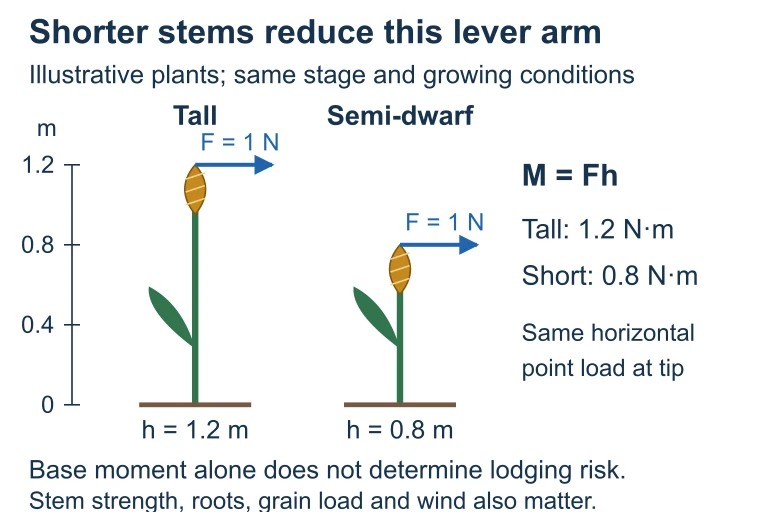 At the same 1 N horizontal tip load, 1.2 m and 0.8 m plants have base moments of 1.2 and 0.8 N·m. Stem strength, root anchorage and soil conditions also affect lodging.
SECTION 5
Environmental & Social Impacts: A Detailed Breakdown
Evaluating the Green Revolution requires distinguishing its intended outcomes—reduced hunger and increased food security—from its unintended environmental and social externalities. The AP exam frequently presents scenarios that test your ability to weigh trade-offs across ecological, economic, and social dimensions. The diagram below classifies the major impacts along a spectrum from beneficial to harmful.
Several of these impacts deserve deeper examination. Soil salinization occurs when irrigation water evaporates, leaving dissolved salts behind in the upper soil horizon; over time, salt concentrations reach levels toxic to crop roots. This is particularly severe in arid regions like Punjab (India/Pakistan) and the Aral Sea basin. Genetic erosion refers to the displacement of thousands of locally adapted landraces by a handful of HYVs; the FAO estimates that 75% of crop genetic diversity was lost during the twentieth century. This narrowing of the gene pool makes global food systems more susceptible to disease outbreaks and less adaptable to climate change. The socioeconomic dimension is equally significant: because Green Revolution technologies required capital investment in seeds, fertilizer, and machinery, wealthier landowners benefited disproportionately, while many smallholder farmers were driven off the land or into debt.
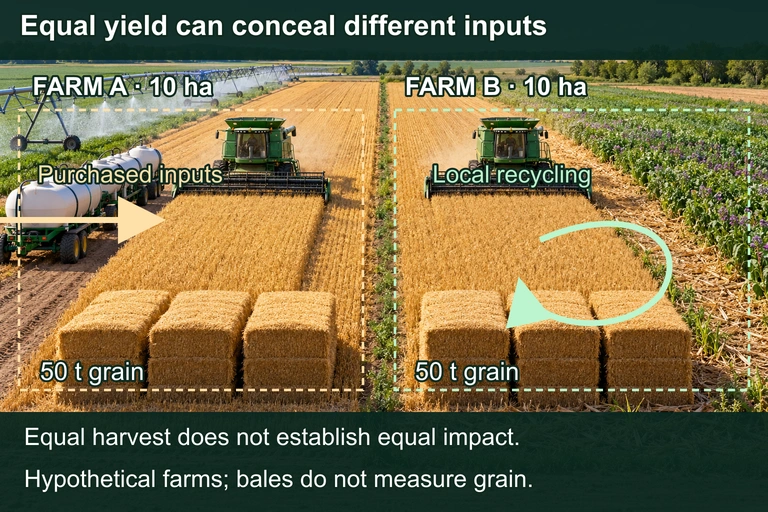 Both hypothetical farms produce 50 t of harvested grain on 10 ha, but their input pathways differ. Both may use additional inputs. The pictured bales and residue do not measure grain output. Equal yield alone does not establish equal environmental impact, profitability or resilience.
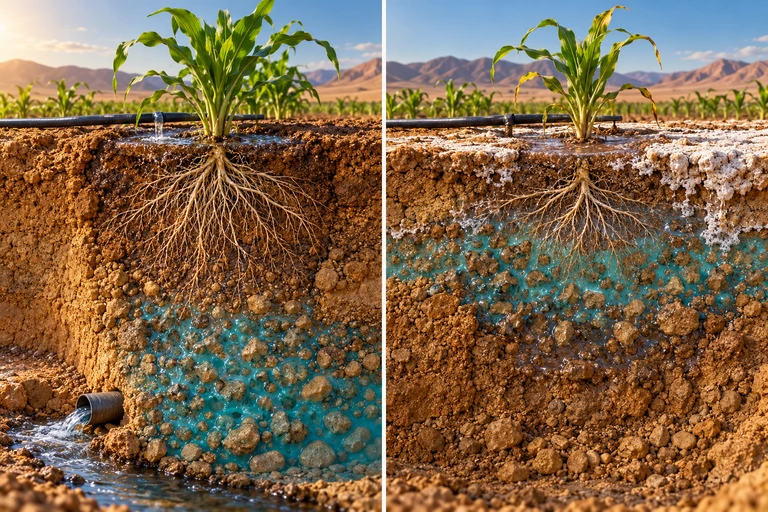 Irrigation imports dissolved salts. Evaporation and transpiration can concentrate them, and capillary rise can add salts from shallow groundwater. Adequate leaching and drainage can export salts.
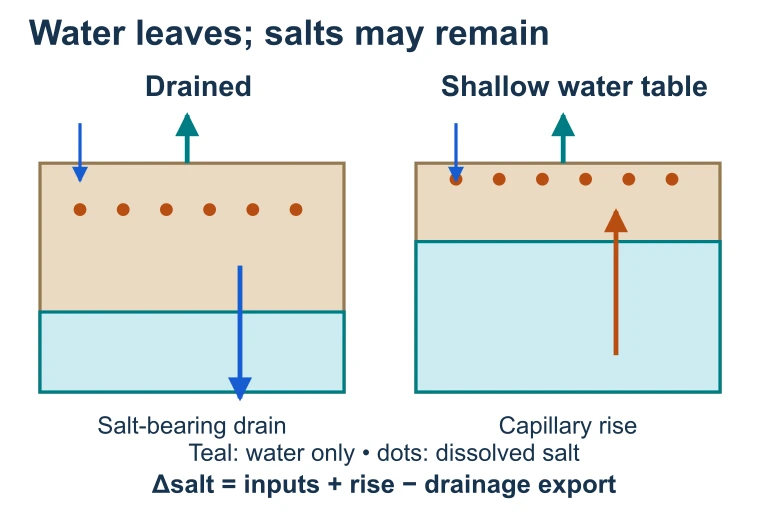 Irrigation imports dissolved salts. Evaporation and transpiration can concentrate them, and capillary rise can add salts from shallow groundwater. Adequate leaching and drainage can export salts.
SECTION 6
Worked Example: Calculating Nitrogen Not Taken Up
This worked example mirrors the type of quantitative analysis that appears on AP Environmental Science free-response questions. We will calculate how much applied nitrogen is not taken up by crops on a Green Revolution–style farm and connect the result to eutrophication risk.
Nitrogen Not Taken Up by a Rice Crop
- 1
Step 1 — Identify Given Values
A rice farmer in the Mekong Delta applies 150 kg of nitrogen fertilizer per hectare per growing season. The farm covers 200 hectares, and the local nitrogen use efficiency (NUE) is 0.35 (35%). - 2
Step 2 — Calculate Total Nitrogen Applied
Total Napplied = 150 kg/ha × 200 ha = 30,000 kg of nitrogen per season.N_applied = 30,000 kg - 3
Step 3 — Calculate Nitrogen Not Taken Up
Nitrogen not taken up = N applied × (1 − NUE) = 30,000 kg × (1 − 0.35) = 30,000 kg × 0.65 = 19,500 kg per season. This is a non-uptake total, not a measured runoff amount.N not taken up = 19,500 kg per season - 4
Step 4 — Interpret the Result
Approximately 19,500 kg (19.5 metric tonnes) of applied nitrogen are not taken up by the crop each season. With two growing seasons, the annual non-uptake total is 39,000 kg. Without pathway fractions, these data do not determine runoff. The remainder can include soil storage, leaching, runoff and gaseous losses. The portion reaching waterways can contribute to eutrophication.Annual N not taken up = 39,000 kg - 5
Step 5 — Propose a Mitigation Strategy
If precision management increases NUE from 0.35 to 0.55, nitrogen not taken up becomes 30,000 × (1 − 0.55) = 13,500 kg per season, or 27,000 kg per year. This is a reduction of 6,000 kg per season or 12,000 kg per year (30.8%). Runoff reduction cannot be quantified without pathway information; riparian buffers may reduce the portion transported in surface runoff.Improved annual N not taken up = 27,000 kg (30.8% reduction)
SECTION 7
Strengths, Limitations & Policy Trade-offs
A rigorous evaluation of the Green Revolution must account for its context-dependent outcomes. The same technologies that rescued South Asia from chronic famine also created new forms of environmental degradation and social inequality. The table below organizes these trade-offs to help you develop the kind of nuanced argumentation that AP free-response graders reward.
| Dimension | Strengths | Limitations |
|---|---|---|
| Food Production | Global cereal production tripled between 1950 and 2000; caloric availability per capita increased even as population doubled. | Focused almost exclusively on wheat, rice, and maize—neglecting crops like millet, sorghum, and legumes important to subsistence diets. |
| Soil Health | Higher yields per hectare can reduce total land under cultivation (land-sparing hypothesis), preserving natural soil ecosystems elsewhere. | Continuous monocropping depletes soil organic matter; over-irrigation causes salinization and waterlogging; heavy tillage accelerates erosion. |
| Water Resources | Irrigation infrastructure enabled year-round farming, stabilizing food supply against monsoon variability. | Massive aquifer depletion (e.g., Punjab, Ogallala); eutrophication of rivers, lakes, and coastal zones from nutrient runoff. |
| Biodiversity | Land-sparing effect may conserve habitat that would otherwise be converted to farmland. | Monoculture eliminates on-farm biodiversity; pesticides harm pollinators and non-target species; genetic diversity within crop species severely reduced. |
| Socioeconomics | Lower food prices benefited consumers, especially urban poor; national food security improved in India, Mexico, and others. | Capital-intensive inputs favored large landholders; many smallholders incurred debt or lost land; increased rural-to-urban migration. |
| Energy & Climate | More efficient per-calorie land use potentially reduces deforestation and associated CO₂ emissions. | Haber-Bosch process is energy-intensive (uses natural gas); mechanization depends on fossil fuels; paddy rice produces significant methane emissions. |
Trade-off analysis of Green Revolution impacts across six dimensions
KEY TAKEAWAY
SECTION 8
Beyond the Green Revolution: Sustainable Agriculture
The environmental costs documented in the preceding sections have motivated a search for agricultural approaches that maintain high productivity while reducing ecological damage. AP Environmental Science tests your ability to compare the Green Revolution paradigm with emerging alternatives, often framed as the shift toward sustainable agriculture or the so-called Second Green Revolution. The table below contrasts key features of the original Green Revolution with modern sustainable intensification strategies.
| Feature | Green Revolution (1st) | Sustainable Intensification (2nd) |
|---|---|---|
| Seed Technology | Conventionally bred HYVs; semi-dwarf wheat and rice | GMOs, CRISPR-edited crops, drought-tolerant and pest-resistant varieties; emphasis on diverse crop portfolios |
| Nutrient Management | Blanket application of synthetic NPK fertilizers | Precision agriculture: GPS-guided variable-rate application, slow-release fertilizers, cover cropping, and biological nitrogen fixation |
| Pest Management | Calendar-based chemical pesticide spraying | Integrated Pest Management (IPM): biological control agents, pheromone traps, resistant cultivars, and targeted pesticide use only when thresholds are exceeded |
| Water Use | Flood and furrow irrigation (40–50% efficiency) | Drip irrigation (85–95% efficiency), deficit irrigation scheduling, rainwater harvesting, and constructed wetlands for nutrient filtration |
| Soil Health | Intensive tillage; monoculture | No-till and minimum-till farming, crop rotation, polyculture, agroforestry, and composting to build soil organic matter |
| Equity Focus | Top-down technology transfer; benefited large landholders disproportionately | Farmer-participatory research, microfinance for smallholders, community seed banks, and open-source plant breeding |
Comparison of first-generation Green Revolution and modern sustainable intensification approaches
The transition from the first Green Revolution to sustainable intensification is not a clean break but rather an ongoing, contested process. Many farmers in the developing world still depend on Green Revolution–era inputs and lack access to the capital, technology, or extension services needed to adopt sustainable alternatives. Meanwhile, global population is projected to reach 9.7 billion by 2050, requiring an estimated 50–70% increase in food production from current levels—a challenge that will demand both the productivity gains pioneered by the Green Revolution and the ecological safeguards of sustainable intensification. This tension between production and conservation is a recurring theme throughout AP Environmental Science and will likely appear in multiple contexts on the exam.
SECTION 9
Practice Problems
Question 1: CONCEPTUAL
- A. Synthetic fertilizers directly cause genetic mutations that reduce diversity within crop populations.
- B. The widespread adoption of a small number of high-yield varieties displaced thousands of locally adapted landraces that farmers had traditionally cultivated.
- C. Mechanization physically destroyed wild crop relatives growing adjacent to agricultural fields.
- D. Irrigation systems prevented natural cross-pollination between crop species by isolating fields from surrounding ecosystems.
Show answer (B)
Question 2: BASIC CALCULATION
- A. 24,000 kg
- B. 36,000 kg
- C. 48,000 kg
- D. 60,000 kg
Show answer (B)
Question 3: INTERMEDIATE
- A. Switching to drip irrigation, implementing crop rotation, and adopting integrated pest management (IPM)
- B. Increasing fertilizer application rates, building larger canal systems, and applying stronger pesticides
- C. Planting riparian buffer zones, constructing terraces, and using no-till farming
- D. Expanding irrigation from rivers instead of aquifers, applying gypsum to saline soils, and using genetically modified Bt crops exclusively
Show answer (A)
Question 4: APPLIED
4 ptsShow answer
Question 5: CRITICAL THINKING
4 ptsShow answer
SUMMARY
Summary
Summary
The Green Revolution (1940s–1970s) was a transformative period in global agriculture driven by high-yield varieties (HYVs), synthetic fertilizers (enabled by the Haber-Bosch process), irrigation infrastructure, chemical pesticides, and mechanization. Spearheaded by Norman Borlaug and institutions like the Rockefeller Foundation, it tripled global cereal production, averted mass famine in South Asia and Latin America, and lowered food prices—but these gains came with significant environmental externalities.
Key environmental costs include soil salinization from over-irrigation, eutrophication and aquatic dead zones from nitrogen and phosphorus runoff, aquifer depletion, loss of crop genetic diversity due to monoculture, and fossil fuel dependence. Quantitative tools—harvest index, nitrogen use efficiency, and irrigation efficiency—allow us to measure these trade-offs. Modern sustainable intensification approaches—including integrated pest management (IPM), drip irrigation, precision agriculture, crop rotation, and no-till farming—seek to maintain productivity while reducing ecological damage, representing the ongoing evolution of the Green Revolution legacy.