

SECTION 1
Historical Context & Motivation
Pollution has accompanied human civilization since the earliest settlements concentrated waste in rivers and soils, but systematic recognition of pollution sources as a public health and ecological crisis did not emerge until the Industrial Revolution. The rapid combustion of coal in nineteenth-century London, the discharge of untreated industrial effluent into waterways, and the accumulation of chemical residues in agricultural soils collectively revealed that pollution could no longer be treated as a localized nuisance. By the mid-twentieth century, catastrophic events—from toxic smog episodes to rivers catching fire—compelled governments to classify pollution by its origin, distinguishing between identifiable discharge pipes and diffuse runoff from landscapes. This classification scheme became the regulatory backbone of modern environmental law and remains central to how the AP Environmental Science exam frames aquatic and terrestrial contamination.
1858 • The Great Stink of London
1952 • London's Great Smog
1969 • Cuyahoga River Fire
1972 • U.S. Clean Water Act
1987 • CWA Amendments & Nonpoint Source Management
This historical trajectory reveals a key insight: controlling pollution requires first identifying where it originates. Whether a contaminant enters an ecosystem through a discrete pipe or across kilometers of agricultural landscape determines the regulatory tools, monitoring strategies, and remediation technologies that are most effective. The central question driving this lesson is therefore: How do we classify, trace, and manage the diverse sources through which pollutants enter aquatic and terrestrial systems?
SECTION 2
Core Principles & Definitions
At the foundation of pollution science lies a deceptively simple distinction: a point source is any single, identifiable, and often regulated location from which pollutants are discharged into the environment, such as a factory outfall pipe or a municipal wastewater treatment plant. A nonpoint source (NPS), by contrast, refers to pollution that enters water or soil from diffuse, spatially distributed origins—agricultural runoff carrying fertilizers across broad fields, urban stormwater washing oil and heavy metals off roads, or atmospheric deposition spreading mercury over a watershed. Understanding these core categories—and the factors that control pollutant fate once released—is essential for AP Environmental Science.
Point Sources
Nonpoint Sources
Primary vs. Secondary Pollutants
Bioaccumulation & Biomagnification
Pollutant Fate & Transport
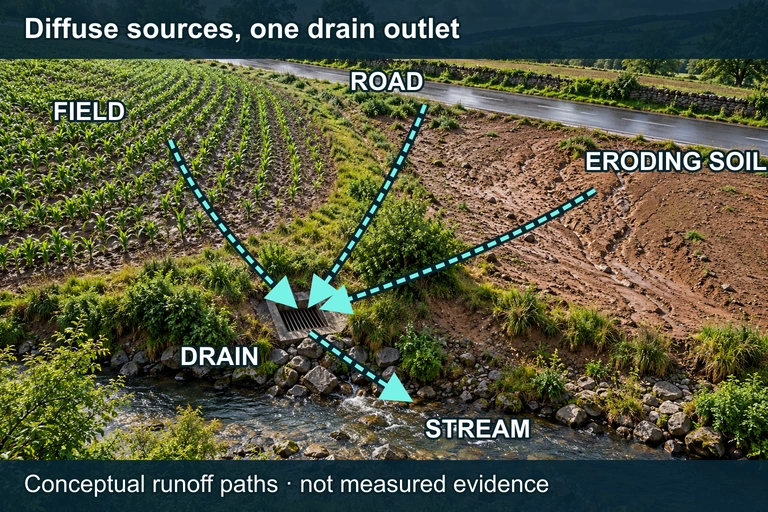 Rainfall can carry pollution from diffuse field, road and eroding-soil sources through a connected drain network to one outlet. A concentrated final conduit does not make every upstream source a point source. The routes are conceptual, not measured.
KEY TAKEAWAY
SECTION 3
Visual Explanation: Point vs. Nonpoint Source Diagram
The diagram above illustrates the fundamental spatial distinction that drives environmental regulation. On the left side, a factory outfall and a wastewater treatment plant each discharge through a single pipe into the receiving water body—these are classic point sources whose flow rate, chemical composition, and temperature can be monitored at a single location. On the right, agricultural runoff and urban stormwater enter the water body along extended stretches of shoreline, carried by sheet flow and storm drains across broad areas. Because no single pipe can be identified, these nonpoint sources are far more difficult to monitor, attribute, and regulate. Both categories of pollution ultimately affect aquatic and terrestrial systems, infiltrating soil and contaminating groundwater reserves. Understanding this visual framework is the first step toward mastering the pollution questions on the AP Environmental Science exam.
SECTION 4
Mechanisms of Pollution Transport & Transformation
Once pollutants are released from either point or nonpoint sources, their environmental impact depends on how they are transported and transformed. Several interconnected mechanisms govern pollutant fate in aquatic and terrestrial systems, and the AP exam frequently tests your ability to distinguish among them.
Oxygen Demand & Eutrophication
When organic pollutants—from sewage, food processing, or animal waste—enter a water body, aerobic bacteria decompose them and consume dissolved oxygen (DO). The biochemical oxygen demand (BOD) quantifies this oxygen consumption. High BOD values indicate heavy organic loading and the potential for hypoxic or anoxic conditions. Similarly, excess nutrients (nitrogen and phosphorus) from agricultural fertilizers and wastewater trigger eutrophication—the rapid growth of algae whose subsequent decomposition further depletes dissolved oxygen, creating dead zones where aquatic organisms cannot survive.
BOD CONCEPTUAL MODEL
Where DOsaturation is the maximum dissolved oxygen a water body can hold at a given temperature, and DOmeasured is the actual concentration observed. The greater the deficit, the higher the organic pollution load.
Bioaccumulation & Biomagnification
Persistent, lipophilic pollutants such as DDT, PCBs, and methylmercury resist metabolic breakdown and dissolve readily in fatty tissues. An organism absorbs these chemicals faster than it can excrete them, leading to bioaccumulation over its lifetime. When a predator consumes many contaminated prey organisms, the pollutant concentration magnifies at each successive trophic level—a process called biomagnification. This mechanism explains why top predators such as bald eagles and tuna accumulate the highest contaminant burdens even though ambient water concentrations may be extremely low.
BIOMAGNIFICATION FACTOR
Where Cpredator is the concentration of a contaminant in the predator's tissues and Cprey is the concentration in prey tissues. A BMF > 1 indicates biomagnification is occurring.
Atmospheric Deposition & Acid Rain
Air pollutants released from power plants, vehicles, and industrial facilities undergo atmospheric transport and chemical transformation. Sulfur dioxide (SO2) and nitrogen oxides (NOx) are primary pollutants that react with water vapor and oxygen to form sulfuric and nitric acids—secondary pollutants that fall as acid rain or dry deposition. These mechanisms connect distant emission sources to aquatic and terrestrial damage hundreds of kilometers downwind, blurring the boundary between point and nonpoint classification.
ACID RAIN FORMATION (SIMPLIFIED)
Sulfur dioxide emitted from coal-fired power plants dissolves in atmospheric moisture to form sulfurous acid, which is further oxidized to sulfuric acid (H2SO4), lowering precipitation pH well below the natural baseline of ≈ 5.6.
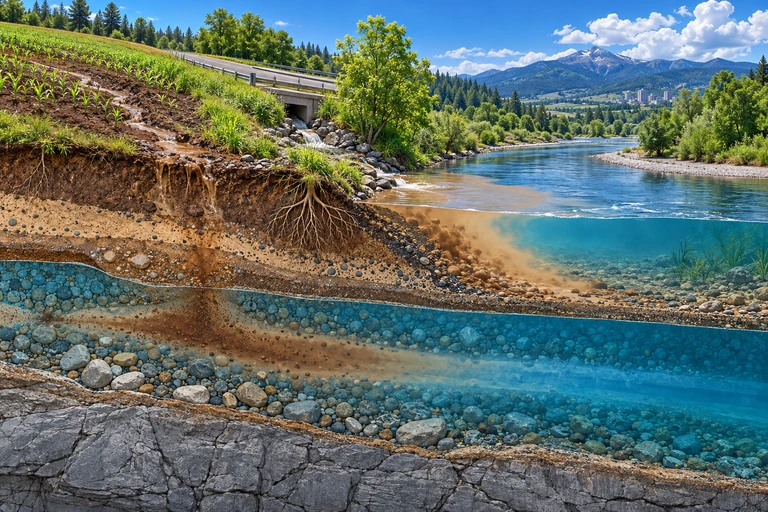 Dissolved pollutants can move with groundwater, while adsorbed pollutants may travel with sediment. Chemical form affects transport and exposure; intake, absorbed dose and tissue concentration are different quantities.
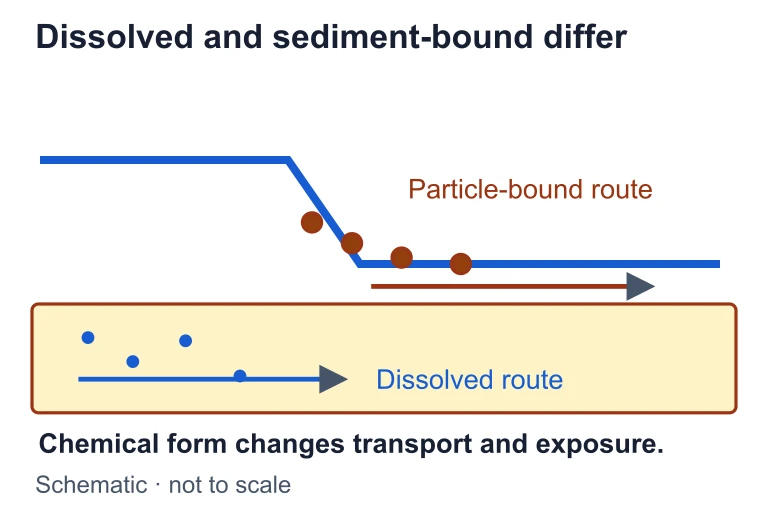 Dissolved pollutants can move with groundwater, while adsorbed pollutants may travel with sediment. Chemical form affects transport and exposure; intake, absorbed dose and tissue concentration are different quantities.
SECTION 5
Detailed Classification of Pollution Sources
The AP Environmental Science curriculum organizes pollution sources along multiple axes: by medium (air, water, soil), by spatial pattern (point vs. nonpoint), and by the type of pollutant released (chemical, biological, physical, thermal). The following diagram and table provide a comprehensive classification framework that integrates these dimensions.
| Pollution Source Type | Examples | Key Pollutants | Primary Medium Affected |
|---|---|---|---|
| Industrial point source | Factory discharge pipes, refineries, smelters | Heavy metals (Pb, Hg, Cd), organic solvents, thermal effluent | Water, Air |
| Municipal point source | Wastewater treatment plants, sewage overflows | Pathogens, nutrients (N, P), pharmaceuticals, BOD | Water |
| Agricultural nonpoint | Cropland runoff, irrigated fields, livestock operations | Nitrates, phosphates, pesticides, sediment, pathogens | Water, Soil |
| Urban nonpoint | Parking lots, roads, construction sites, lawns | Oil, heavy metals, sediment, plastics, bacteria | Water, Soil |
| Atmospheric (mobile) | Vehicles, aircraft, shipping | CO, NOₓ, VOCs, PM₂.₅, CO₂ | Air |
| Mining / extraction | Acid mine drainage, tailings ponds, hydraulic fracturing | Sulfuric acid, heavy metals, sediment, fracking fluids | Water, Soil |
Summary of major pollution source categories tested on the AP Environmental Science exam
SECTION 6
Worked Example: Identifying Sources & Calculating Impact
The following worked example mirrors the type of scenario-based analysis you will encounter on the AP Environmental Science exam. It integrates source identification with a quantitative assessment of pollutant loading.
Nutrient Loading from Mixed Sources into a Lake
- 1
Step 1 — Identify the Scenario
A lake receives water from three inputs: (1) a municipal wastewater treatment plant (WWTP) that discharges 5.0 × 10⁶ liters per day with a phosphorus concentration of 2.0 mg/L; (2) agricultural runoff from surrounding farms estimated at 1.2 × 10⁷ liters per day with a phosphorus concentration of 0.4 mg/L; and (3) urban stormwater at 3.0 × 10⁶ liters per day with a phosphorus concentration of 0.3 mg/L. Determine the daily phosphorus load from each source and identify the largest contributor. - 2
Step 2 — Classify Each Source
The WWTP is a point source because it discharges through an identifiable pipe under an NPDES permit. The agricultural runoff and urban stormwater are both nonpoint sources because they originate from diffuse, landscape-scale flows rather than a single discharge point. - 3
Step 3 — Calculate Phosphorus Load for Each Source
Pollutant load (mass/time) = flow rate × concentration. For the WWTP: Load = 5.0 × 10⁶ L/day × 2.0 mg/L = 1.0 × 10⁷ mg/day = 10.0 kg/day. For agricultural runoff: Load = 1.2 × 10⁷ L/day × 0.4 mg/L = 4.8 × 10⁶ mg/day = 4.8 kg/day. For urban stormwater: Load = 3.0 × 10⁶ L/day × 0.3 mg/L = 9.0 × 10⁵ mg/day = 0.9 kg/day.WWTP = 10.0 kg P/day | Ag. runoff = 4.8 kg P/day | Urban stormwater = 0.9 kg P/day - 4
Step 4 — Determine Total Load and Percent Contribution
Total daily phosphorus load = 10.0 + 4.8 + 0.9 = 15.7 kg/day. Percent contributions: WWTP = (10.0 / 15.7) × 100 ≈ 63.7%. Agricultural runoff = (4.8 / 15.7) × 100 ≈ 30.6%. Urban stormwater = (0.9 / 15.7) × 100 ≈ 5.7%.The point source (WWTP) contributes ≈ 63.7% of total phosphorus loading, making it the single largest contributor despite nonpoint sources collectively accounting for ≈ 36.3%. - 5
Step 5 — Interpret & Recommend
Although the WWTP contributes the majority of phosphorus, upgrading its treatment technology (e.g., adding chemical phosphorus removal) addresses only the point source fraction. Achieving water quality targets likely requires a combined strategy: upgrading the WWTP to reduce discharge concentrations below 0.5 mg/L while simultaneously implementing agricultural BMPs (buffer strips, cover crops, nutrient management plans) and urban stormwater controls (rain gardens, permeable pavement). This integrated approach is a hallmark of Total Maximum Daily Load (TMDL) planning, which the AP exam frequently references.
SECTION 7
Regulatory Approaches: Strengths & Limitations
Effective pollution control hinges on matching the right regulatory tool to the source type. The U.S. regulatory framework offers a useful case study because it employs fundamentally different strategies for point versus nonpoint sources—a distinction the AP exam expects you to analyze critically.
| Feature | Point Source Regulation | Nonpoint Source Management |
|---|---|---|
| Primary mechanism | NPDES permits with enforceable discharge limits (technology-based and water-quality-based standards) | Voluntary BMPs, cost-share incentive programs (CWA §319), and state-level management plans |
| Monitoring | Direct sampling at the discharge point; continuous electronic monitoring possible | Watershed-scale modeling, land-use surveys, ambient water quality monitoring |
| Strengths | High accountability; clear legal liability; dramatic reductions in industrial and municipal discharges since 1972 | Addresses the largest remaining source of water quality impairment; flexible, site-specific solutions |
| Limitations | Does not address diffuse runoff; compliance costs can be high for small municipalities; combined sewer overflows remain problematic | Largely voluntary and underfunded; difficult to measure effectiveness; politically challenging to impose land-use restrictions on agriculture |
| Key legislation | Clean Water Act §402 (NPDES); Clean Air Act (NSR permits for stationary sources) | CWA §319; Farm Bill conservation programs (EQIP, CRP); TMDL framework |
Comparison of regulatory approaches for point and nonpoint pollution sources
KEY TAKEAWAY
SECTION 8
Connections to Advanced Environmental Topics
Understanding pollution sources provides the foundation for several advanced topics you will encounter later in the AP Environmental Science curriculum and in collegiate environmental science coursework. The table below connects source-level concepts to their broader implications in environmental policy, toxicology, and sustainability.
| Foundational Concept | Advanced Connection |
|---|---|
| Point vs. nonpoint classification | TMDL development: allocating maximum pollutant loads across a watershed by assigning waste load allocations (WLAs) to point sources and load allocations (LAs) to nonpoint sources |
| Biomagnification of persistent pollutants | Environmental toxicology: dose-response models, LD₅₀ testing, endocrine disruption studies, and the Stockholm Convention on Persistent Organic Pollutants (POPs) |
| Eutrophication from nutrient loading | Dead zone formation (e.g., Gulf of Mexico hypoxia); integrated watershed management; precision agriculture to minimize fertilizer overuse |
| Primary and secondary air pollutants | Tropospheric ozone formation, photochemical smog modeling, cap-and-trade systems (SO₂ Acid Rain Program), and climate change mitigation via CO₂ emission controls |
| Pollutant fate and transport | Environmental modeling (e.g., Streeter-Phelps BOD/DO sag curve), Superfund site remediation, and life cycle assessment (LCA) in industrial ecology |
How foundational pollution source concepts connect to advanced environmental topics
The transition from source identification to systems-level analysis represents the intellectual arc of AP Environmental Science. While this lesson focuses on recognizing and classifying where pollutants originate, subsequent units address how those pollutants interact with biogeochemical cycles, affect ecosystem services, and drive policy debates about environmental justice—the observation that pollution sources are disproportionately located near low-income communities and communities of color. Mastering source classification now will equip you to engage critically with these more complex, interdisciplinary questions.
SECTION 9
Practice Problems
Question 1: CONCEPTUAL
- A. Point source pollution, because the farmer is the identifiable origin
- B. Nonpoint source pollution, because the nitrate enters the river from diffuse runoff across the landscape
- C. Secondary pollution, because the nitrate was chemically transformed from the fertilizer
- D. Thermal pollution, because the rainstorm alters the temperature of the river
Show answer (B)
Question 2: BASIC CALCULATION
- A. 0.4 kg/day
- B. 4.0 kg/day
- C. 40 kg/day
- D. 400 kg/day
Show answer (B)
Question 3: INTERMEDIATE
- A. Bioaccumulation; BMF = 10
- B. Biomagnification; BMF = 10
- C. Biomagnification; BMF = 50
- D. Bioaccumulation; BMF = 50
Show answer (B)
Question 4: APPLIED
4 ptsShow answer
Question 5: CRITICAL THINKING
4 ptsShow answer
SUMMARY
Summary
Summary
Pollution sources are classified primarily as point sources—single, identifiable discharge locations like factory outfalls and wastewater treatment plants regulated through NPDES permits—and nonpoint sources—diffuse, landscape-scale inputs such as agricultural runoff and urban stormwater managed through voluntary best management practices (BMPs). Pollutants are further categorized as primary (emitted directly) or secondary (formed through environmental reactions), and their impact is amplified through mechanisms like bioaccumulation, biomagnification, and eutrophication.
Quantitative tools—pollutant loading calculations (Load = flow × concentration), BOD measurements, and biomagnification factors—allow scientists and regulators to trace pollution to its origin and allocate reduction targets through Total Maximum Daily Load (TMDL) plans. For the AP exam, remember that controlling pollution effectively requires addressing both point sources (through permit systems and technology upgrades) and nonpoint sources (through land-use planning, buffer zones, and nutrient management), and that environmental justice considerations demand attention to the disproportionate siting of pollution sources near vulnerable communities.