

SECTION 1
Historical Context & Motivation
Humans have harnessed sunlight for millennia—ancient Greeks and Romans oriented buildings to capture solar warmth, and the Anasazi peoples of the American Southwest designed cliff dwellings that maximized winter solar gain while providing summer shade. The modern scientific exploitation of solar energy began in the nineteenth century when physicists first demonstrated that light could generate electricity. Throughout the twentieth century, the technology remained a niche curiosity, confined to spacecraft and remote scientific instruments, until the oil crises of the 1970s catalyzed serious investment in renewable alternatives. Today, solar energy stands at the forefront of the global energy transition, driven by plummeting costs, climate commitments, and the recognition that fossil-fuel combustion imposes unsustainable environmental externalities.
1839 • Photovoltaic Effect Discovered
1954 • First Practical Silicon Solar Cell
1973 • Oil Crisis Spurs Renewable Investment
2010s • Grid Parity and Exponential Growth
The central question driving solar energy development is straightforward yet profound: can humanity reliably convert the enormous flux of sunlight striking Earth—roughly 173,000 terawatts—into usable electricity and heat at a scale sufficient to displace fossil fuels, while managing the environmental trade-offs of land use, material extraction, and intermittency?
SECTION 2
Core Principles & Definitions
Solar energy refers to the radiant light and heat emitted by the Sun that can be captured and converted into useful forms of energy. Two primary technological pathways dominate: photovoltaic (PV) systems, which convert sunlight directly into electricity via semiconductor materials, and solar thermal systems, which use sunlight to heat a working fluid that drives a turbine or directly provides thermal energy. Understanding solar energy requires familiarity with several foundational concepts that govern how much energy is available, how efficiently it can be captured, and what limits its practical deployment.
Insolation
Photovoltaic Effect
Capacity Factor
Net Metering
KEY TAKEAWAY
SECTION 3
How Photovoltaic Cells Work
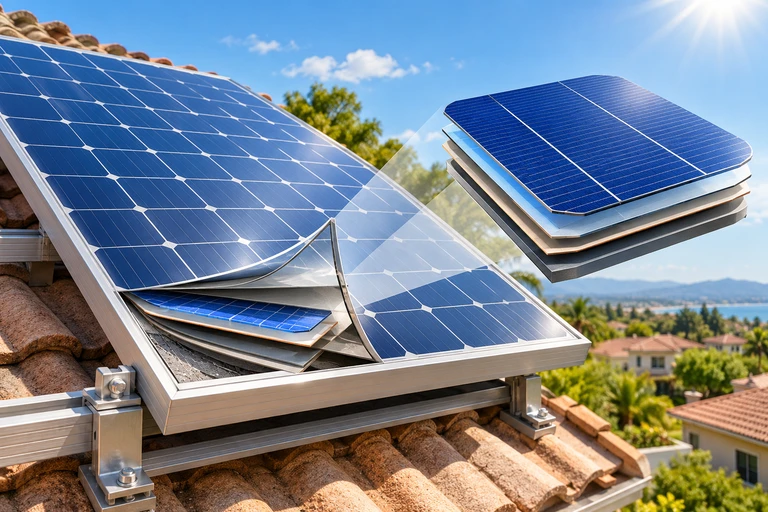
In the diagram above, sunlight photons carry energy that, upon striking the N-type silicon, frees electrons from their atomic lattice positions. The p-n junction is the critical boundary where N-type (phosphorus-doped, electron-rich) and P-type (boron-doped, hole-rich) silicon meet. An internal electric field at this junction sweeps freed electrons toward the external circuit, creating a unidirectional flow of direct current (DC). This DC is then fed through an inverter to produce alternating current (AC) compatible with the electrical grid. The efficiency of this process—typically 15–22% for commercial monocrystalline panels—depends on the semiconductor's band gap, surface reflectivity, temperature, and the spectrum of incoming light.
 Illumination generates charge carriers in a photovoltaic cell, and collection competes with recombination. Fixed ion charge lies in the depletion region while the bulk n and p regions remain neutral. Electron flow and conventional current point in opposite directions.
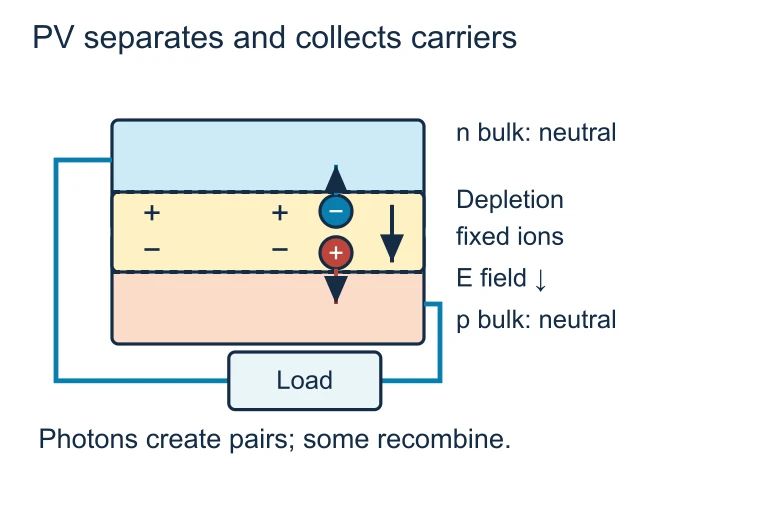 Illumination generates charge carriers in a photovoltaic cell, and collection competes with recombination. Fixed ion charge lies in the depletion region while the bulk n and p regions remain neutral. Electron flow and conventional current point in opposite directions.
SECTION 4
Mathematical Framework
AP Environmental Science problems involving solar energy typically require students to calculate annual energy output, determine how many panels are needed to meet a given demand, or compare the energy return of solar to fossil-fuel alternatives. The equations below form the essential quantitative toolkit.
ANNUAL ENERGY OUTPUT
E = annual energy output (kWh/year); A = total panel area (m²); I = average daily insolation (kWh/m²/day); η = panel efficiency (decimal); 365 = days per year.
NUMBER OF PANELS REQUIRED
N = number of panels; Edemand = annual energy demand (kWh/year); Ppanel = rated power per panel (kW); CF = capacity factor (decimal); 8,760 = hours per year.
CAPACITY FACTOR
Capacity factor expresses how much of a system's theoretical maximum output is actually realized, accounting for nighttime, clouds, and maintenance downtime. Solar PV systems typically have CF values of 0.15–0.25.
AP Exam Tip
SECTION 5
Types of Solar Energy Systems
Solar energy technologies fall into two broad categories—photovoltaic and thermal—each with distinct sub-types suited to different scales and applications. Understanding these distinctions is essential for AP APES questions that ask you to evaluate the most appropriate technology for a given scenario.
As shown in the classification tree, concentrated solar power (CSP) systems use mirrors or lenses to focus sunlight onto a receiver, heating a fluid (often molten salt) to temperatures exceeding 500°C. The heated fluid drives a steam turbine in a conventional Rankine cycle, and excess thermal energy can be stored in insulated tanks for several hours, providing dispatchable power after sunset. This thermal storage capability distinguishes CSP from photovoltaic systems, which require battery storage to deliver electricity after dark. In contrast, passive solar design involves no mechanical or electrical components at all; buildings are oriented and constructed to maximize solar heat gain in winter and minimize it in summer using features such as south-facing windows (in the Northern Hemisphere), thermal mass walls, and overhanging eaves.
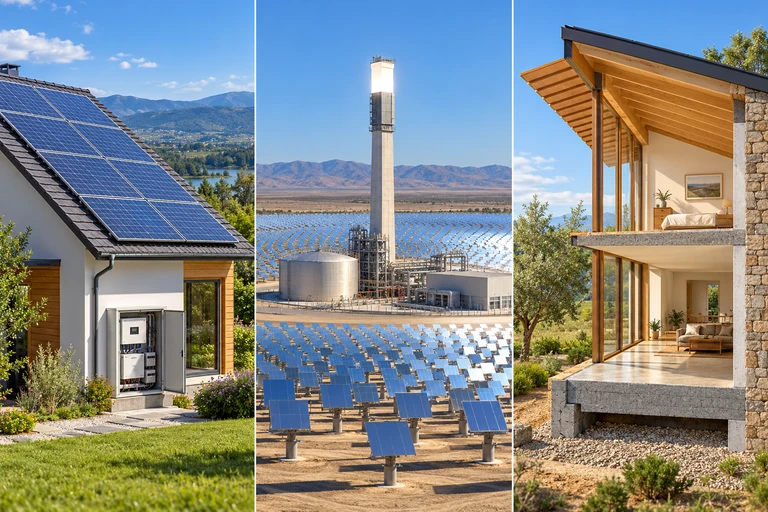 Photovoltaics convert light to electricity; solar thermal systems transfer heat; passive designs use building geometry and materials. Concentrated solar power can keep its heat-transfer fluid separate from its steam circuit.
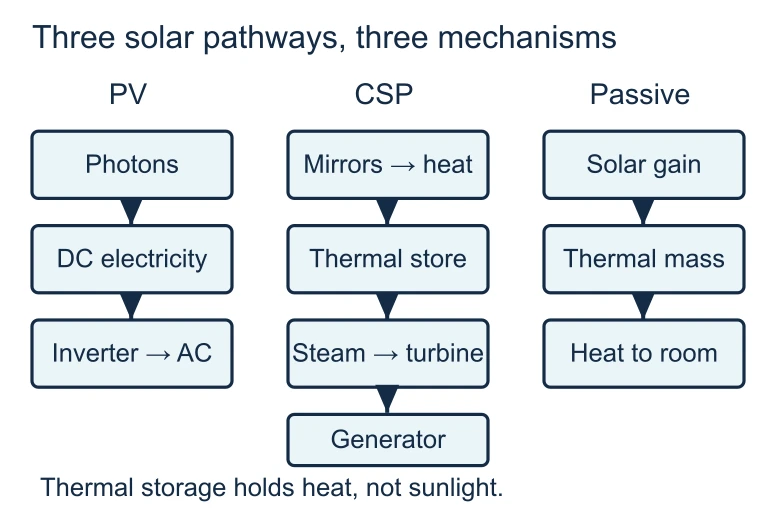 Photovoltaics convert light to electricity; solar thermal systems transfer heat; passive designs use building geometry and materials. Concentrated solar power can keep its heat-transfer fluid separate from its steam circuit.
SECTION 6
Worked Example: Sizing a Rooftop Solar Array
A household in Phoenix, Arizona, consumes 10,000 kWh of electricity per year. The average daily insolation in Phoenix is 6.5 kWh/m²/day. Each solar panel is 1.7 m² with an efficiency of 20%. How many panels are needed to meet the household's annual demand?
Rooftop Solar Sizing Calculation
- 1
Step 1 — Identify Given Values
Annual demand (Edemand) = 10,000 kWh/year. Insolation (I) = 6.5 kWh/m²/day. Panel area (Apanel) = 1.7 m². Efficiency (η) = 0.20. - 2
Step 2 — Calculate Annual Energy per Panel
Using E = A × I × η × 365: Epanel = 1.7 m² × 6.5 kWh/m²/day × 0.20 × 365 days/year.Epanel = 1.7 × 6.5 × 0.20 × 365 = 806.65 kWh/year per panel - 3
Step 3 — Calculate Number of Panels
N = Edemand / Epanel = 10,000 / 806.65 = 12.4.Since you cannot install a fraction of a panel, round up to 13 panels. - 4
Step 4 — Verify Total Area
Total roof area required = 13 × 1.7 m² = 22.1 m² (approximately 238 ft²), a feasible rooftop footprint for a typical single-family home.
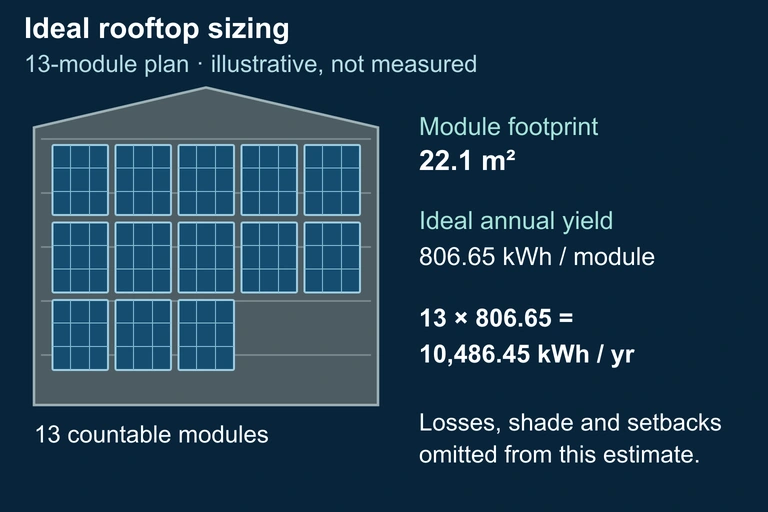 The idealized sizing example yields 806.65 kWh per module annually and requires 13 modules to exceed 10,000 kWh. Their 22.1 m² footprint excludes spacing and setbacks, and the estimate omits system losses and shade. It does not guarantee hourly autonomy.
SECTION 7
Advantages & Limitations of Solar Energy
| Advantages | Limitations |
|---|---|
| Renewable and virtually inexhaustible fuel source (sunlight) | Intermittent—no generation at night; reduced output on cloudy days |
| No direct greenhouse gas emissions during operation | Manufacturing panels requires energy, mining of silicon, and rare metals (e.g., cadmium, tellurium) |
| Scalable from small rooftop systems to multi-gigawatt farms | Large land footprint for utility-scale installations; habitat disruption |
| Low operating and maintenance costs once installed | High upfront capital cost; energy storage (batteries) adds expense |
| Reduces dependence on imported fossil fuels, enhancing energy security | Panel disposal and recycling infrastructure still developing; potential e-waste concerns |
Summary of environmental and economic trade-offs of solar energy
KEY TAKEAWAY
SECTION 8
Solar Energy in the Broader Energy Landscape
Solar energy does not exist in isolation; it is one component of a complex energy system that must balance reliability, cost, and environmental impact. Comparing solar with other renewable and non-renewable sources helps contextualize its role in the ongoing energy transition.
| Attribute | Solar PV | Wind | Natural Gas |
|---|---|---|---|
| Capacity Factor | 15–25% | 25–45% | 40–60% |
| CO₂ Emissions (g/kWh) | 20–50 (lifecycle) | 7–15 (lifecycle) | 400–500 (combustion) |
| Land Use (acres/GWh/yr) | 3–5 | 1–2 (direct) | <1 |
| Dispatchability | No (needs storage) | No (needs storage) | Yes (on demand) |
| Water Use | Minimal (panel washing) | None | High (cooling) |
Comparison of solar PV with wind and natural gas across key environmental metrics
Looking forward, emerging technologies promise to push solar energy beyond its current constraints. Perovskite solar cells are laboratory-stage devices that could dramatically lower manufacturing costs while achieving efficiencies rivaling silicon. Agrivoltaics—the co-location of solar panels and agricultural crops—addresses land-use competition by allowing simultaneous food production and electricity generation. Grid-scale battery storage using lithium-ion and emerging iron-air chemistries is steadily reducing the cost of storing solar electricity for nighttime dispatch. These developments suggest that while solar energy's share of global electricity generation was roughly 5% in the early 2020s, it is poised for continued rapid expansion as the technology matures and costs continue to fall.
SECTION 9
Practice Problems
Question 1: CONCEPTUAL
- A. The panels have a conversion efficiency below 100%, so they cannot reach full power.
- B. The inverter that converts DC to AC introduces energy losses that lower capacity factor.
- C. The panels cannot produce electricity at night and receive variable sunlight during the day due to clouds and sun angle.
- D. Net metering policies limit the amount of electricity the panels can send to the grid.
Show answer (C)
Question 2: BASIC CALCULATION
- A. 180 kWh/year
- B. 657 kWh/year
- C. 1,825 kWh/year
- D. 3,650 kWh/year
Show answer (B)
Question 3: INTERMEDIATE
- A. 125,000 panels
- B. 250,000 panels
- C. 625,000 panels
- D. 312,500 panels
Show answer (D)
Question 4: APPLIED
4 ptsShow answer
Question 5: CRITICAL THINKING
5 ptsShow answer
SUMMARY
Solar Energy — Summary
Summary
Solar energy harnesses the Sun's radiant output through two primary pathways: photovoltaic (PV) cells that convert photons directly into electricity via the photovoltaic effect at a p-n junction, and solar thermal systems (including concentrated solar power) that convert sunlight into heat to drive turbines or directly warm fluids. The key quantitative relationship is E = A × I × η × 365, linking panel area, insolation, and efficiency to annual energy output.
Solar energy is renewable, produces no direct greenhouse gas emissions during operation, and has rapidly declining costs, but it is intermittent, requires significant land area at utility scale, and depends on energy storage or grid integration to provide reliable power. The capacity factor (typically 15–25% for PV) captures the gap between rated and actual output. For the AP exam, be prepared to perform sizing calculations, compare solar with other energy sources, and evaluate environmental trade-offs including lifecycle emissions, land-use impacts, and e-waste from panel disposal.