

SECTION 1
Historical Context & Motivation
Soil is arguably the most underappreciated natural resource on the planet, yet civilizations have risen and fallen based on their ability to maintain it. For most of human history, soil was treated as an inexhaustible substrate for agriculture, and its formation processes remained poorly understood. It was not until the late nineteenth century that scientists began systematically studying pedogenesis—the process of soil formation—and recognized that soil is a dynamic, living system shaped by interacting geological, climatic, and biological forces. The catastrophic Dust Bowl of the 1930s in the American Great Plains provided a stark, real-world demonstration that soil loss can devastate entire economies and ecosystems, galvanizing the modern soil conservation movement.
1883 • Dokuchaev's Soil Science
1935 • Soil Conservation Service Founded
1941 • Hans Jenny's State Factor Equation
1965 • Universal Soil Loss Equation (USLE)
2015 • International Year of Soils
This historical trajectory raises a central question for environmental science: how do the slow, constructive processes of soil formation interact with the far more rapid destructive forces of erosion, and what role does human land use play in tipping that balance? Understanding the answer is essential for managing agricultural sustainability, watershed health, and global biogeochemical cycles.
SECTION 2
Core Principles of Soil Formation
Soil formation is governed by five interdependent factors commonly remembered by the acronym CLORPT: climate, living organisms, relief (topography), parent material, and time. These factors do not act in isolation; rather, they interact synergistically to determine the rate of pedogenesis and the resulting soil profile characteristics. Climate drives the intensity of weathering and decomposition, organisms contribute organic matter and bioturbation, relief controls drainage and erosion exposure, parent material provides the mineral substrate, and time dictates how far the process has progressed toward a mature soil.
Climate (Cl)
Organisms (O)
Relief / Topography (R)
Parent Material (P)
Time (T)
KEY TAKEAWAY
 Compare surfaces of different relative ages while holding climate, organisms, relief and parent material similar. Horizon differentiation can change with development, while erosion can remove an A horizon and expose underlying material.
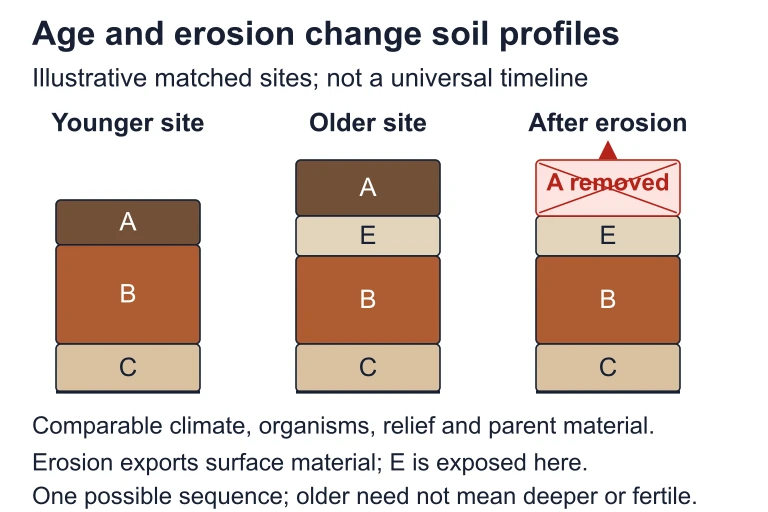 Compare surfaces of different relative ages while holding climate, organisms, relief and parent material similar. Horizon differentiation can change with development, while erosion can remove an A horizon and expose underlying material.
SECTION 3
Visual Explanation — The Soil Profile
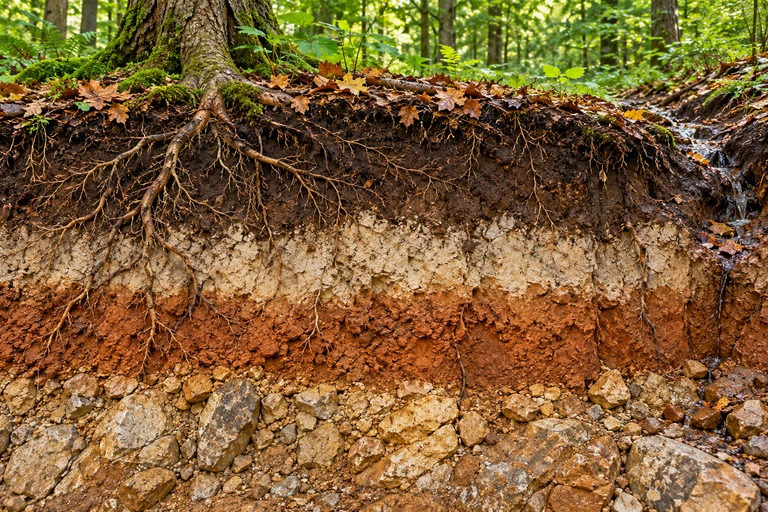
A mature soil can be divided into distinct horizontal layers called horizons, each with characteristic color, texture, and chemical composition. The classic sequence from the surface downward is O–A–E–B–C–R: organic litter at the top, weathered mineral layers in the middle, and unweathered parent material and bedrock at the base. The diagram below illustrates these horizons and the key processes that link them, including eluviation (leaching of materials downward from upper horizons) and illuviation (accumulation of those materials in lower horizons).
The O horizon consists primarily of decomposing plant litter and humus, providing the organic carbon that fuels microbial activity. Below it, the A horizon (topsoil) is the zone of maximum biological activity and contains a mixture of mineral particles and organic matter. The E horizon is characteristically pale because percolating water has leached iron, aluminum, and clay particles from it. These leached materials accumulate in the B horizon (subsoil), which often has a reddish or orange tint from iron oxide deposits. The C horizon consists of partially weathered parent material, and below it lies the R horizon—solid, unweathered bedrock. Not every soil contains all six horizons; young or frequently disturbed soils may lack E or B horizons entirely.
SECTION 4
Mathematical Framework — Quantifying Erosion
While soil formation is difficult to express in a single predictive equation (Jenny's state factor model is qualitative), soil erosion has been quantified with remarkable precision. The Universal Soil Loss Equation (USLE) estimates the average annual soil loss from a plot of land due to sheet and rill erosion. It is the most commonly tested erosion equation on the AP Environmental Science exam and serves as the foundation for modern conservation planning.
UNIVERSAL SOIL LOSS EQUATION (USLE)
A = estimated average annual soil loss (tons per acre per year) • R = rainfall-runoff erosivity factor • K = soil erodibility factor • LS = slope length and steepness factor • C = crop/cover management factor • P = conservation practice factor
The R factor reflects the erosive power of rainfall—regions with frequent, intense storms have higher R values. The K factor quantifies a soil's inherent susceptibility to detachment and transport; silty soils with low organic matter tend to have the highest K values (around 0.4–0.6), while sandy or clay-rich soils are more resistant. The LS factor accounts for the combined effect of slope length and steepness—longer, steeper slopes generate more runoff velocity and erosive force. The C factor ranges from near 0 (dense forest cover, minimal disturbance) to 1.0 (bare, freshly tilled soil with no cover), and the P factor reflects the effectiveness of conservation practices such as contour plowing (P ≈ 0.5) or terracing (P ≈ 0.1) relative to straight-row farming (P = 1.0). Reducing any single factor reduces the overall annual soil loss proportionally.
JENNY'S STATE FACTOR MODEL (QUALITATIVE)
Soil properties (S) are a function of Climate (Cl), Organisms (O), Relief (R), Parent material (P), Time (T), and other unspecified factors. This model is conceptual rather than computational but guides hypothesis-driven research in pedology.
AP EXAM TIP
SECTION 5
Types of Soil Erosion
Soil erosion occurs through several distinct mechanisms, each driven by different agents—water, wind, gravity, or ice. The AP Environmental Science curriculum emphasizes water erosion and wind erosion as the two dominant processes globally, but understanding the full spectrum of erosion types deepens your ability to analyze site-specific environmental problems. The diagram below categorizes the major erosion types, ordered by the spatial scale at which they typically operate.
Water erosion begins at the smallest scale with splash erosion, in which individual raindrops dislodge soil particles upon impact. When thin films of water flow across the surface without channelizing, they produce sheet erosion—a subtle but cumulatively significant process that removes entire layers uniformly. As water concentrates into small channels, rill erosion carves finger-width grooves that can be smoothed by tillage. If unchecked, rills deepen into gullies—channels too deep to be filled by normal farming equipment—representing a severe and often irreversible form of land degradation. Wind erosion dominates in arid and semiarid regions where vegetation cover is sparse, transporting fine particles through saltation, suspension, and surface creep. Mass wasting events, including landslides and slumps, are gravity-driven and often triggered by excessive soil saturation on steep slopes.
 Splash, sheet flow, rills and gullies describe different forms of water erosion. Wind creep, saltation and suspension differ in how particles move.
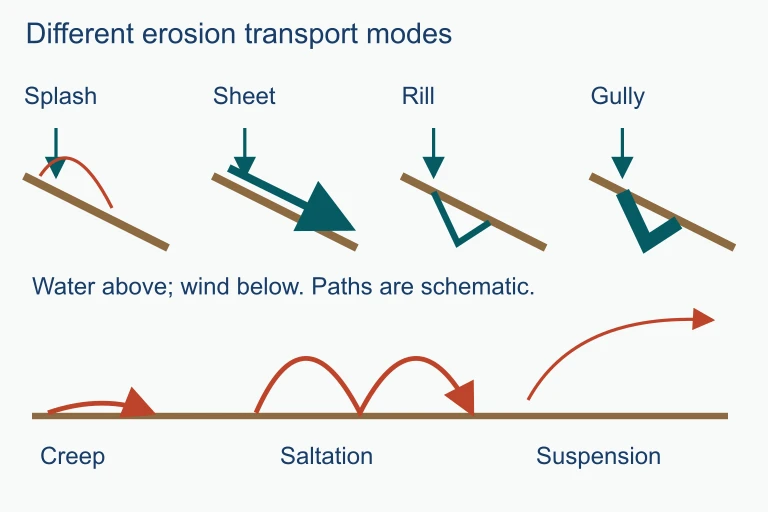 Splash, sheet flow, rills and gullies describe different forms of water erosion. Wind creep, saltation and suspension differ in how particles move.
SECTION 6
Worked Example — Using the USLE
A farmer in the southeastern United States wants to estimate the annual soil loss from a 10-acre field. A soil scientist provides the following USLE factor values: R = 250, K = 0.35, LS = 1.5, C = 0.40 (row-cropped corn, conventional tillage), and P = 1.0 (no conservation practices). The farmer then considers switching to contour plowing (P = 0.50) with a winter cover crop (reducing C to 0.20). Calculate the soil loss before and after implementing these practices.
USLE Calculation: Before and After Conservation
- 1
Step 1 — Identify Given Values (Current Practices)
R = 250, K = 0.35, LS = 1.5, C = 0.40, P = 1.0. These represent a high-rainfall region with moderately erodible soil, a moderate slope, bare-tilled corn, and no conservation practices. - 2
Step 2 — Calculate Current Soil Loss (A₁)
Apply the USLE: A₁ = R × K × LS × C × P = 250 × 0.35 × 1.5 × 0.40 × 1.0 = 250 × 0.35 = 87.5; then 87.5 × 1.5 = 131.25; then 131.25 × 0.40 = 52.5; finally 52.5 × 1.0 = 52.5.A₁ = 52.5 tons per acre per year - 3
Step 3 — Identify Modified Values (Conservation Practices)
R, K, and LS remain unchanged (250, 0.35, 1.5). The farmer implements a winter cover crop, reducing C from 0.40 to 0.20, and switches to contour plowing, reducing P from 1.0 to 0.50. - 4
Step 4 — Calculate New Soil Loss (A₂)
A₂ = 250 × 0.35 × 1.5 × 0.20 × 0.50 = 131.25 × 0.20 = 26.25; then 26.25 × 0.50 = 13.125.A₂ = 13.125 tons per acre per year - 5
Step 5 — Interpret Results
The conservation practices reduced soil loss from 52.5 to 13.125 tons per acre per year, a 75% reduction. Percent reduction = ((52.5 − 13.125) ÷ 52.5) × 100 = 75%. The USDA generally considers soil loss sustainable (equal to formation rate) when A is at or below approximately 5 tons per acre per year, known as the soil loss tolerance (T value). Even with these improvements, the farmer's field still exceeds the T value and would require additional measures such as no-till farming (C ≈ 0.05) or terracing (P ≈ 0.10).75% reduction in annual soil loss — still above the T value of ≈ 5 tons/acre/year
SECTION 7
Conservation Practices — Strengths & Limitations
A variety of soil conservation strategies exist, each targeting different USLE factors. The table below summarizes the most commonly tested practices on the AP Environmental Science exam, including the USLE factor they primarily affect, their mechanism, and their limitations. Understanding these practices in context is essential for both the multiple-choice section and the free-response questions, where you may be asked to propose and justify a conservation plan.
| Practice | USLE Factor Affected | Mechanism | Limitations |
|---|---|---|---|
| Contour plowing | P | Plowing along slope contours creates ridges that slow runoff and increase infiltration | Less effective on slopes >8%; ridges can be broken by heavy storms |
| Terracing | LS, P | Creates flat steps on steep slopes, reducing effective slope length and steepness | Expensive to construct and maintain; may fail if drainage is poor |
| No-till farming | C | Leaves crop residue on the surface, protecting soil from splash erosion and maintaining structure | May increase herbicide dependence for weed control; not suitable for all crop types |
| Cover crops | C | Plants grown between cash crop seasons protect soil surface and add organic matter | Added seed and management costs; may compete with cash crops for water in dry regions |
| Windbreaks / shelterbelts | R (wind analog) | Rows of trees reduce wind speed at ground level, decreasing wind erosion over adjacent fields | Requires land area; trees may compete with crops for water and light near the shelterbelt |
| Strip cropping | C, P | Alternating strips of erosion-resistant crops with row crops; strips intercept runoff and sediment | Complex to manage; requires careful planning of strip width and crop rotation |
Common soil conservation practices and their relationship to USLE factors
KEY TAKEAWAY
SECTION 8
Connections to Advanced Environmental Topics
Soil formation and erosion do not exist in isolation—they intersect with virtually every major theme in environmental science. Understanding these connections is critical for the interdisciplinary reasoning the AP exam demands, particularly in free-response questions that require you to trace cause-and-effect chains across systems. The table below maps soil concepts to their broader environmental implications.
| Soil Concept | Connection to Other AP Topics | Key Mechanism |
|---|---|---|
| Soil organic carbon | Global climate change (Unit 9) | Soils store ~2,500 Gt of carbon—more than the atmosphere and biosphere combined. Erosion and land-use change release this as CO₂. |
| Nutrient runoff from eroded soil | Water pollution & eutrophication (Unit 8) | Eroded topsoil carries adsorbed phosphorus and nitrogen into waterways, fueling algal blooms and hypoxic zones. |
| Soil degradation & desertification | Land & water use (Unit 5) | Overgrazing and deforestation destroy soil structure, reduce infiltration, and convert productive land to desert—a positive feedback loop. |
| Soil biodiversity | Biodiversity (Unit 2) | A single teaspoon of healthy soil contains billions of bacteria, fungi, and invertebrates that drive decomposition, nutrient cycling, and soil structure formation. |
| Soil pH & CEC | Pollution (Unit 8) & Agriculture (Unit 5) | Acid deposition lowers soil pH, releasing toxic aluminum and reducing cation exchange capacity, which impairs plant nutrient uptake. |
Cross-unit connections between soil science and other AP Environmental Science topics
Looking forward, the Revised Universal Soil Loss Equation (RUSLE) and process-based models like WEPP (Water Erosion Prediction Project) are replacing the original USLE in professional practice. These models incorporate climate change projections, detailed hydrology, and spatially variable soil properties to generate more accurate predictions. While these advanced tools are beyond the scope of the AP exam, understanding that the USLE is a simplified, empirical model—not a mechanistic one—helps contextualize its strengths and limitations when you encounter it in research or college-level coursework.
SECTION 9
Practice Problems
Question 1: CONCEPTUAL
- A. Soil X has been exposed to weathering processes for a longer period of time than Soil Y.
- B. Soil Y receives more precipitation than Soil X, leading to increased leaching.
- C. Soil X is located on a steeper slope, which concentrates organic matter deposition.
- D. Soil Y has a higher proportion of sand in its parent material, which promotes faster horizon development.
Show answer (A)
Question 2: BASIC CALCULATION
- A. 6 tons per acre per year
- B. 12 tons per acre per year
- C. 24 tons per acre per year
- D. 60 tons per acre per year
Show answer (B)
Question 3: INTERMEDIATE
- A. Gully erosion → rill erosion → sheet erosion → splash erosion
- B. Splash erosion → sheet erosion → rill erosion → gully erosion
- C. Sheet erosion → splash erosion → gully erosion → rill erosion
- D. Rill erosion → gully erosion → splash erosion → sheet erosion
Show answer (B)
Question 4: APPLIED
4 ptsShow answer
Question 5: CRITICAL THINKING
4 ptsShow answer
SUMMARY
Summary
Summary
Soil is a slowly renewable resource formed through pedogenesis—a process governed by five CLORPT factors (climate, organisms, relief, parent material, and time) that interact to produce distinct soil horizons (O, A, E, B, C, R). The processes of eluviation and illuviation redistribute minerals through the profile, while biological activity drives humification and nutrient cycling. It takes 500 to 1,000 years to form one inch of topsoil, making soil conservation a matter of intergenerational responsibility.
Erosion—driven by water, wind, and gravity—can be quantified using the Universal Soil Loss Equation (A = R × K × LS × C × P), which estimates annual soil loss as a product of rainfall erosivity, soil erodibility, slope characteristics, crop cover, and conservation practices. The progression from splash → sheet → rill → gully erosion represents escalating severity. Human activities—including deforestation, overgrazing, and conventional tillage—dramatically accelerate erosion beyond natural rates, but conservation practices like no-till farming, cover crops, contour plowing, and terracing can reduce soil loss by 75% or more when combined strategically.