

SECTION 1
Historical Context & Motivation
For millennia, civilizations have risen and fallen based on their relationship with soil—the thin veneer of weathered rock and organic material that blankets Earth's land surface. Ancient Mesopotamians irrigated fertile alluvial soils along the Tigris and Euphrates, yet salinization from poor drainage eventually rendered those soils barren, contributing to the decline of Sumerian agriculture. Despite this intimate dependence, the scientific study of soil as a distinct natural body did not emerge until the nineteenth century, when researchers began to view soil not merely as pulverized rock but as a living, layered system shaped by climate, organisms, topography, parent material, and time.
1840 • Liebig's Mineral Theory
1883 • Dokuchaev's Soil Horizons
1930s • U.S. Dust Bowl
1975 • USDA Soil Taxonomy Published
2015 • International Year of Soils
These milestones frame a central question for environmental science: What determines the composition, structure, and fertility of soil, and how do human activities alter these properties? Answering this question requires examining soil as a four-phase system of minerals, organic matter, water, and air—an approach that underpins every AP Environmental Science topic from agriculture to biogeochemical cycling.
SECTION 2
Core Principles & Definitions
Soil is fundamentally a mixture of four components whose proportions govern virtually every property relevant to plant growth, water filtration, and nutrient cycling. An idealized loam soil is approximately 45% mineral particles by volume, 5% organic matter (including humus and living organisms), 25% water, and 25% air. The solid fraction—minerals plus organic matter—creates a matrix of pore spaces that hold the water and air essential for root respiration and microbial activity.
Soil Texture
Soil Structure
Cation Exchange Capacity (CEC)
Soil pH
Porosity & Permeability
 Soil surfaces can reversibly exchange counterions. One adsorbed Ca²⁺ exchanges with two H⁺ while conserving two negative surface sites, one calcium ion and two protons. The dashed surface associations represent electrostatic association.
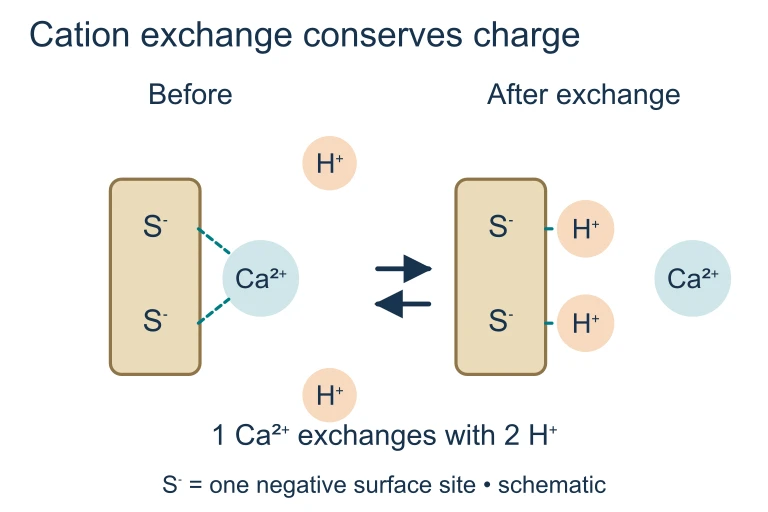 Soil surfaces can reversibly exchange counterions. One adsorbed Ca²⁺ exchanges with two H⁺ while conserving two negative surface sites, one calcium ion and two protons. The dashed surface associations represent electrostatic association.
 The same pore-area fraction can accompany different widths of connecting pore throats. Porosity and permeability therefore measure different properties, and some water held in very small pores is difficult for roots to extract.
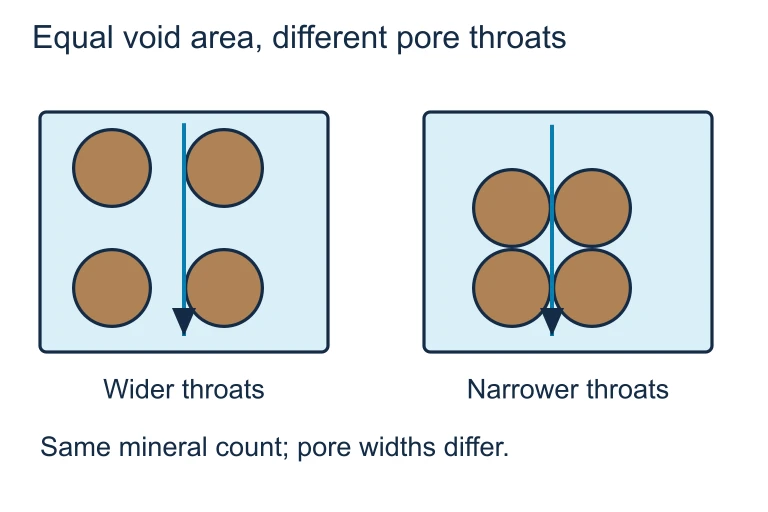 The same pore-area fraction can accompany different widths of connecting pore throats. Porosity and permeability therefore measure different properties, and some water held in very small pores is difficult for roots to extract.
SECTION 3
Soil Composition & Horizon Diagram
The soil profile depicted above illustrates the concept of horizon differentiation—the vertical layering produced by weathering, leaching, and biological activity over time. The O horizon consists primarily of freshly fallen and partially decomposed organic debris. Beneath it, the A horizon (topsoil) is the zone of greatest biological activity where humus mixes with mineral grains. The E horizon experiences eluviation, the downward transport of dissolved or suspended material. These leached substances accumulate in the B horizon (subsoil) through illuviation. The C horizon is partially weathered parent material, and the R horizon is unaltered bedrock. On the AP exam, questions commonly ask students to identify which horizon would be most affected by erosion (A), which accumulates clay (B), or which represents the starting material from which the soil developed (C/R).
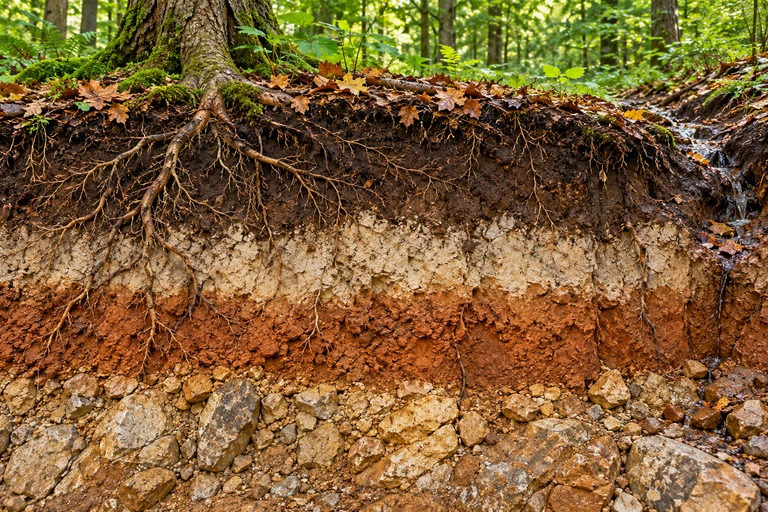 Soil horizons reflect litter inputs, mixing, upper-horizon export and deeper accumulation. Dissolved leaching differs from suspended-clay translocation; profile depth and fertility depend on more than age.
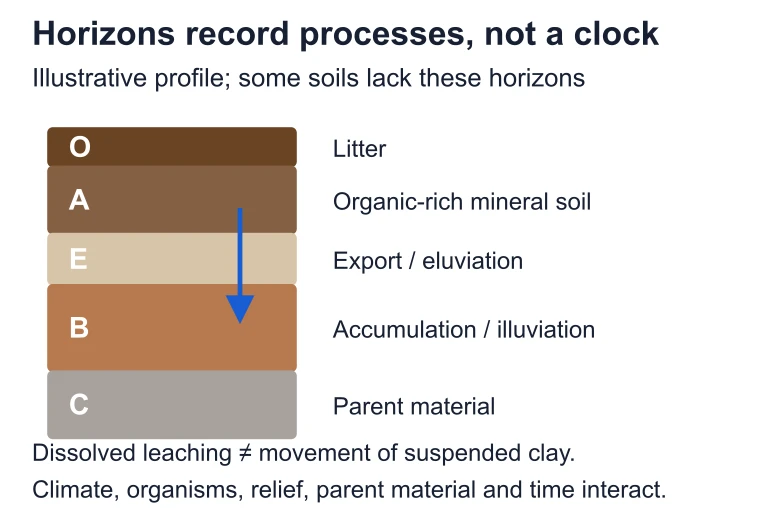 Soil horizons reflect litter inputs, mixing, upper-horizon export and deeper accumulation. Dissolved leaching differs from suspended-clay translocation; profile depth and fertility depend on more than age.
SECTION 4
Soil-Forming Factors & Processes
The Five Soil-Forming Factors (CLOrPT)
Soil scientist Hans Jenny formalized the relationship between soil properties and the factors that control their development using the state-factor equation: S = f(Cl, O, R, P, T), where S is any soil property, Cl is climate, O is organisms (biota), R is relief (topography), P is parent material, and T is time. The mnemonic CLOrPT captures these five factors. Climate—particularly precipitation and temperature—is generally the most influential factor because it drives both the rate of chemical weathering and the type of vegetation present.
JENNY'S STATE-FACTOR EQUATION
S = any measurable soil property (e.g., pH, texture, CEC); Cl = climate (precipitation, temperature); O = organisms (vegetation, microbes, fauna); R = relief/topography; P = parent material; T = time since pedogenesis began.
Four Major Pedogenic Processes
Addition
Loss (Removal)
Translocation
Transformation
These four processes operate simultaneously and at different rates depending on the five state factors. In a tropical environment with heavy rainfall and warm temperatures, transformation (chemical weathering) and loss (leaching) dominate, producing deeply weathered, nutrient-poor oxisols. In grasslands of temperate regions, addition of organic matter from dense root systems and moderate leaching produce the rich, dark mollisols that form the world's most productive agricultural soils.
SECTION 5
Soil Texture Triangle & Classification
Soil texture is determined by performing a particle-size analysis and plotting the percentages of sand, silt, and clay on the USDA soil texture triangle. This ternary diagram divides all possible combinations into twelve textural classes, from pure sand to heavy clay. The textural class governs many soil behaviors: sandy soils drain rapidly and warm quickly in spring but hold few nutrients, while clay-rich soils retain moisture and cations but may become waterlogged and difficult to till.
| Textural Class | Particle Size | Water-Holding Capacity | Permeability | CEC |
|---|---|---|---|---|
| Sand | 0.05–2.0 mm | Low | High | Low |
| Silt | 0.002–0.05 mm | Moderate | Moderate | Moderate |
| Clay | < 0.002 mm | High | Low | High |
| Loam | Mixed | Moderate–High | Moderate | Moderate–High |
Comparison of major textural classes and their properties
SECTION 6
Worked Example: Soil Analysis
Worked example
- 1
Step 1 — Identify Given Values
A soil sample contains 30% sand, 50% silt, and 20% clay by mass. The field has an area of 2 hectares. After a rainfall event, a percolation test yields an infiltration rate of 1.5 cm/hr. - 2
Step 2 — Determine Textural Class
Using the USDA texture triangle: 30% sand, 50% silt, 20% clay places this sample in the silt loam region. Silt loam soils have moderate water-holding capacity and moderate permeability.Textural class: Silt Loam - 3
Step 3 — Calculate Total Water Infiltrated
If a storm delivers 3 cm of rainfall over 2 hours at an infiltration rate of 1.5 cm/hr, the total infiltration capacity over 2 hours is 1.5 cm/hr × 2 hr = 3.0 cm. Since total precipitation (3 cm) equals infiltration capacity (3 cm), all water infiltrates and there is no surface runoff under these idealized conditions.Runoff = 0 cm (all precipitation infiltrates) - 4
Step 4 — Estimate Volume Infiltrated
Volume = depth × area = 0.03 m × 20,000 m² (2 ha) = 600 m³ of water infiltrated into the soil.600 m³ infiltrated - 5
Step 5 — Interpret Environmental Significance
If this same rainfall fell on compacted clay soil with an infiltration rate of 0.5 cm/hr, only 1.0 cm would infiltrate over 2 hours, generating 2.0 cm of runoff (= 400 m³). This illustrates why soil texture and structure directly influence flood risk, erosion, and groundwater recharge.
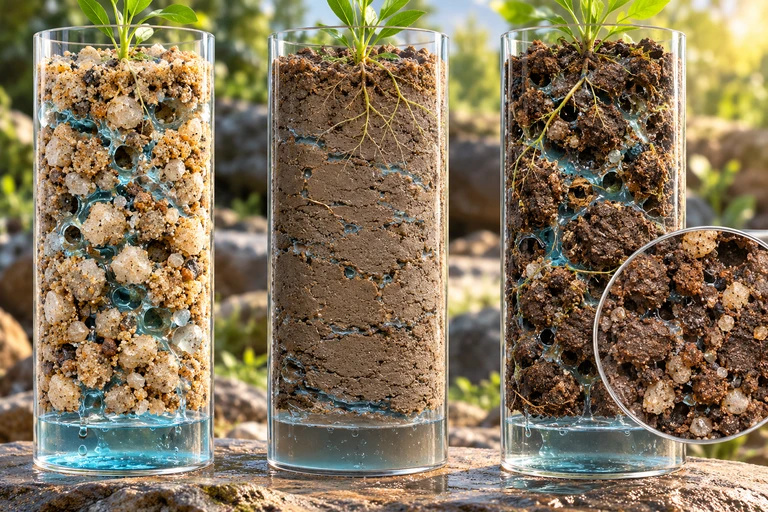
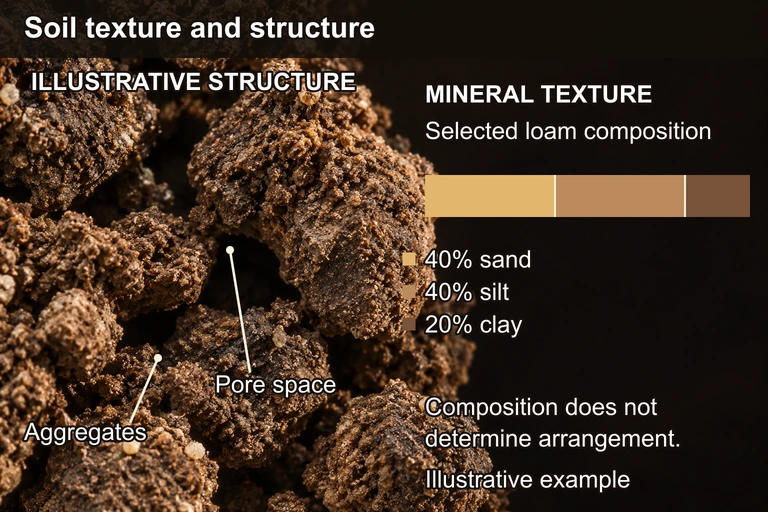 The illustrative mineral fraction contains 40% sand, 40% silt and 20% clay, a loam composition. The bar shows those proportions; the separate aggregate image illustrates clumps and pore spaces. Texture alone does not establish field arrangement or permeability. Separate illustrative sample: 40% sand, 40% silt, 20% clay (loam). The worked example uses 30% sand, 50% silt, 20% clay (silt loam).
SECTION 7
Soil Degradation vs. Conservation
Soil degradation—through erosion, compaction, salinization, nutrient depletion, and contamination—is one of the most pressing environmental challenges of the 21st century. The United Nations estimates that roughly one-third of global soils are moderately to highly degraded. Understanding how soil properties change under different management regimes is essential for the AP Environmental Science exam and for real-world land management.
| Degradation Process | Cause | Conservation Strategy |
|---|---|---|
| Erosion (wind/water) | Removal of vegetation, overgrazing, tillage on slopes | Contour plowing, terracing, cover crops, riparian buffers, no-till farming |
| Compaction | Heavy machinery, livestock trampling | Controlled traffic farming, reduced tillage, organic matter amendments |
| Salinization | Irrigation in arid regions, poor drainage | Drip irrigation, salt-tolerant crops, improved drainage infrastructure |
| Nutrient depletion | Monoculture, excessive harvesting without replenishment | Crop rotation, legume cover crops (nitrogen fixation), composting |
| Acidification | Acid deposition, nitrogen fertilizer overuse | Liming (CaCO₃ application), balanced fertilization |
Common soil degradation processes and conservation strategies
SECTION 8
Connections to Biogeochemical Cycles
Soil is not merely a substrate for plant growth—it is a critical nexus in the global carbon, nitrogen, and phosphorus cycles. The top meter of Earth's soils stores roughly 1,500 gigatons of organic carbon, more than twice the amount present in the atmosphere and all terrestrial vegetation combined. When soil is disturbed through deforestation, tillage, or drainage of wetlands, microbial decomposition accelerates and CO₂ is released, making soil management a significant variable in climate change mitigation.
| Cycle | Role of Soil | Key Processes |
|---|---|---|
| Carbon | Major terrestrial carbon reservoir; stores organic C as humus | Decomposition, humification, root respiration, carbon sequestration |
| Nitrogen | Medium for N transformations; hosts nitrifying and denitrifying bacteria | Nitrogen fixation, ammonification, nitrification, denitrification, leaching |
| Phosphorus | Phosphorus cycles almost entirely through soil-rock interactions (no significant gas phase) | Weathering of apatite, adsorption onto clay/Fe oxides, mycorrhizal uptake |
Soil's role in major biogeochemical cycles
For the AP exam, expect questions linking soil properties to broader environmental outcomes. For instance, a low-CEC sandy soil in a heavily fertilized agricultural setting would be prone to nitrate leaching into groundwater, whereas a high-CEC clay soil retains cations more effectively but may become waterlogged and generate anaerobic conditions that promote denitrification and N₂O emissions—a potent greenhouse gas. Understanding these trade-offs is the hallmark of systems-level thinking in environmental science.
SECTION 9
Practice Problems
Question 1: CONCEPTUAL
- A. O horizon
- B. A horizon
- C. B horizon
- D. C horizon
Show answer (C)
Question 2: BASIC CALCULATION
- A. Sandy loam
- B. Silt loam
- C. Clay loam
- D. Loam
Show answer (A)
Question 3: INTERMEDIATE
- A. Increased infiltration rate reduced microbial habitat
- B. Tillage disrupted soil aggregates, exposing organic matter to accelerated microbial decomposition and oxidation
- C. Corn plants absorb organic matter directly through their roots
- D. Wind erosion preferentially removed mineral particles, concentrating clay
Show answer (B)
Question 4: APPLIED
Show answer
Question 5: CRITICAL THINKING