

SECTION 1
Historical Context & Motivation
Human civilizations have always depended on natural resources for survival, but the scale and type of resource use have shifted dramatically over millennia. For most of human history, societies relied on renewable resources such as wood, wind, and flowing water to meet their energy needs. The transition to nonrenewable resources—particularly fossil fuels—began in earnest during the Industrial Revolution, fundamentally altering the relationship between human societies and the natural environment. This shift enabled unprecedented economic growth, but it also introduced large-scale pollution, habitat destruction, and the release of greenhouse gases that now drive global climate change. Understanding this historical trajectory is essential for evaluating modern energy policy and the ongoing transition toward sustainable energy systems.
~10,000 BCE • Agricultural Revolution
1760s • Industrial Revolution Begins
1859 • First Commercial Oil Well
1970s • Energy Crises & Environmental Awareness
2015–Present • Paris Agreement & Renewable Surge
The central question that this lesson addresses is deceptively simple: How do we classify Earth's resources by their renewability, and what environmental, economic, and social consequences follow from our choices about which resources to exploit? Answering this question requires not only understanding the geologic and ecological processes that create resources, but also evaluating the trade-offs inherent in every energy decision—trade-offs that sit at the heart of the AP Environmental Science curriculum.
SECTION 2
Core Principles & Definitions
At its foundation, the distinction between renewable and nonrenewable resources hinges on the rate at which a resource is replenished relative to the rate at which it is consumed. A renewable resource is one that can be replenished by natural processes on a human timescale—typically within a human lifetime or less—provided it is managed sustainably. Examples include solar radiation, wind, geothermal heat, biomass, and fresh water. A nonrenewable resource forms over geological timescales (millions of years), making it effectively finite on any human planning horizon. Coal, petroleum, natural gas, and nuclear fuels (uranium-235) are the principal nonrenewable energy resources. It is critical to recognize that some renewable resources can become functionally nonrenewable if exploited faster than they regenerate—a concept known as overexploitation or unsustainable harvest.
Replenishment Rate
Stock vs. Flow Resources
Sustainability Threshold
Energy Return on Investment (EROI)
Externalities
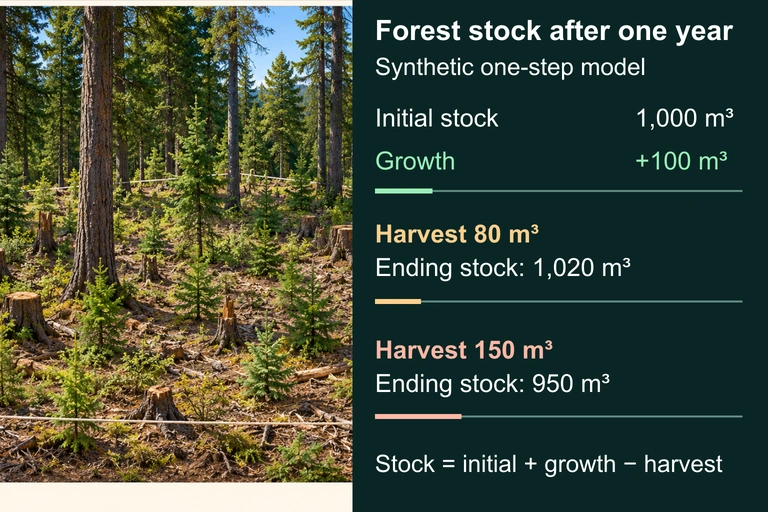 A renewable biological stock can be depleted. Starting with 1,000 m³ and adding 100 m³ of annual growth leaves 1,020 m³ after an 80 m³ harvest or 950 m³ after a 150 m³ harvest. Growth is fixed only for this one-step example.
KEY TAKEAWAY
SECTION 3
Visual Explanation — Resource Classification
As the diagram illustrates, the classification is not a matter of absolute availability but of temporal scale. Solar radiation will continue to bathe the Earth for billions of years, making it effectively inexhaustible on any human planning horizon. Petroleum, by contrast, requires specific geological conditions—the burial and thermal maturation of organic-rich sediments over tens of millions of years—making new formation orders of magnitude slower than current extraction rates. A critical nuance for the AP exam is that biomass and fresh water occupy a conditional zone: they are renewable only when managed sustainably. Deforestation that outpaces regrowth or aquifer drawdown that exceeds recharge effectively converts a renewable resource into a depleting stock.
SECTION 4
How Resources Form & How Energy Is Quantified
Formation of Fossil Fuels
Fossil fuels originate from ancient organic matter—primarily marine phytoplankton for oil and natural gas, and terrestrial plant material for coal—that accumulated in anoxic (oxygen-poor) environments where decomposition was incomplete. Over millions of years, burial under successive sediment layers subjects the organic material to increasing temperature and pressure in a process called diagenesis and, at greater depths, catagenesis. During catagenesis, kerogen (solid organic precursor) thermally cracks into liquid hydrocarbons (petroleum) and gaseous hydrocarbons (natural gas) within a temperature window known as the oil window (roughly 60–160 °C). Coal forms through a separate pathway in which peat from swamp forests undergoes progressive carbonization—from lignite to bituminous coal to anthracite—as burial depth and temperature increase over roughly 300 million years.
Quantifying Energy Resources
ENERGY RETURN ON INVESTMENT
A dimensionless ratio. When EROI = 10:1, ten units of energy are delivered for every one unit spent on extraction, processing, and transport. As a resource depletes, extraction becomes more energy-intensive and EROI declines.
RESERVES-TO-PRODUCTION RATIO
R/P yields the number of years a resource will last at the current rate of extraction, assuming no new discoveries and constant production. For example, if global proven oil reserves are 1,700 billion barrels and annual production is 35 billion barrels, R/P ≈ 49 years.
CAPACITY FACTOR
Capacity factor is crucial for comparing renewable sources. A wind farm with a 35% capacity factor generates only 35% of what it would produce if the turbines ran at full nameplate capacity 24/7. Nuclear plants typically have CF ≈ 90%, while solar PV averages 20–25%.
AP EXAM TIP
SECTION 5
Global Energy Mix & Resource Comparison
Despite rapid growth in renewable capacity, fossil fuels still supply approximately 80% of global primary energy. Understanding the composition of the global energy mix is essential for interpreting trends in carbon emissions, evaluating policy proposals, and answering data-based AP exam questions. The spectrum bar below illustrates the approximate breakdown of global primary energy consumption.
Global Primary Energy Consumption by Source (approx. 2023)
| Resource | Type | EROI (approx.) | CO₂ (g/kWh) | Capacity Factor (%) |
|---|---|---|---|---|
| Coal | Nonrenewable | 30:1 (declining) | 820–1,100 | 70–85 |
| Petroleum | Nonrenewable | 15–20:1 | 720–890 | 50–60 (thermal) |
| Natural Gas | Nonrenewable | 10–20:1 | 410–490 | 40–60 |
| Nuclear (U-235) | Nonrenewable | 75:1 | 12–16 | ~90 |
| Wind | Renewable | 18–25:1 | 7–15 | 25–45 |
| Solar PV | Renewable | 10–15:1 | 20–50 | 15–25 |
| Hydroelectric | Renewable | 40–100:1 | 4–24 | 30–55 |
Comparison of key metrics for major energy resources.
SECTION 6
Worked Example — Reserves-to-Production Analysis
Consider a typical AP exam scenario: a country has proven coal reserves of 250 billion metric tons and currently mines 5 billion metric tons per year. A proposed policy would increase annual production by 3% per year to fuel industrialization. Determine (a) the simple R/P ratio and (b) the approximate number of years until depletion under the growth scenario.
Coal Reserves-to-Production with Growth
- 1
Step 1 — Identify Given Values
Proven reserves (R) = 250 × 10⁹ metric tons. Current annual production (P₀) = 5 × 10⁹ metric tons/year. Annual growth rate (r) = 3% = 0.03. - 2
Step 2 — Calculate Simple R/P Ratio
R/P = 250 × 10⁹ ÷ 5 × 10⁹ = 50 years. At constant production, the reserves would last 50 years.Simple R/P = 50 years - 3
Step 3 — Apply Exponential Growth Formula
With exponentially growing production, total cumulative extraction over T years equals the integral: ∫₀ᵀ P₀ × dt = (P₀/r) × ( − 1). Set this equal to R and solve for T: R = (P₀/r) × ( − 1). Rearranging: = (R × r/P₀) + 1. - 4
Step 4 — Substitute and Solve
= (250 × 10⁹ × 0.03 ÷ 5 × 10⁹) + 1 = (7.5 × 10⁹ ÷ 5 × 10⁹) + 1 = 1.5 + 1 = 2.5. Taking the natural logarithm: 0.03 × T = ln(2.5) ≈ 0.916. Therefore T ≈ 0.916 ÷ 0.03 ≈ 30.5 years.With 3% annual growth, reserves last ≈ 31 years - 5
Step 5 — Interpret the Result
A 3% annual growth rate in coal production nearly halves the effective lifetime of the resource—from 50 years to approximately 31 years. This illustrates the powerful effect of exponential growth on resource depletion, a concept the AP exam often tests in the context of fossil fuel policy decisions.
SECTION 7
Trade-offs — Renewable vs. Nonrenewable
No energy resource is without trade-offs, and the AP exam expects students to evaluate advantages and disadvantages critically rather than treating renewables as universally superior or fossil fuels as universally harmful. Each resource involves environmental, economic, and social considerations that shift depending on geographic context, technological maturity, and policy frameworks.
| Criterion | Renewable Resources | Nonrenewable Resources |
|---|---|---|
| Supply Duration | Effectively inexhaustible if managed sustainably; flow resources | Finite stock; depletes with extraction; R/P ratios shrink over time |
| CO₂ Emissions | Very low lifecycle emissions (4–50 g CO₂/kWh for wind, solar, hydro) | High emissions (410–1,100 g CO₂/kWh); primary driver of climate change |
| Reliability / Baseload | Intermittent (solar, wind depend on weather); requires storage or grid flexibility | Dispatchable on demand; coal and gas plants provide reliable baseload and peak power |
| Land Use | Large footprint per kWh (solar farms, wind farms, reservoirs for hydro) | Smaller generation footprint but significant extraction impacts (mining, drilling, fracking) |
| Upfront vs. Operating Cost | High capital cost; near-zero fuel cost; declining LCOE with technology improvements | Lower capital cost (for existing plants); ongoing fuel costs subject to price volatility |
| Environmental Externalities | Habitat disruption (dams, wind turbines); mining for rare-earth minerals; e-waste from solar panels | Air/water pollution; acid mine drainage; oil spills; methane leaks; radioactive waste (nuclear) |
Comparative trade-offs between renewable and nonrenewable energy resources.
KEY TAKEAWAY
SECTION 8
Connections to Climate Change & Policy
The distinction between renewable and nonrenewable resources connects directly to two of the most consequential topics in AP Environmental Science: anthropogenic climate change and environmental policy. Combustion of fossil fuels is responsible for approximately 73% of global greenhouse gas emissions, making the energy sector the single largest contributor to the enhanced greenhouse effect. Policy tools such as carbon taxes, cap-and-trade systems, renewable portfolio standards, and feed-in tariffs all aim to internalize the externalities of fossil fuel use and accelerate the adoption of renewables. Understanding resource classification therefore provides the foundation for analyzing climate mitigation strategies, a frequent focus of AP exam free-response questions.
| Concept | Foundational (This Lesson) | Advanced Connection |
|---|---|---|
| Resource Classification | Renewable vs. nonrenewable based on replenishment rate | Ecological footprint analysis; planetary boundaries framework |
| EROI & R/P Ratios | Quantifying energy efficiency and reserve lifetime | Hubbert peak theory; net energy cliff analysis |
| Externalities | Environmental costs not in market price (e.g., CO₂ from coal) | Social cost of carbon; integrated assessment models (IAMs) |
| Capacity Factor | Ratio of actual to maximum output | Grid-scale energy storage; smart grid optimization |
| Sustainability Threshold | Harvest rate vs. regeneration rate | Maximum sustainable yield (MSY) in fisheries; water budget models |
How foundational concepts connect to advanced AP Environmental Science topics.
Looking forward, the global energy transition will increasingly blur the clean line between renewable and nonrenewable categories. Technologies such as nuclear fusion (if commercialized), enhanced geothermal systems, and green hydrogen produced from renewable electricity promise to reshape the energy landscape. The analytical framework you develop in this lesson—comparing EROI, emissions, capacity factor, and externalities—will remain the essential toolkit for evaluating these emerging technologies, regardless of how the resource mix evolves.
SECTION 9
Practice Problems
Question 1: CONCEPTUAL
- A. Groundwater is always classified as nonrenewable because it exists underground.
- B. The recharge rate of the aquifer is significantly slower than the rate of human withdrawal, making the resource functionally finite.
- C. Deep aquifers contain fossil water that is chemically distinct from surface water and therefore cannot be renewed by precipitation.
- D. Government regulations classify deep aquifer water as nonrenewable for permitting purposes.
Show answer (B)
Question 2: BASIC CALCULATION
- A. 18 years
- B. 30 years
- C. 36 years
- D. 60 years
Show answer (B)
Question 3: INTERMEDIATE
- A. 264 MW
- B. 344 MW
- C. 400 MW
- D. 625 MW
Show answer (B)
Question 4: APPLIED
4 ptsShow answer
Question 5: CRITICAL THINKING
4 ptsShow answer
SUMMARY
Lesson Summary
Summary
Natural resources are classified by their rate of replenishment relative to the rate of human consumption. Renewable resources—including solar, wind, hydroelectric, biomass, and geothermal energy—are replenished on human timescales and function as flow resources, provided they are managed sustainably (harvest rate ≤ regeneration rate). Nonrenewable resources—coal, petroleum, natural gas, and uranium—are stock resources that formed over geological timescales and are effectively finite. Key quantitative tools include EROI (energy delivered ÷ energy invested), the reserves-to-production ratio (proven reserves ÷ annual production), and capacity factor (actual output ÷ maximum possible output).
Fossil fuels still dominate the global energy mix at roughly 80%, but their combustion produces substantial CO₂ emissions and environmental externalities. Renewables offer dramatically lower lifecycle emissions but face challenges of intermittency, land use, and energy storage. The AP Environmental Science exam tests your ability to classify resources, perform R/P and capacity factor calculations, evaluate trade-offs between energy sources, and connect resource decisions to broader issues of climate change and environmental policy. Master these concepts and you will be well-prepared to analyze any energy scenario the exam presents.