AP Environmental Science • Atmospheric Pollution

Reduction of Air Pollutants

Exploring the regulatory frameworks, technologies, and strategies that mitigate harmful emissions and improve air quality worldwide.

A sprouting plant framed by Earth and recycling symbols.
Inside this lesson 10 sections 5 questions 8 figures

SECTION 1

Historical Context & Motivation

Air pollution has accompanied industrialization since the widespread burning of coal in the eighteenth century, yet concerted efforts to reduce atmospheric pollutants did not emerge until catastrophic episodes forced governments to act. London's infamous Great Smog of 1952 killed an estimated 4,000 people in a single week, demonstrating that unregulated industrial and domestic emissions could create lethal public-health crises. In the United States, similar events—such as the 1948 Donora, Pennsylvania smog disaster—galvanized public pressure for federal intervention. These tragedies underscored a fundamental truth: the atmosphere is a shared commons, and protecting it requires coordinated policy and technological innovation. Understanding this historical trajectory is essential for the AP Environmental Science exam, where questions frequently connect legislative milestones to measurable improvements in air quality.

1952 • London's Great Smog

A thick smog blankets London for five days, killing thousands and prompting the United Kingdom to pass the Clean Air Act of 1956—one of the world's first modern air-quality laws.

1963 • U.S. Clean Air Act (Original)

The first federal legislation in the U.S. authorizing research into monitoring and controlling air pollution, laying groundwork for enforceable standards.

1970 • Clean Air Act Amendments & EPA Formation

Congress passes sweeping amendments establishing National Ambient Air Quality Standards (NAAQS) for six criteria pollutants, and the Environmental Protection Agency (EPA) is created to enforce them.

1990 • 1990 Clean Air Act Amendments

Title IV introduces a cap-and-trade program for sulfur dioxide to combat acid rain, becoming a landmark market-based approach to pollution control that reduces SO₂ emissions by over 80% in subsequent decades.

2015 • Paris Agreement

Nearly 200 nations commit to limiting global temperature rise, indirectly driving reductions in fossil-fuel combustion and associated criteria pollutants alongside greenhouse gases.

The central question that threads through this history is deceptively simple: How do we systematically reduce the concentration of harmful substances in the atmosphere while sustaining economic activity? Answering it requires an understanding of regulatory tools such as the NAAQS, emission-control technologies like catalytic converters and scrubbers, and economic instruments including cap-and-trade systems—all of which form the core of this lesson.

SECTION 2

Core Principles & Definitions

Reducing air pollutants operates through three interconnected strategies: regulatory standards that set legally enforceable limits, emission-control technologies that physically or chemically remove pollutants before they enter the atmosphere, and economic or market-based instruments that create financial incentives for polluters to reduce their emissions. These strategies target the six criteria pollutants designated by the EPA—carbon monoxide (CO), lead (Pb), nitrogen oxides (NOx), ozone (O3), particulate matter (PM), and sulfur dioxide (SO2)—as well as hazardous air pollutants (HAPs) and greenhouse gases.

1

Criteria Pollutants & NAAQS

The Clean Air Act requires the EPA to set primary standards (protecting human health) and secondary standards (protecting public welfare, e.g., visibility and crops) for six criteria pollutants. Regions that exceed these limits are designated nonattainment areas and must develop State Implementation Plans (SIPs).
2

Emission-Control Technologies

Devices such as catalytic converters, electrostatic precipitators, wet scrubbers, and baghouse filters physically or chemically capture pollutants at the source. These technologies reduce emissions from power plants, factories, and motor vehicles before exhaust enters the atmosphere.
3

Cap-and-Trade & Carbon Pricing

Market-based approaches set an aggregate emission cap and distribute tradable permits. Firms that reduce emissions below their allocation can sell surplus permits, creating economic incentives for cost-effective reductions. The Acid Rain Program under Title IV is a prominent example.
4

Vapor Recovery & Clean Fuels

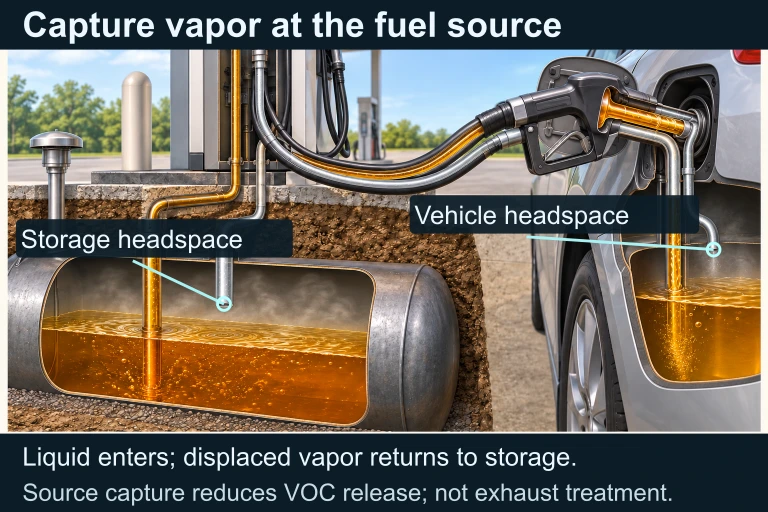
Reducing the volatile organic compound (VOC) content of fuels, requiring vapor-recovery nozzles at gas stations, and mandating reformulated gasoline all decrease precursors of ground-level ozone. The phase-out of leaded gasoline eliminated the primary anthropogenic source of atmospheric lead.
5

International Agreements

Transboundary pollutants require international cooperation. Agreements such as the Montreal Protocol (CFCs and ozone depletion) and the Paris Agreement (greenhouse gases) demonstrate that multilateral treaties can achieve significant pollutant reductions when backed by compliance mechanisms.

A vivid amber fuel and metal equipment cutaway marks two return openings above the liquid surfaces. Its companion has distinct continuous amber liquid and cyan vapor routes, with direction arrows and endpoints in the appropriate phases.A preserved dimensional cutaway identifies both vapor-line openings in tank headspaces. The editable companion independently traces continuous liquid delivery from storage into the vehicle and displaced vapor returning from the vehicle headspace to the storage headspace. This is source capture, separate from exhaust treatment; recovery reduces release without implying perfect capture.
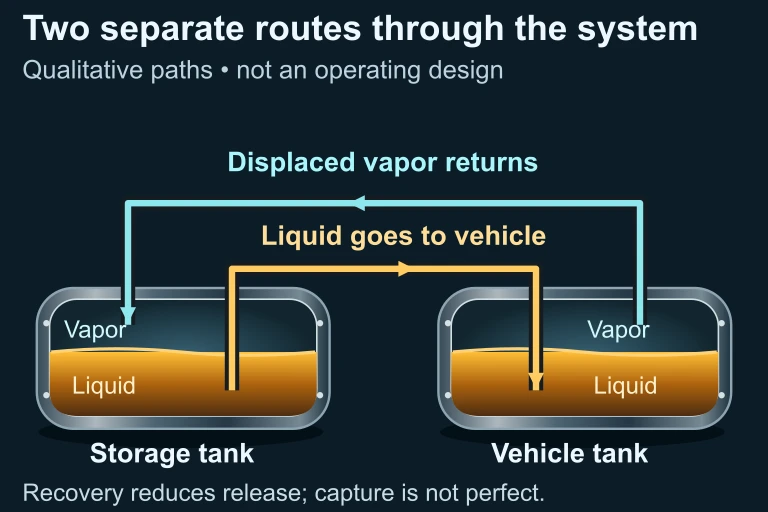
An amber liquid route links openings below the liquid surfaces; a cyan vapor-return route links the headspaces above them.Liquid transfer and vapor return connect different phases and run in opposite directions. This is source capture, not exhaust treatment.

✦

KEY TAKEAWAY

Think of air-pollution control like a three-legged stool: regulation sets the rules, technology provides the tools, and economics creates the motivation. Remove any one leg and the system topples—regulation without technology offers no practical path to compliance, technology without regulation has no incentive for adoption, and economics without a regulatory ceiling leads to marginal rather than transformational change.

SECTION 3

Visual Explanation — Emission-Control Technologies

Emission-Control Technologies: From Source to Clean ExhaustCoal-FiredPower PlantSO₂, NOₓ, PMElectrostaticPrecipitatorCharges particles;removes ~99% PMWet Scrubber(FGD)CaCO₃ slurryneutralizes SO₂Selective CatalyticReduction (SCR)NH₃ + catalystconverts NOₓ → N₂Clean ExhaustVehicle EngineCO, NOₓ, VOCsCatalytic ConverterReduction catalyst: NOₓ → N₂Oxidation catalyst: CO → CO₂Cleaner ExhaustLEGENDPollutant SourcePM ControlSO₂ ControlNOₓ ControlMulti-Pollutant
The upper pathway shows a coal-fired power plant's flue gas passing through an electrostatic precipitator (PM removal), a wet scrubber (SO₂ removal via flue-gas desulfurization), and a selective catalytic reduction system (NOx conversion to N₂). The lower pathway shows a vehicle engine routed through a catalytic converter that simultaneously reduces NOx and oxidizes CO and hydrocarbons.

The diagram above illustrates how multiple technologies are stacked in series to address different pollutants—a concept known as a multi-pollutant control train. Each device targets a specific pollutant or class of pollutants: the electrostatic precipitator ionizes and collects particulate matter on charged plates, the wet scrubber reacts a calcium carbonate (CaCO3) slurry with SO2 to produce calcium sulfate (gypsum), and the selective catalytic reduction unit injects ammonia (NH3) over a catalyst to convert nitrogen oxides into harmless N2 and water. On the vehicular side, a three-way catalytic converter simultaneously reduces NOx and oxidizes CO and unburned hydrocarbons, making it one of the most effective single devices for mobile-source pollution control.
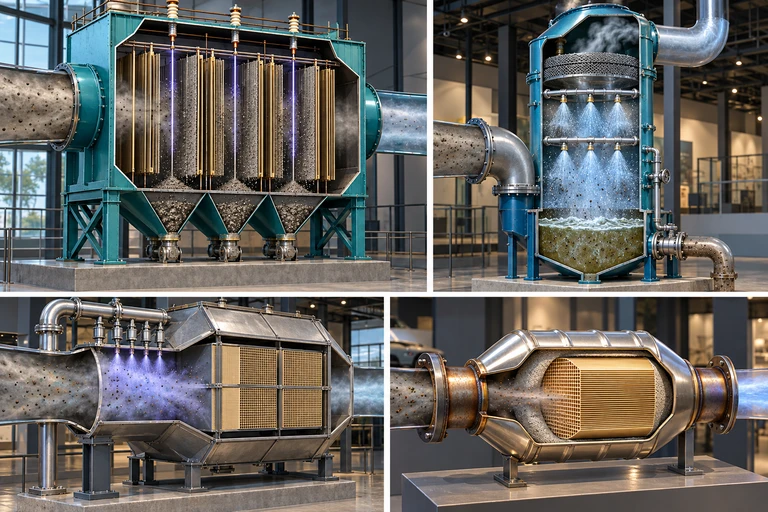
Four industrial cutaways show particle-collection plates,a spray scrubber,a catalyst reactor and a vehicle honeycomb converter.Electrostatic collection transfers particles to collected ash. Alkaline scrubbing transfers sulfur species into a managed liquid or solid waste stream. Different pollutants require different removal mechanisms.
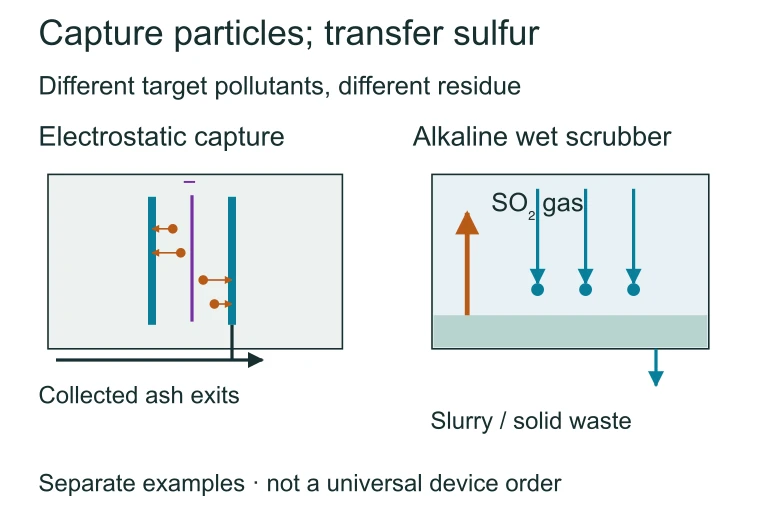
Control devices remove different pollutants through distinct mechanisms. Electrostatic collection transfers particles to collected ash. Alkaline scrubbing transfers sulfur species into a managed liquid or solid waste stream. Different pollutants require different removal mechanisms.Electrostatic collection transfers particles to collected ash. Alkaline scrubbing transfers sulfur species into a managed liquid or solid waste stream. Different pollutants require different removal mechanisms.
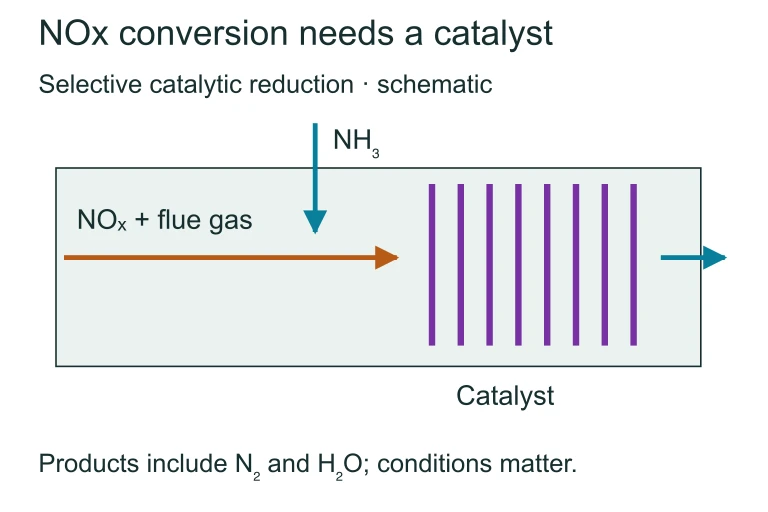
Catalytic NOx reduction. Selective catalytic reduction brings nitrogen oxides into contact with a reducing agent and catalyst. Appropriate operating conditions promote conversion to nitrogen and water.Selective catalytic reduction brings nitrogen oxides into contact with a reducing agent and catalyst. Appropriate operating conditions promote conversion to nitrogen and water.
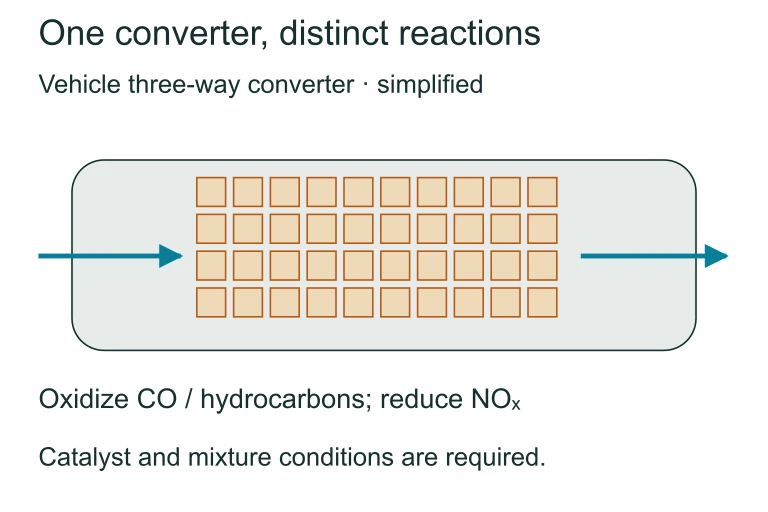
Vehicle catalyst honeycomb. A vehicle catalytic converter promotes oxidation of carbon monoxide and hydrocarbons and reduction of nitrogen oxides. These reactions target different pollutants through different catalytic pathways.A vehicle catalytic converter promotes oxidation of carbon monoxide and hydrocarbons and reduction of nitrogen oxides. These reactions target different pollutants through different catalytic pathways.

SECTION 4

Mechanisms of Pollutant Reduction

While the AP Environmental Science exam does not require detailed chemical derivations, understanding the underlying reactions strengthens your ability to evaluate the effectiveness and byproducts of each control strategy. The key reactions for the three most commonly tested technologies are presented below.

FLUE-GAS DESULFURIZATION (WET SCRUBBER)

CaCO3+SO2→CaSO3+CO2CaCO₃ + SO₂ → CaSO₃ + CO₂

Calcium carbonate (limestone) reacts with sulfur dioxide to form calcium sulfite, which is further oxidized to calcium sulfate (gypsum, CaSO4). The gypsum byproduct can be sold for drywall manufacturing, partially offsetting operating costs.

SELECTIVE CATALYTIC REDUCTION (SCR)

4NO+4NH3+O2→4N2+6H2O4 NO + 4 NH₃ + O₂ → 4 N₂ + 6 H₂O

Ammonia (NH₃) is injected into the flue gas upstream of a catalyst (typically vanadium pentoxide, V2O5) to convert NOx into molecular nitrogen and water—both harmless atmospheric components.

THREE-WAY CATALYTIC CONVERTER

2CO+2NO→2CO2+N22 CO + 2 NO → 2 CO₂ + N₂

In the reduction stage of a three-way catalytic converter, carbon monoxide reduces nitrogen monoxide. The oxidation stage uses a separate catalyst (platinum or palladium) to oxidize remaining CO and unburned hydrocarbons. The net effect is conversion of three pollutants (CO, NOx, VOCs) into CO₂, N₂, and H₂O.

PERCENT REDUCTION IN EMISSIONS

% Reduction = ((E_initial − E_final) / E_initial) × 100

Where Einitial is the emission rate before control technology is applied and Efinal is the emission rate after. This formula is frequently tested on the AP exam, particularly in free-response questions requiring quantitative analysis.

SECTION 5

Regulatory & Economic Strategies

Technology alone cannot drive sufficient pollution reduction without a policy framework that mandates or incentivizes its use. The United States employs two broad categories of regulatory approaches: command-and-control regulations (which prescribe specific emission limits or technologies) and market-based instruments (which use financial signals to encourage reductions where they are cheapest). Understanding the trade-offs between these approaches is essential for the AP exam's analyze-and-propose-solution FRQ.

Regulatory Approaches to Reducing Air PollutantsCOMMAND-AND-CONTROLMARKET-BASEDNAAQS (Ambient Standards)Set maximum allowable concentrations ofcriteria pollutants in outdoor air.New Source Performance StandardsRequire specific emission-control technologyfor new or modified stationary sources.Vehicle Emission StandardsMandate tailpipe limits (e.g., Tier 3) thateffectively require catalytic converters.Technology MandatesRequire installation of Best Available ControlTechnology (BACT) in nonattainment areas.Cap-and-Trade (e.g., Acid Rain Program)Set total emission cap; distribute tradableallowances. Firms trade to find cheapest cuts.Carbon / Emission TaxesPrice per unit of pollutant emitted incentivizesreductions where marginal cost is lowest.Pollution Prevention CreditsFirms earn credits for reducing below theirbaseline; credits sold to other polluters.Subsidies for Clean TechnologyTax credits or grants lower the cost of adoptingrenewable energy and pollution-control equipment.KEY DISTINCTIONCommand-and-control ensures compliance uniformly; market-based approaches achieve the same result at lower overall cost.
This diagram contrasts command-and-control regulations (left) with market-based instruments (right). Both categories aim to reduce emissions, but they differ in flexibility and cost-efficiency.

The Acid Rain Program established under Title IV of the 1990 Clean Air Act Amendments is the textbook example of a successful cap-and-trade system. The program set a declining cap on total SO2 emissions from coal-fired power plants and distributed allowances—one allowance per ton of SO2. Plants that found it cheap to install scrubbers could reduce below their allocation and sell surplus allowances to plants where abatement was more expensive. The result was an overall reduction of more than 80% in SO₂ emissions at roughly half the projected cost of a traditional command-and-control approach. This outcome demonstrates the central advantage of market-based instruments: they achieve environmental targets while minimizing economic burden by directing reductions to where they are least costly.

SECTION 6

Worked Example — Calculating Emission Reductions

The following example mirrors the type of quantitative analysis that frequently appears on the AP Environmental Science free-response section. Practice setting up the percent-reduction formula and interpreting results in context.

SO₂ Emission Reduction at a Coal-Fired Power Plant

  1. 1

    Step 1 — Identify Given Values

    A coal-fired power plant emits 50,000 metric tons of SO2 per year before installing a wet scrubber. After installation, emissions drop to 5,000 metric tons per year. We need to calculate the percent reduction.
    Einitial = 50,000 metric tons/yr; Efinal = 5,000 metric tons/yr
  2. 2

    Step 2 — Apply the Percent Reduction Formula

    % Reduction = ((Einitial − Efinal) / Einitial) × 100 = ((50,000 − 5,000) / 50,000) × 100
  3. 3

    Step 3 — Calculate the Numerator

    50,000 − 5,000 = 45,000 metric tons/yr removed
    45,000 metric tons/yr removed
  4. 4

    Step 4 — Compute the Ratio and Convert to Percent

    (45,000 / 50,000) × 100 = 0.90 × 100 = 90%
    90% reduction in SO₂ emissions
  5. 5

    Step 5 — Interpret in Context

    A 90% reduction is consistent with the performance range of modern wet scrubbers (typically 90–98% removal efficiency for SO2). This level of reduction would help the plant comply with NAAQS and could generate surplus allowances under a cap-and-trade program that the plant could sell for revenue.

SECTION 7

Strengths & Limitations of Control Approaches

No single strategy for reducing air pollutants is universally optimal; each carries trade-offs in cost, flexibility, enforceability, and environmental effectiveness. The AP exam often asks students to evaluate the advantages and disadvantages of different approaches within a given scenario, so internalizing the following comparison is critical.

ApproachStrengthsLimitations
Command-and-Control (NAAQS, standards)Clear, enforceable limits; ensures minimum air quality in all regions; predictable outcomesHigh compliance costs for some firms; no incentive to reduce below the standard; inflexible
Cap-and-TradeCost-effective; incentivizes innovation; total cap guarantees environmental outcomeMay create pollution "hot spots" near low-income communities; requires robust monitoring; market volatility in allowance prices
Emission TaxesContinuous incentive to reduce; revenue for government; simple to administerDoes not guarantee a specific emission level; politically difficult to implement; regressive without rebates
Technology Mandates (e.g., catalytic converters)Universal adoption ensures broad coverage; easy to verify complianceMay lock in current technology; does not encourage exceeding minimum requirements; high upfront costs
Clean-Fuel Substitution (e.g., natural gas, renewables)Eliminates emissions at the source; co-benefits (reduced CO₂); long-term cost savingsHigh infrastructure transition costs; intermittency (solar, wind); natural gas still emits NOx and CH₄

Comparison of major air-pollution reduction approaches

✦

KEY TAKEAWAY

Consider the pollution-control landscape like an engineering optimization problem: the goal is to minimize total abatement cost subject to a constraint (the environmental target). Command-and-control sets the constraint directly but ignores cost variation across firms, while market-based approaches find the minimum-cost solution by allowing trade. The most effective real-world programs, like the Acid Rain Program, combine elements of both.

SECTION 8

Connections to Climate Policy & Emerging Approaches

The strategies developed to control criteria pollutants have become the foundation for addressing greenhouse gas emissions and global climate change—a topic that carries significant weight on the AP Environmental Science exam. The conceptual leap from SO2 cap-and-trade to carbon cap-and-trade is direct, and understanding how the former succeeded helps you evaluate proposals for the latter. Emerging approaches extend beyond traditional end-of-pipe controls toward source elimination—transitioning entire energy systems away from fossil fuels rather than merely cleaning up their exhaust.

FeatureTraditional Pollutant ReductionClimate-Oriented Approaches
Target PollutantsSO₂, NOₓ, PM, CO, Pb, O₃ (criteria pollutants)CO₂, CH₄, N₂O, HFCs (greenhouse gases)
Primary StrategyEnd-of-pipe controls (scrubbers, converters, filters)Energy transition (renewables, electrification, efficiency), carbon capture
ScaleNational (NAAQS, SIPs) or regionalGlobal (Paris Agreement, EU ETS)
Economic MechanismSO₂ cap-and-trade, technology mandatesCarbon taxes, emission trading systems (ETS), subsidies for clean energy
Co-benefitsReduced acid rain, improved visibility, public health gainsSimultaneously reduces criteria pollutants, improves energy security, drives innovation

Traditional vs. climate-oriented pollution-reduction approaches

Looking ahead, the AP exam increasingly integrates climate change with air-quality management. Questions may ask you to identify co-benefits—situations where a single policy reduces both criteria pollutants and greenhouse gases. For instance, replacing coal-fired power generation with wind or solar eliminates SO2, NOx, PM, and CO2 simultaneously—a powerful argument for source-elimination strategies over end-of-pipe controls.

SECTION 9

Practice Problems

Question 1: CONCEPTUAL

Which of the following best explains why the Acid Rain Program's cap-and-trade system for SO₂ was considered more cost-effective than a uniform emission standard?
  • A. It allowed the EPA to set higher emission limits for individual plants.
  • B. It permitted firms with lower abatement costs to make larger reductions and sell surplus allowances to firms with higher abatement costs.
  • C. It eliminated the need for monitoring individual plant emissions.
  • D. It required all plants to install identical scrubber technology.
Show answer (B)
B is correct. The fundamental advantage of cap-and-trade is allocative efficiency: the trading mechanism directs emission reductions toward firms where the marginal cost of abatement is lowest, minimizing the aggregate cost of achieving the cap. A is incorrect because cap-and-trade does not raise limits—it sets a total cap that declines over time. C is incorrect because cap-and-trade actually requires rigorous continuous emission monitoring (CEM) to verify that allowances match actual emissions. D describes a technology mandate, which is the opposite of cap-and-trade's flexibility.

Question 2: BASIC CALCULATION

A factory emits 12,000 kg of NOx per year. After installing a selective catalytic reduction (SCR) system, emissions fall to 1,800 kg per year. What is the percent reduction in NOx emissions?
  • A. 15%
  • B. 75%
  • C. 85%
  • D. 90%
Show answer (C)
C is correct. Using the percent-reduction formula: ((12,000 − 1,800) / 12,000) × 100 = (10,200 / 12,000) × 100 = 85%. A (15%) would represent the remaining fraction, not the reduction—a common error. B (75%) results from an arithmetic mistake. D (90%) is the typical upper performance of scrubbers for SO₂ but does not match these specific values.

Question 3: INTERMEDIATE

A region has three coal-fired power plants (A, B, and C), each currently emitting 10,000 tons of SO₂ per year (30,000 tons total). Under a cap-and-trade program, the regional cap is set at 15,000 tons. Plant A can reduce emissions for $200/ton, Plant B for $500/ton, and Plant C for $800/ton. If allowances are freely traded, which outcome is most likely?
  • A. Each plant reduces by 5,000 tons, spending different amounts per ton.
  • B. Plant A reduces the most, sells surplus allowances to Plants B and C, and total costs are minimized.
  • C. Plant C shuts down entirely because its abatement cost is the highest.
  • D. Allowance prices fall to zero because all three plants can meet their allocations.
Show answer (B)
B is correct. In a cap-and-trade system, emissions gravitate toward the cheapest reductions. Plant A (at $200/ton) will reduce as much as possible and sell allowances to Plant C (at $800/ton), which prefers to buy allowances rather than install expensive controls. The 15,000-ton reduction is achieved, but the majority comes from Plant A, minimizing total system cost. A is incorrect because equal reduction across plants is economically inefficient—exactly the problem cap-and-trade solves. C is incorrect because shutting down entirely is an extreme outcome unlikely when purchasing allowances is cheaper. D is incorrect because a binding cap (below current emissions) ensures allowances have positive value.

Question 4: APPLIED

4 pts
A city government is concerned that vehicle exhaust is the primary contributor to elevated ground-level ozone concentrations measured at downtown monitoring stations. Ground-level ozone is a secondary pollutant formed when nitrogen oxides (NOₓ) and volatile organic compounds (VOCs) react in the presence of sunlight. The city is considering implementing a low-emission zone (LEZ) that would restrict older, high-polluting vehicles from entering the city center. Design an investigation to determine whether implementing the LEZ reduces ozone precursor concentrations. (a) State a testable hypothesis for the investigation. (1 point) (b) Identify the independent variable and the dependent variable. (1 point) (c) Describe a procedure that includes appropriate controls and data collection over a sufficient time period. (1 point) (d) Explain how the city could analyze the collected data to determine whether the LEZ had a statistically meaningful effect on ozone precursor concentrations. (1 point)
Show answer
Rubric (4 points): (a) Hypothesis (1 point): Award 1 point for a clear, testable hypothesis that links LEZ implementation to a measurable change in ozone precursor concentrations. Example: "If older, high-polluting vehicles are banned from the city center, then concentrations of NOₓ and VOCs measured at downtown monitoring stations will decrease compared to pre-LEZ levels and compared to control sites outside the LEZ." (b) Variables (1 point): Award 1 point for correctly identifying the independent variable (implementation of the LEZ—before vs. after, or LEZ zone vs. non-LEZ zone) and the dependent variable (concentration of ozone precursors such as NOₓ and/or VOCs, or ground-level ozone itself). (c) Procedure with controls (1 point): Award 1 point for describing a procedure that includes: (i) baseline data collection for at least one year prior to LEZ implementation, (ii) continued monitoring at the same stations after LEZ implementation over a comparable time period, and (iii) control monitoring stations in comparable urban areas outside the LEZ to account for weather variation and regional emission trends. Data should be collected at consistent intervals (e.g., daily or hourly) and during comparable seasons to minimize confounding variables. (d) Data analysis (1 point): Award 1 point for explaining that the city should compare average pollutant concentrations before and after LEZ implementation using a statistical test (e.g., paired t-test or regression analysis controlling for meteorological variables such as temperature, wind speed, and humidity). A statistically significant decrease at LEZ stations, not mirrored at control stations, would support the conclusion that the LEZ reduced ozone precursors. The student should note that results failing to show a significant difference would not support the hypothesis.

Question 5: CRITICAL THINKING

4 pts
The table below shows SO₂ emissions from U.S. power plants under the Acid Rain Program. Year | SO₂ Emissions (million tons) | Number of Allowances Allocated 1990 | 15.7 | 15.7 1995 | 11.9 | 13.0 2000 | 11.2 | 11.0 2005 | 10.2 | 9.5 2010 | 5.1 | 9.0 (a) Calculate the total percent reduction in SO₂ emissions from 1990 to 2010. (1 point) (b) Between which two consecutive data points was the greatest absolute decrease in emissions? Provide a plausible explanation for this decline. (1 point) (c) In 2010, actual emissions were well below the number of allowances allocated. Explain what this indicates about the market-based incentive structure of cap-and-trade. (1 point) (d) A critic argues that cap-and-trade programs can create environmental injustice by allowing pollution hot spots near disadvantaged communities. Propose one modification to the program that could address this concern while maintaining the overall cap. (1 point)
Show answer
Rubric (4 points): (a) Percent reduction calculation (1 point): ((15.7 − 5.1) / 15.7) × 100 = (10.6 / 15.7) × 100 ≈ 67.5%. Award 1 point for correct setup and calculation (accept rounding to approximately 67–68%). (b) Greatest absolute decrease and explanation (1 point): The greatest absolute decrease was from 2005 to 2010, a drop of 5.1 million tons (from 10.2 to 5.1). Award 1 point for identifying this interval AND providing a plausible explanation. Acceptable explanations include: the EPA tightened the cap in Phase II of the program, natural gas became significantly cheaper due to the shale gas boom (making it economical for utilities to switch from coal), and/or the 2008–2009 economic recession reduced electricity demand. (c) Emissions below allowances (1 point): Award 1 point for explaining that when actual emissions are significantly below allocated allowances, it indicates that firms found it cheaper to reduce emissions further (via fuel switching or technology) than to purchase allowances. This demonstrates that the market incentive successfully drove reductions beyond the minimum requirement, and firms may be banking surplus allowances for future use or sale. (d) Modification to address environmental justice (1 point): Award 1 point for proposing a specific, feasible modification. Acceptable responses include: (i) imposing facility-level emission caps ("floor limits") in addition to the overall cap so that no individual plant can exceed a maximum, preventing hot spots; (ii) prohibiting the purchase of additional allowances by plants located within a certain distance of environmental justice communities; (iii) requiring supplemental local monitoring and health-impact assessments in disproportionately affected communities. The response must maintain the overall cap while adding localized protections.

SUMMARY

Lesson Summary

Summary

Reducing air pollutants relies on a synergistic combination of regulatory standards like the National Ambient Air Quality Standards (NAAQS), emission-control technologies such as electrostatic precipitators, wet scrubbers, selective catalytic reduction, and catalytic converters, and market-based instruments including cap-and-trade programs and emission taxes. The Clean Air Act and its amendments established the legal architecture targeting the six criteria pollutants (CO, Pb, NOx, O3, PM, and SO2), while the Acid Rain Program demonstrated that market mechanisms can achieve dramatic reductions at lower cost than command-and-control approaches.

For the AP exam, remember to calculate percent reduction using the formula ((Einitial − Efinal) / Einitial) × 100, distinguish between command-and-control and market-based approaches, and be prepared to evaluate the trade-offs—including environmental justice concerns and co-benefits—of each strategy in the context of both criteria pollutants and greenhouse gases.

Varsity Tutors • AP Environmental Science • Reduction of Air Pollutants