

SECTION 1
Historical Context & Motivation
The question of how much living matter Earth can produce is far older than modern ecology. Early naturalists recognized that some environments—lush tropical forests, upwelling ocean zones—seemed to generate far more life than deserts or the deep sea, but they lacked a quantitative framework to express this difference. The development of primary productivity as a measurable concept gave ecologists a common currency for comparing ecosystems, predicting food-web dynamics, and ultimately understanding the planet's capacity to support life. Tracing the history of this idea reveals how advances in chemistry, physiology, and technology converged to create one of environmental science's most essential metrics.
1779 • Ingenhousz & Photosynthesis
1942 • Lindeman's Trophic-Dynamic Concept
1953 • Odum's Ecosystem Energetics
1975 • Whittaker & Likens Global Estimates
1997 • Satellite-Based Productivity Mapping
The central question this concept addresses is deceptively simple: How much new organic matter does an ecosystem create per unit area per unit time? Answering it requires distinguishing total energy captured by photosynthesis from the fraction that actually becomes available to the rest of the food web—a distinction between gross primary productivity and net primary productivity that lies at the heart of ecosystem energetics.
SECTION 2
Core Principles & Definitions
Primary productivity describes the rate at which autotrophs—organisms that synthesize organic compounds from inorganic raw materials—convert energy into biomass. Because virtually all food webs depend on this initial conversion of light or chemical energy into carbon-based molecules, primary productivity sets the energetic foundation for every consumer, decomposer, and detritivore in an ecosystem. Understanding the relationships among the several forms of productivity is essential for interpreting energy-flow diagrams, predicting carrying capacities, and analyzing ecosystem services.
Gross Primary Productivity (GPP)
Cellular Respiration (R)
Net Primary Productivity (NPP)
Net Ecosystem Productivity (NEP)
KEY TAKEAWAY
SECTION 3
Visual Explanation — Energy Partitioning in Producers
The diagram above highlights the fundamental accounting principle of ecosystem energetics: all gross energy fixed must be partitioned between the producer's own metabolic demands and the surplus that fuels every other organism. In most terrestrial ecosystems, producers respire roughly 40–70 % of GPP, so NPP is always a fraction of total photosynthetic output. This percentage varies with temperature (warm climates accelerate respiration), water availability, and nutrient supply, which is why identical amounts of sunlight can yield very different NPP values in different biomes.
SECTION 4
Mathematical Framework
Although the AP Environmental Science exam does not require calculus-based derivations, you should be fluent with the algebraic relationships among GPP, NPP, and respiration. These equations appear repeatedly in free-response questions, particularly in scenarios where you must calculate one variable given the other two or convert between units of energy and biomass.
FUNDAMENTAL PRODUCTIVITY EQUATION
Where NPP = net primary productivity (g C/m²/yr or kcal/m²/yr), GPP = gross primary productivity, and R = energy lost to cellular respiration by producers.
REARRANGED FOR GPP
Use this form when a problem gives you NPP and R and asks for total energy fixed. This rearrangement makes explicit that every joule of GPP is either stored as biomass (NPP) or consumed by the producer's metabolism (R).
NET ECOSYSTEM PRODUCTIVITY
NEP accounts for the respiration of all organisms. A positive NEP means the ecosystem sequesters more carbon than it releases, functioning as a carbon sink.
Unit Conversions on the Exam
SECTION 5
Productivity Across Biomes
One of the most frequently tested aspects of primary productivity is the comparison among Earth's major biomes. Three abiotic factors—sunlight, water, and nutrient availability—largely determine NPP. Tropical rainforests rank highest because they enjoy year-round warmth, abundant precipitation, and intense solar radiation. In contrast, open ocean, despite covering roughly 65 % of Earth's surface, has low productivity per unit area because nutrient concentrations are dilute in surface waters far from coastlines. However, the ocean's sheer size means it contributes a substantial share of global total NPP. The table and diagram below summarize these patterns.
| Biome | Avg NPP (g C/m²/yr) | Limiting Factor(s) |
|---|---|---|
| Tropical Rainforest | ~2,000 | Soil nutrients (P), light in understory |
| Temperate Forest | ~1,400 | Temperature, length of growing season |
| Estuary / Wetland | ~1,800 | Salinity fluctuation, dissolved O₂ |
| Open Ocean | ~200 | Nutrients (N, P, Fe), light at depth |
| Desert | ~100 | Water availability |
Representative NPP values and primary limiting factors for selected biomes.
SECTION 6
Worked Example — Calculating NPP and Biomass Available to Consumers
A field ecologist measures the following data for a 10-hectare temperate grassland over one growing season: total carbon fixed by grasses = 12,000 kg C, and carbon lost to plant respiration = 7,200 kg C. Determine (a) GPP, (b) NPP, (c) NPP per unit area in g C/m²/yr, and (d) the approximate energy available to primary consumers in kcal/m²/yr.
Temperate Grassland Productivity
- 1
Step 1 — Identify Given Values
Total carbon fixed (GPP) = 12,000 kg C for 10 ha. Carbon lost to respiration (R) = 7,200 kg C. Area = 10 ha = 10 × 10,000 m² = 100,000 m². - 2
Step 2 — Calculate NPP (total)
NPP = GPP − R = 12,000 kg C − 7,200 kg CNPP = 4,800 kg C - 3
Step 3 — Convert to g C/m²/yr
NPP per unit area = 4,800 kg C ÷ 100,000 m² = 0.048 kg C/m² = 48 g C/m²/yr (assuming one growing season ≈ 1 year of production for this grassland).NPP = 48 g C/m²/yr - 4
Step 4 — Convert Carbon to Dry Biomass
Since 1 g dry biomass ≈ 0.5 g C, dry biomass = 48 g C ÷ 0.5 = 96 g dry biomass/m²/yr. - 5
Step 5 — Convert Biomass to Energy
Using 1 g dry biomass ≈ 4.5 kcal: Energy available = 96 g × 4.5 kcal/gEnergy available to primary consumers ≈ 432 kcal/m²/yr
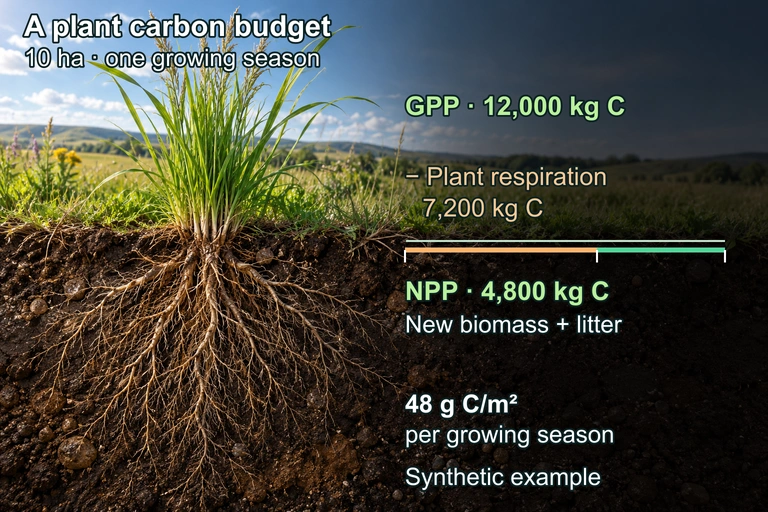 Over one growing season, 12,000 kg C of gross primary production minus 7,200 kg C of plant respiration leaves 4,800 kg C of net primary production. Across 10 ha, that is 48 g C/m² for the season; decomposer respiration is outside this plant budget. The graphic reports one growing season. The native worked example explicitly assumes this approximates one year before converting to annual biomass and energy.
SECTION 7
Factors That Influence Productivity — Strengths and Limitations of the Model
The NPP = GPP − R framework is powerful in its simplicity, but understanding its limitations is just as important as knowing how to apply it. On the AP exam, you may be asked to identify which factor most constrains productivity in a given scenario or to evaluate the assumptions behind a productivity estimate.
| Factor | Effect on NPP | Key Example |
|---|---|---|
| Solar radiation | Increases GPP directly; more photons → more photosynthesis | Tropics vs. polar regions |
| Water availability | Limits stomatal opening, reducing CO₂ uptake | Deserts have high sunlight but very low NPP |
| Temperature | Moderate warmth increases enzyme activity; excessive heat denatures enzymes and raises R | Tropical forests: high GPP but also high R |
| Nutrient availability | N, P, and Fe limit phytoplankton growth; N and P limit terrestrial plants | Iron fertilization experiments in open ocean |
| CO₂ concentration | "CO₂ fertilization effect" may raise GPP, but gains plateau and are offset by nutrient limits | FACE experiments in temperate forests |
Major abiotic factors that influence primary productivity and their ecosystem-level effects.
KEY TAKEAWAY
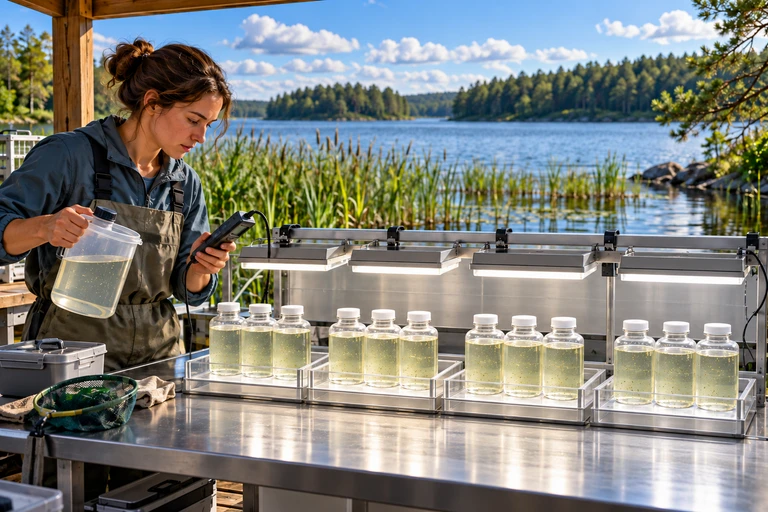 Compare a control, added nitrogen, added phosphorus, and both nutrients, with three independent vessels per treatment. Keep starting conditions, light, handling and measurement time consistent; infer nutrient limitation from measured responses.
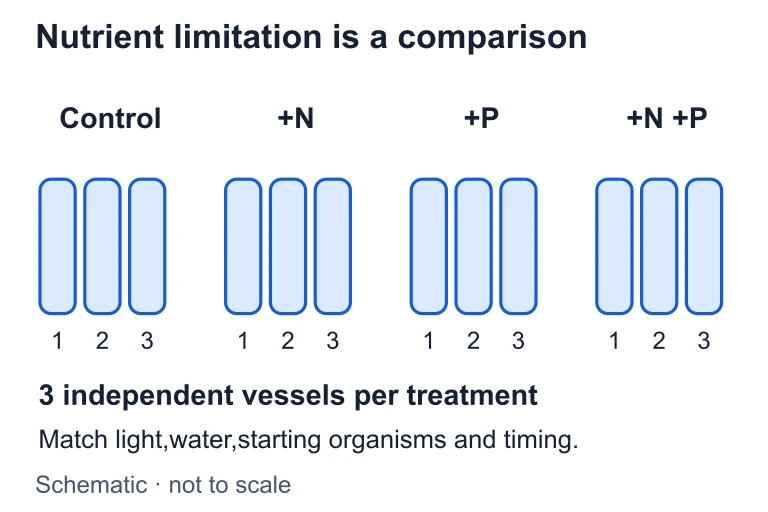 Compare a control, added nitrogen, added phosphorus, and both nutrients, with three independent vessels per treatment. Keep starting conditions, light, handling and measurement time consistent; infer nutrient limitation from measured responses.
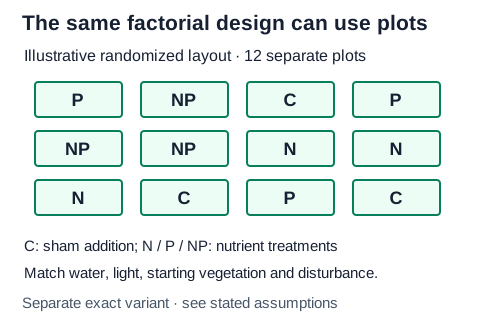 Randomly assign sham, nitrogen, phosphorus, or combined nitrogen-plus-phosphorus additions to three independent contained plots each. Match water, light, starting vegetation, disturbance and additions unrelated to nutrients; compare dry-biomass change per area over the same interval.Open full diagram
SECTION 8
Connections to the Carbon Cycle and Global Change
Primary productivity is not just an ecological metric; it sits at the nexus of the global carbon cycle and climate science. Changes in NPP directly affect how much CO₂ is removed from the atmosphere each year, which in turn influences the rate of anthropogenic climate change. Satellite data since the late 1990s suggest that terrestrial NPP has increased modestly in some regions due to CO₂ fertilization and longer growing seasons, but decreased in others due to drought, deforestation, and rising temperatures that accelerate plant respiration. Understanding these trends requires connecting the productivity framework to broader biogeochemical concepts.
| Concept | Primary Productivity View | Advanced / Global View |
|---|---|---|
| Carbon sequestration | NPP stores carbon in biomass | NEP determines whether an ecosystem is a net C sink or source |
| Eutrophication | Nutrient input raises GPP of algae | Excessive NPP → algal blooms → decomposition → hypoxic dead zones |
| Deforestation | Removes standing biomass (stored NPP) | Releases stored C to atmosphere; reduces future GPP capacity |
| Carrying capacity | NPP limits energy available to consumers | Human appropriation of NPP (HANPP) exceeds 25% of terrestrial NPP globally |
How primary productivity concepts scale up to global environmental issues.
On the AP Environmental Science exam, questions linking primary productivity to global change frequently appear in the free-response section. You may be asked to predict how a disturbance (e.g., clear-cutting, nitrogen deposition, or rising sea-surface temperatures) would affect GPP, R, and NPP in a specific ecosystem and to connect those changes to carbon-cycle feedbacks. Mastering the fundamental equation NPP = GPP − R and knowing which abiotic factors dominate in different biomes will prepare you for these multi-part questions.
SECTION 9
Practice Problems
Question 1: CONCEPTUAL
- A. Ocean water absorbs all wavelengths of light within the first meter, preventing photosynthesis at any depth.
- B. Essential nutrients such as nitrogen, phosphorus, and iron are scarce in surface waters far from continental shelves.
- C. Marine phytoplankton have inherently lower photosynthetic efficiency than terrestrial plants.
- D. High salinity inhibits the Calvin cycle in all marine autotrophs.
Show answer (B)
Question 2: BASIC CALCULATION
- A. 13,700 kcal/m²/yr
- B. 5,300 kcal/m²/yr
- C. 4,200 kcal/m²/yr
- D. 2,262 kcal/m²/yr
Show answer (B)
Question 3: INTERMEDIATE
- A. 930 g C/m²/yr
- B. 1,091 g C/m²/yr
- C. 1,333 g C/m²/yr
- D. 2,400 g C/m²/yr
Show answer (C)
Question 4: APPLIED
4 ptsShow answer
Question 5: CRITICAL THINKING
4 ptsShow answer
SUMMARY
Summary
Summary
Primary productivity quantifies the rate at which autotrophs convert inorganic carbon into organic biomass. Gross primary productivity (GPP) represents total carbon fixed through photosynthesis, while net primary productivity (NPP) equals GPP minus the energy producers lose to cellular respiration (R). NPP is the biomass available to consumers and decomposers and therefore sets the energy budget for the entire food web.
Productivity varies dramatically across biomes because of differences in sunlight, water, temperature, and nutrient availability—governed by Liebig's Law of the Minimum. Tropical rainforests and estuaries have the highest per-area NPP, while deserts and the open ocean rank lowest. On the AP exam, be prepared to apply the equation NPP = GPP − R in calculations, identify limiting factors in novel ecosystems, and connect changes in productivity to the carbon cycle and climate change.