

SECTION 1
Historical Context & Motivation
The relationship between environmental quality and infectious disease has shaped human civilization for millennia. Long before the germ theory of disease was established, societies recognized that contaminated water, poor sanitation, and degraded landscapes correlated with outbreaks of cholera, typhoid, and dysentery. The study of pathogens—disease-causing organisms including bacteria, viruses, protists, and parasitic worms—within an environmental science framework focuses on how human activities such as urbanization, deforestation, and agricultural runoff amplify pathogen transmission. Understanding these dynamics is essential for evaluating water quality standards, designing wastewater treatment systems, and predicting emerging disease outbreaks linked to environmental change.
1854 • John Snow & the Broad Street Pump
1882 • Koch's Postulates Published
1972 • U.S. Clean Water Act
1993 • Milwaukee Cryptosporidium Outbreak
2014–2016 • West African Ebola Epidemic
These historical episodes illustrate a central question in environmental science: how do anthropogenic changes to water systems, land use, and waste management alter pathogen exposure and disease burden? The AP Environmental Science curriculum addresses this by examining pathogen sources, transmission routes, indicator organisms, and the environmental interventions that reduce disease risk.
SECTION 2
Core Principles & Definitions
To analyze pathogens in an environmental context, one must distinguish between the major categories of disease-causing organisms, understand their transmission pathways through aquatic and terrestrial systems, and recognize the environmental conditions that promote or inhibit their spread. The following foundational concepts anchor the AP-level treatment of this topic.
Pathogen Types
Indicator Organisms
Transmission Routes
Environmental Amplifiers
Dose-Response & Vulnerability
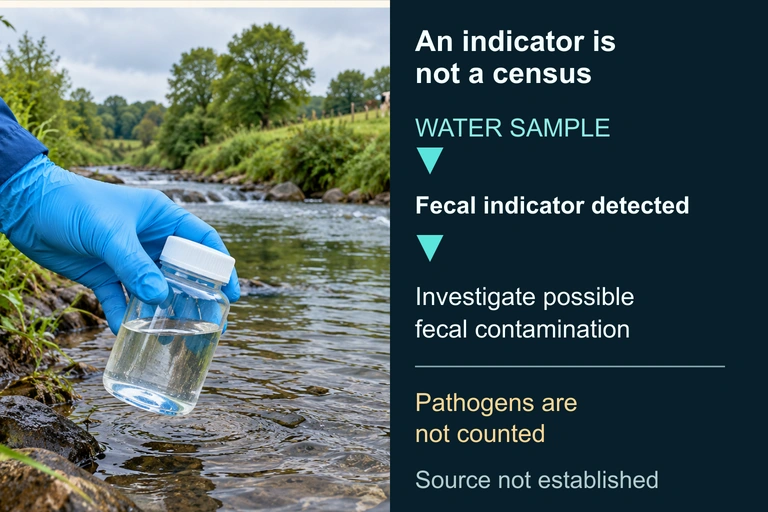 A positive indicator result supports investigating possible fecal contamination; it does not enumerate pathogens or identify the source.
KEY TAKEAWAY
SECTION 3
Pathogen Transmission Pathways
The diagram illustrates why environmental scientists focus on preventing pathogen contamination at the source rather than relying solely on medical treatment after exposure. Each arrow represents a step in the transmission chain where an environmental intervention—such as wastewater treatment, riparian buffer zones, or proper manure management—can break the link between contamination and disease. Notice that standing water serves a dual role: it acts as both a direct medium for fecal-oral transmission and a breeding habitat for disease vectors like Anopheles mosquitoes that transmit malaria. This convergence of pathways explains why communities lacking basic water infrastructure experience compounding disease burdens.
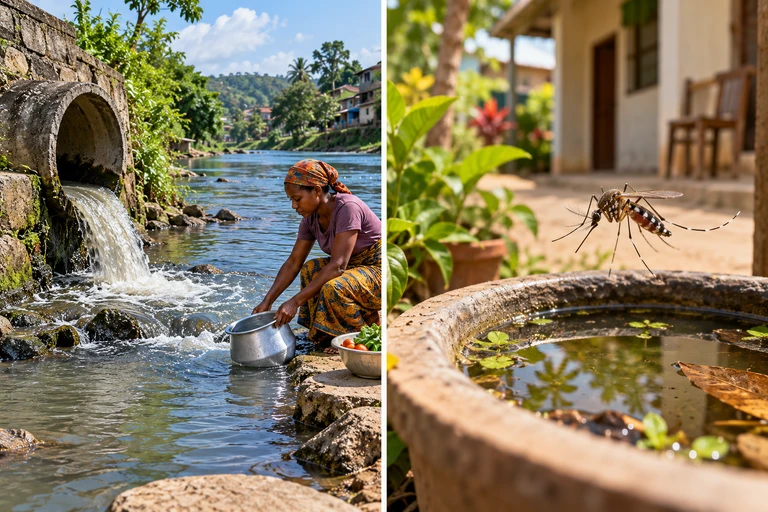 Environmental exposure pathways depend on the pathogen. Schistosoma includes a freshwater snail stage and can enter through skin, while mosquito-borne transmission and contaminated drinking water require different interruption strategies.
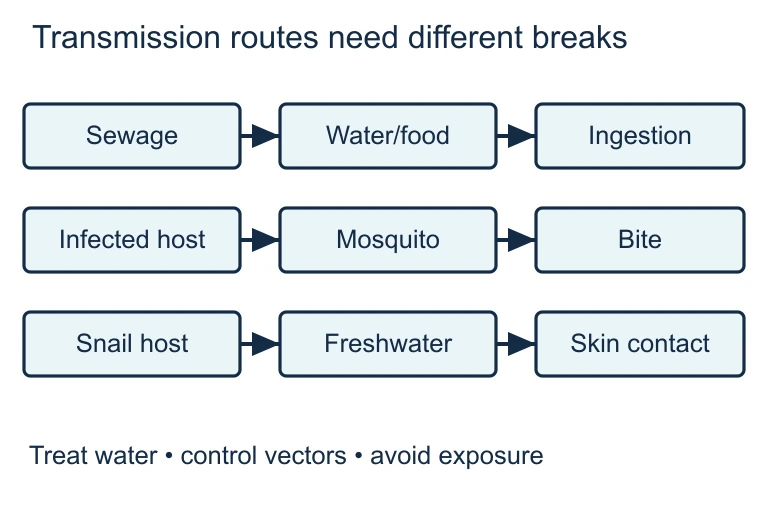 Environmental exposure pathways depend on the pathogen. Schistosoma includes a freshwater snail stage and can enter through skin, while mosquito-borne transmission and contaminated drinking water require different interruption strategies.
SECTION 4
Mechanisms of Pathogen Spread & Quantification
While the AP Environmental Science exam does not require advanced microbiology, students are expected to understand the quantitative indicators used to assess water quality and the mathematical reasoning behind disease-risk thresholds. Two key quantitative concepts anchor this section: coliform colony counts and biological oxygen demand (BOD) as an indirect measure of pathogen-laden organic pollution.
FECAL COLIFORM STANDARD
FC = fecal coliform count; CFU = colony-forming units. Water exceeding 200 CFU per 100 mL is considered unsafe for primary-contact recreation under EPA guidelines.
BIOLOGICAL OXYGEN DEMAND
DOᵢ = initial dissolved oxygen; DO_f = dissolved oxygen after 5 days. High BOD₅ values indicate heavy organic pollution, often from sewage, which correlates with high pathogen loads. Clean rivers typically have BOD₅ < 2 mg/L; heavily polluted waters may exceed 10 mg/L.
BASIC REPRODUCTION NUMBER
R₀ = average number of secondary infections from one infected individual; β = probability of transmission per contact; c = contact rate; D = duration of infectiousness. When R₀ > 1 the disease spreads; when R₀ < 1 it declines. Environmental interventions (clean water, sanitation) reduce c by limiting pathogen contact.
These metrics connect pollution management to public health outcomes. When wastewater treatment plants discharge effluent with elevated BOD, the receiving water body experiences oxygen depletion that simultaneously stresses aquatic ecosystems and signals the likely presence of fecal pathogens. The R₀ framework explains why environmental interventions—improving sanitation, chlorinating water supplies, draining mosquito breeding habitat—are often more effective at controlling infectious disease than treating individual patients, because they reduce the contact rate across an entire population.
SECTION 5
Major Environmental Pathogens & Their Diseases
| Pathogen | Disease | Primary Route | Environmental Factor |
|---|---|---|---|
| Vibrio cholerae | Cholera | Contaminated water | Lack of sewage treatment; flooding events |
| Cryptosporidium parvum | Cryptosporidiosis | Drinking water | Chlorine-resistant oocysts; agricultural runoff |
| Plasmodium falciparum | Malaria | Mosquito vector | Standing water; deforestation; climate warming |
| Schistosoma mansoni | Schistosomiasis | Skin contact with water | Dam construction creating snail habitat |
| Norovirus | Gastroenteritis | Water / food | Sewage overflow; shellfish in polluted estuaries |
Key environmental pathogens tested on the AP Environmental Science exam
SECTION 6
Worked Example: Evaluating Water Quality
A municipal water monitoring agency tests a river downstream of a combined sewer overflow (CSO) discharge point after a heavy rainstorm. The laboratory reports a fecal coliform count of 1,800 CFU per 100 mL and a BOD₅ of 14 mg/L. Upstream of the discharge, baseline values are 50 CFU per 100 mL and BOD₅ of 1.5 mg/L. Determine whether the downstream water is safe for recreational use and calculate the factor by which pathogen indicator levels increased.
CSO Discharge Water Quality Assessment
- 1
Step 1 — Identify the Regulatory Standard
The EPA standard for primary-contact recreational water is a fecal coliform concentration not exceeding 200 CFU per 100 mL as a geometric mean, and BOD₅ for clean water should be below approximately 2 mg/L. - 2
Step 2 — Compare Downstream Values to Standards
Downstream fecal coliform = 1,800 CFU/100 mL, which exceeds the 200 CFU/100 mL standard by a factor of 1,800 ÷ 200 = 9 times. Downstream BOD₅ = 14 mg/L, which is 7 times higher than the 2 mg/L threshold for clean water.The water is NOT safe for recreational use—it exceeds the standard by 9×. - 3
Step 3 — Calculate the Increase Factor from Baseline
Increase in fecal coliform = 1,800 ÷ 50 = 36-fold increase. Increase in BOD₅ = 14 ÷ 1.5 ≈ 9.3-fold increase. The CSO discharge dramatically worsened water quality by introducing raw sewage containing pathogens and oxygen-demanding organic matter.FC increased 36× and BOD₅ increased ~9.3× relative to upstream baseline. - 4
Step 4 — Interpret Environmental Implications
The elevated BOD₅ will cause dissolved oxygen levels to plummet, potentially creating hypoxic conditions harmful to aquatic life. Simultaneously, the high fecal coliform count indicates sewage-derived pathogens including potential Cryptosporidium, Giardia, and enteric viruses are present. Public health authorities should issue a swimming advisory and investigate the CSO infrastructure to prevent future overflows.Combined impacts: aquatic ecosystem stress + human health risk from waterborne pathogens.
SECTION 7
Environmental Interventions: Strengths & Limitations
Multiple strategies exist to reduce pathogen exposure, ranging from engineered solutions like water treatment plants to ecological approaches like constructed wetlands. Each carries trade-offs in cost, effectiveness, scalability, and environmental footprint. The AP exam frequently asks students to evaluate these interventions in context.
| Intervention | Strengths | Limitations |
|---|---|---|
| Chlorination | Inexpensive; effective against most bacteria and viruses; residual protection in distribution system | Produces disinfection byproducts (trihalomethanes); ineffective against Cryptosporidium oocysts |
| UV Disinfection | No chemical byproducts; effective against Cryptosporidium and Giardia | No residual protection; high turbidity reduces effectiveness; energy-intensive |
| Constructed Wetlands | Low-cost; provides habitat; removes nutrients and pathogens simultaneously; low energy | Large land area required; slower treatment; performance varies seasonally |
| Septic Systems | Suitable for rural areas; soil filtration removes many pathogens | Leaching into groundwater if poorly maintained; limited capacity; doesn't remove viruses well |
| Sanitary Sewer Separation | Prevents combined sewer overflows; eliminates raw sewage in stormwater | Extremely expensive retrofit; disrupts urban infrastructure during construction |
Comparison of environmental interventions for pathogen reduction
KEY TAKEAWAY
SECTION 8
Climate Change, Land Use, & Emerging Infectious Disease
The AP Environmental Science curriculum increasingly emphasizes the linkage between global environmental change and infectious disease emergence. Three interconnected trends—climate change, deforestation and habitat fragmentation, and urbanization—are reshaping the global distribution of pathogens in ways that standard pollution frameworks alone cannot fully capture.
| Environmental Change | Mechanism of Disease Impact | Example |
|---|---|---|
| Rising temperatures | Expands geographic range of mosquito vectors; increases pathogen replication rates in warm water | Malaria moving to higher altitudes in East Africa; Vibrio proliferating in warming coastal waters |
| Increased flooding frequency | Overwhelms sewage systems; contaminates drinking water with fecal pathogens | Post-hurricane cholera outbreaks; Leptospirosis after tropical floods |
| Deforestation | Increases human-wildlife contact at forest edges; displaces reservoir hosts into human settlements | Ebola, Nipah virus, and Hendra virus spillover events at deforestation frontiers |
| Rapid urbanization | Creates slums with inadequate sanitation; high population density accelerates airborne and waterborne transmission | Dengue fever epidemics in rapidly growing tropical cities |
How global environmental changes amplify infectious disease risk
Zoonotic Spillover
SECTION 9
Practice Problems
Question 1: CONCEPTUAL
- A. Fecal coliform bacteria themselves cause severe gastrointestinal disease in all exposed individuals.
- B. The absence of V. cholerae confirms the water is safe for drinking but not for swimming.
- C. Fecal coliforms indicate fecal contamination, suggesting other harder-to-detect pathogens may also be present.
- D. High coliform levels are caused by algal blooms and are unrelated to pathogen risk.
Show answer (C)
Question 2: BASIC CALCULATION
- A. BOD₅ = 3.1 mg/L; the water is mildly polluted.
- B. BOD₅ = 6.1 mg/L; the water is moderately to heavily polluted.
- C. BOD₅ = 12.3 mg/L; the water is extremely polluted.
- D. BOD₅ = 6.1 mg/L; the water is clean and safe for recreation.
Show answer (B)
Question 3: INTERMEDIATE
- A. Raw sewage → elevated BOD → dissolved oxygen depletion → pathogen contamination of shellfish beds
- B. Raw sewage → eutrophication → algal bloom → dissolved oxygen depletion → pathogen die-off
- C. Raw sewage → decreased BOD → increased dissolved oxygen → accelerated pathogen growth
- D. Raw sewage → thermal pollution → vector-borne disease increase → fishery collapse
Show answer (A)
Question 4: APPLIED
4 ptsShow answer
Question 5: CRITICAL THINKING
4 ptsShow answer
SUMMARY
Lesson Summary
Summary
Pathogens—including bacteria, viruses, protists, and helminths—enter aquatic and terrestrial systems primarily through untreated sewage, agricultural runoff, and combined sewer overflows. Fecal coliform bacteria and E. coli serve as indicator organisms whose presence signals fecal contamination and probable co-occurrence of dangerous pathogens. Water quality is assessed through coliform counts (CFU/100 mL) and biological oxygen demand (BOD₅), with the EPA recreational standard set at 200 CFU/100 mL.
Environmental interventions follow a multi-barrier approach: chlorination and UV disinfection target pathogens directly, while constructed wetlands and proper wastewater treatment address contamination at its source. Climate change, deforestation, and urbanization are amplifying infectious disease risk by expanding vector ranges, increasing flood-driven contamination, and promoting zoonotic spillover. On the AP exam, expect questions linking pollution sources to pathogen transmission, interpreting water quality data, evaluating intervention trade-offs, and connecting land-use change to emerging disease.