

SECTION 1
Historical Context & Motivation
For most of modern history, scientists regarded the ocean as a vast, thermally stable reservoir largely immune to short-term climatic perturbations. Early oceanographic expeditions, such as the HMS Challenger expedition (1872–1876), collected rudimentary temperature profiles that established baseline data for deep-ocean conditions. It was not until the mid-twentieth century that researchers began to suspect the ocean might be actively absorbing anthropogenic heat, a hypothesis that gained traction as atmospheric CO2 concentrations climbed past pre-industrial norms. The concept of ocean warming — the sustained increase in ocean heat content driven by the enhanced greenhouse effect — has since become one of the most consequential indicators of global climate change.
1872 • HMS Challenger Expedition
1956 • Revelle & Suess Publication
2000 • Argo Float Network Launched
2014 • IPCC AR5 Confirms >90% Heat Uptake
2023 • Record Ocean Heat Content
These milestones underscore a central question in environmental science: how does the redistribution of excess heat into the ocean alter marine ecosystems, sea level, weather patterns, and the global carbon cycle? Understanding ocean warming requires integrating thermodynamics, ocean circulation, and biogeochemistry — a synthesis that lies at the heart of AP Environmental Science's Global Change unit.
SECTION 2
Core Principles & Definitions
Ocean warming operates through a chain of physical and biogeochemical mechanisms linked to the planetary energy imbalance. When incoming solar radiation exceeds outgoing longwave radiation — a gap widened by rising greenhouse gas concentrations — the surplus energy must be stored somewhere in the Earth system. Because water has an exceptionally high specific heat capacity (≈ 4,186 J kg⁻¹ °C⁻¹), the ocean is the dominant heat sink, absorbing roughly 91% of the excess energy trapped by anthropogenic forcing. The following core principles frame the phenomenon.
Earth's Energy Imbalance
Thermal Stratification
Thermal Expansion
Ocean Heat Content (OHC)
Feedback Loops
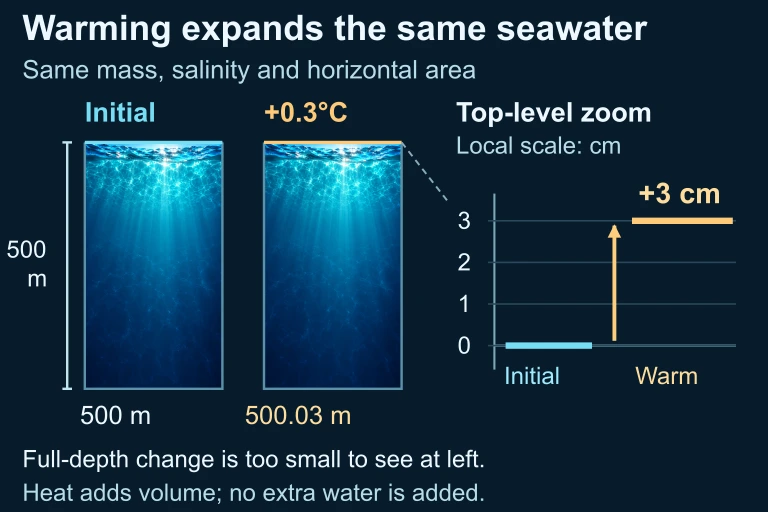 Two equal-footprint columns hold the same mass and salinity. In the stated constant-beta model, warming a 500 m column by 0.3°C raises its surface by 0.03 m without added water. The full-depth profiles share the same scale; the separate local waterline zoom explicitly magnifies the 3 cm difference. The companion calculates the fixed mass, heat input and volume increase from the stated preset.
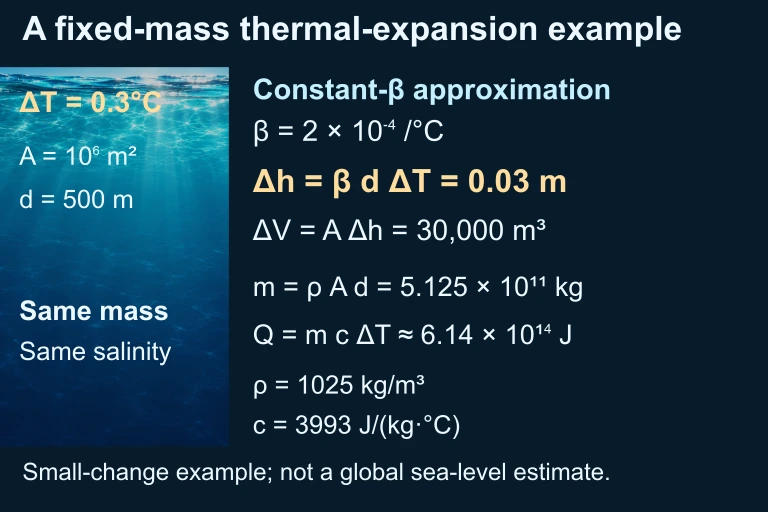 A fixed-mass 500 m seawater column warming by 0.3 °C expands by 30,000 m³ and rises 3 cm over 1 km²; heat input is approximately 6.14 × 10¹⁴ J. This is distinct from the 700 m EEZ assessment.
SECTION 3
Visual Explanation — Earth's Heat Budget & the Ocean
The diagram above captures the fundamental physics of ocean warming. Incoming solar radiation averages about 340 W m⁻², while outgoing longwave radiation currently falls roughly 1 W m⁻² short of balancing the budget due to elevated greenhouse gas concentrations. That seemingly small imbalance, integrated over the entire planetary surface (5.1 × 10¹⁴ m²), translates to enormous energy accumulation — on the order of hundreds of zettajoules per decade. Because water's specific heat is roughly four times that of air and the ocean's mass dwarfs the atmosphere's by a factor of about 260, the ocean acts as the planet's primary thermal buffer. The upper 700 meters has warmed by approximately 0.4 °C since 1970, while the deeper layer has warmed more modestly. Even these seemingly small temperature shifts drive large-scale environmental responses, from thermosteric sea-level rise to the disruption of marine food webs.
SECTION 4
Mathematical Framework
Quantifying ocean warming involves relatively straightforward thermodynamic relationships. The AP Environmental Science exam does not require calculus, but you should be comfortable applying the heat equation and converting between energy units.
HEAT ABSORBED BY A WATER MASS
where Q = heat energy (J), m = mass of water (kg), c = specific heat capacity of seawater (≈ 3,993 J kg⁻¹ °C⁻¹ for average salinity; ~4,186 J kg⁻¹ °C⁻¹ for fresh water), and ΔT = change in temperature (°C).
EARTH'S ENERGY IMBALANCE → TOTAL EXCESS POWER
where P = total excess power (W), EEI = Earth's energy imbalance (≈ 1.0 W m⁻²), and A = Earth's surface area (5.1 × 10¹⁴ m²). This yields ~5.1 × 10¹⁴ W or ~16 zettajoules per year.
THERMOSTERIC SEA-LEVEL RISE
where Δh = sea-level rise from thermal expansion (m), β = volumetric thermal expansion coefficient of seawater (≈ 2.0 × 10⁻⁴ °C⁻¹ for upper ocean), ΔT = average temperature change (°C), and d = depth of the warming layer (m). This is a simplified linear approximation appropriate for small ΔT.
SECTION 5
Ecological & Physical Impacts of Ocean Warming
The diagram above reveals the interconnected nature of ocean warming impacts. Physical changes include sea-level rise from thermal expansion and the intensification of tropical cyclones, which draw energy from warm sea-surface temperatures. Ecological changes encompass coral bleaching, as symbiotic zooxanthellae are expelled when temperatures exceed ~1 °C above the local seasonal maximum, and poleward migration of marine species tracking cooler isotherms. Chemical changes include reduced dissolved oxygen concentrations (since gas solubility decreases with rising temperature) and diminished CO2 uptake, which creates a dangerous positive feedback loop: warmer oceans absorb less CO2, leaving more in the atmosphere, which intensifies warming further.
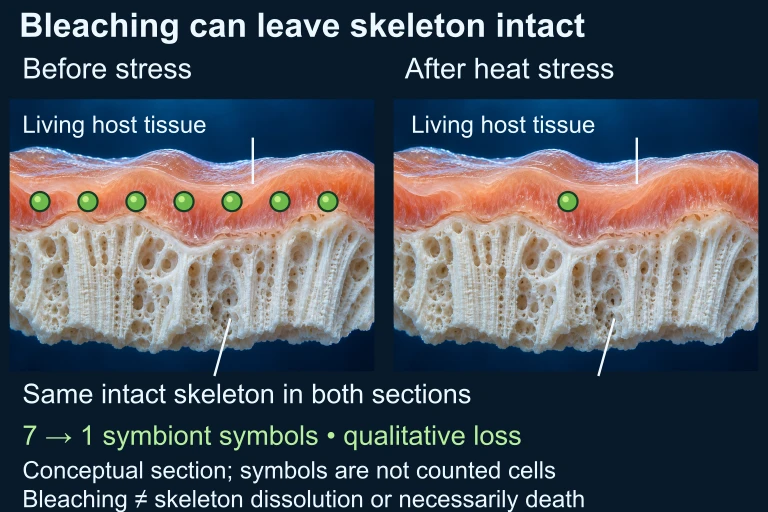 Heat stress can lead to loss of symbionts or their pigments. Two matched conceptual host-tissue sections isolate a reduction from seven to one symbiont symbols while preserving exactly the same intact skeleton geometry. Symbol counts and tissue colors are illustrative, not histology, measured abundance or pigment concentration. Bleaching differs from skeleton dissolution and does not necessarily mean the coral has died.
 Warming can strengthen stratification and affect oxygen supply. Mixing, circulation, salinity and productivity also influence oxygen conditions. Warming and CO₂-driven acidification are distinct interacting changes.
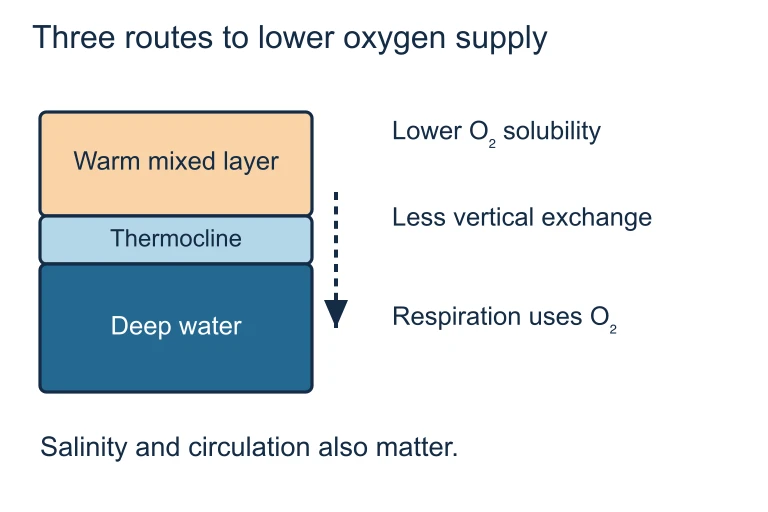 Warming can strengthen stratification and affect oxygen supply. Mixing, circulation, salinity and productivity also influence oxygen conditions. Warming and CO₂-driven acidification are distinct interacting changes.
SECTION 6
Worked Example — Calculating Ocean Heat Uptake
Consider the following scenario: A 500-meter-deep column of seawater with a surface area of 1 km² warms uniformly by 0.3 °C over 50 years. Calculate the total heat absorbed and the thermosteric sea-level rise.
Worked example
- 1
Step 1 — Determine the mass of the water column
Volume = area × depth = 1 × 10⁶ m² × 500 m = 5 × 10⁸ m³. The density of seawater is approximately 1,025 kg m⁻³. Therefore: m = 1,025 × 5 × 10⁸ = 5.125 × 10¹¹ kg.m = 5.125 × 10¹¹ kg - 2
Step 2 — Calculate heat absorbed (Q = mcΔT)
Using the specific heat capacity of seawater (c ≈ 3,993 J kg⁻¹ °C⁻¹): Q = 5.125 × 10¹¹ kg × 3,993 J kg⁻¹ °C⁻¹ × 0.3 °C = 6.14 × 10¹⁴ J.Q ≈ 6.14 × 10¹⁴ J (0.614 PJ) - 3
Step 3 — Estimate thermosteric sea-level rise (Δh = β × ΔT × d)
Using the thermal expansion coefficient β ≈ 2.0 × 10⁻⁴ °C⁻¹: Δh = 2.0 × 10⁻⁴ × 0.3 × 500 = 0.03 m = 3.0 cm.Δh ≈ 3.0 cm of sea-level rise from thermal expansion alone - 4
Step 4 — Interpret the result
A 0.3 °C warming of the upper 500 m produces 3 cm of thermosteric rise in this column. Extrapolated globally, this accounts for roughly one-third of observed sea-level rise, with additional contributions from glacial melting and ice-sheet loss. Note that the actual ocean does not warm uniformly, so real calculations require depth-integrated profiles from Argo data.
SECTION 7
Positive & Negative Feedbacks in Ocean Warming
| Feedback Mechanism | Type | How It Works |
|---|---|---|
| Reduced CO₂ solubility | Positive | Warmer water holds less dissolved CO₂ → more CO₂ stays in atmosphere → enhanced greenhouse effect → more warming. |
| Ice-albedo feedback | Positive | Warmer oceans accelerate sea-ice loss → darker ocean surface absorbs more solar radiation → further warming. |
| Water vapor feedback | Positive | Warmer ocean surface evaporates more water → water vapor is a greenhouse gas → amplifies warming. |
| Increased cloud cover | Negative (partial) | More evaporation can produce low-altitude clouds that reflect incoming solar radiation, partially offsetting warming. Effect is region-dependent. |
| Blackbody radiation | Negative | Warmer surfaces radiate more longwave energy (Stefan-Boltzmann law), providing a thermodynamic ceiling — though currently overwhelmed by positive feedbacks. |
Key feedback mechanisms linked to ocean warming
SECTION 8
Connection to Broader Climate Science
Ocean warming does not operate in isolation; it interacts with virtually every other component of the Earth system. The table below contrasts core APES-level concepts with the more advanced frameworks you may encounter in college-level climate science or Earth system science courses.
| APES Concept | Advanced Extension |
|---|---|
| Ocean absorbs ~91% of excess heat | Ocean heat content is tracked using Argo floats and GRACE/GRACE-FO gravimetric satellites; meridional overturning circulation (AMOC) redistributes heat poleward. |
| Thermal expansion causes sea-level rise | Steric sea-level components are decomposed into thermosteric and halosteric (salinity-driven) terms; regional variations depend on ocean dynamics. |
| Coral bleaching at +1–2 °C anomaly | Degree Heating Weeks (DHW) index quantifies cumulative thermal stress; mass bleaching thresholds modeled via ensemble SST projections. |
| Reduced O₂ solubility (deoxygenation) | Oxygen Minimum Zones (OMZs) are expanding globally; coupled biogeochemical models project 1–7% decline in dissolved O₂ by 2100 under SSP2–4.5. |
APES-level concepts vs. advanced climate science extensions
For the AP exam, focus on the causal chain: anthropogenic greenhouse gases → energy imbalance → ocean heat uptake → physical, ecological, and chemical consequences. Understanding these connections will equip you to answer both multiple-choice questions testing conceptual reasoning and free-response questions requiring you to trace cause-and-effect pathways or propose evidence-based solutions. The advanced extensions above are provided for enrichment; they are not tested on APES but may appear in college-level coursework.
SECTION 9
Practice Problems
Question 1: CONCEPTUAL
- A. The ocean has a very low albedo, so it reflects most incoming solar radiation before it can be absorbed.
- B. Water has a high specific heat capacity and the ocean's mass greatly exceeds that of the atmosphere, enabling it to store vast amounts of thermal energy.
- C. Ocean currents transport heat so rapidly that warming is distributed before satellite instruments can detect it.
- D. Dissolved CO₂ in seawater undergoes exothermic reactions that release additional heat into the water column.
Show answer (B)
Question 2: BASIC CALCULATION
- A. 2.45 × 10¹⁴ J
- B. 2.45 × 10¹¹ J
- C. 8.19 × 10¹⁴ J
- D. 1.23 × 10¹⁵ J
Show answer (A)
Question 3: INTERMEDIATE
- A. The coral will experience moderate bleaching, and most colonies will recover if SSTs return to normal within weeks.
- B. These data alone do not establish a specific bleaching severity or a NOAA Degree Heating Week threshold exceedance; the full heat history and local conditions are needed.
- C. The coral will be unaffected because 0.8 °C is below the 2 °C bleaching threshold.
- D. The coral will adapt through rapid genetic mutation within the 6-week period.
Show answer (B)
Question 4: APPLIED
Show answer
Question 5: CRITICAL THINKING