

SECTION 1
Historical Context & Motivation
Although humans have complained about unwanted sound for millennia—ancient Rome enacted daytime bans on iron-wheeled chariots to protect sleep—noise pollution only became a subject of formal scientific and regulatory study during the Industrial Revolution, when steam engines, textile mills, and rail networks dramatically amplified the acoustic environment of cities. Prolonged exposure to industrial noise was linked to hearing loss among factory workers as early as the 1830s, yet decades passed before governments treated noise as a genuine environmental contaminant rather than a mere nuisance. The twentieth century's rapid mechanization of transportation and urbanization thrust the issue into public health discourse, culminating in landmark legislation that placed sound alongside particulates, ozone, and heavy metals as a regulated pollutant.
1713 • Ramazzini's Occupational Noise Study
1972 • U.S. Noise Control Act
1999 • WHO Guidelines on Community Noise
2011 • EU Environmental Noise Directive Progress
2018 • WHO Environmental Noise Guidelines for Europe
Despite this regulatory history, noise pollution remains one of the most underappreciated environmental stressors. The central question the AP Environmental Science curriculum asks is: How does anthropogenic noise interact with human health and ecological systems, and what strategies can meaningfully mitigate its impacts? Answering that question requires understanding the physics of sound measurement, the biological pathways of noise-induced harm, and the policy tools available to manage exposure.
SECTION 2
Core Principles & Definitions
At its most fundamental level, noise pollution is unwanted or harmful sound that disrupts normal activities, degrades quality of life, or damages health. Sound itself is a longitudinal pressure wave propagating through a medium—usually air—and is characterized by its frequency (measured in hertz, Hz) and amplitude (measured in decibels, dB). The human ear can perceive frequencies roughly from 20 Hz to 20,000 Hz, and sounds below 0 dB are essentially inaudible to most people, while sounds above 85 dB sustained over eight hours can cause permanent hearing damage.
Decibel Scale (dB)
Point & Non-Point Sources
Acute vs. Chronic Exposure
Ecological Noise Effects
KEY TAKEAWAY
SECTION 3
Visual Explanation — The Decibel Spectrum
The diagram above situates everyday sound sources along the decibel continuum and maps them to three health-effect zones. Notice that the transition from green (safe) to amber (caution) occurs around 70 dB—roughly the level of a busy restaurant—while the red (danger) zone begins at the 85 dB occupational exposure limit established by NIOSH. Because the decibel scale is logarithmic, the sound energy at 85 dB is roughly 30 times greater than at 70 dB, even though the numerical difference appears modest. For AP Environmental Science, it is essential to understand that chronic exposure to levels in the caution zone already elevates risks of cardiovascular disease, hypertension, and cognitive impairment—effects that accumulate silently over years, much like the health consequences of long-term air-pollutant exposure.
SECTION 4
Mathematical Framework — The Decibel Scale
Sound intensity is the power per unit area carried by a sound wave, measured in watts per square meter (W/m²). Because the range of intensities the human ear can perceive spans roughly twelve orders of magnitude, scientists use the decibel (dB) scale—a logarithmic compression that makes comparing vastly different intensities tractable. The AP exam expects you to interpret and apply the decibel formula, understand the reference intensity, and translate decibel changes into real-world intensity ratios.
SOUND INTENSITY LEVEL
β = sound intensity level in decibels (dB); I = measured sound intensity (W/m²); I₀ = reference intensity = 10⁻¹² W/m² (threshold of human hearing); log₁₀ = common (base-10) logarithm.
INTENSITY RATIO FROM DECIBEL CHANGE
Δβ = change in decibel level (dB); I₂/I₁ = ratio of the two sound intensities. A 10 dB increase means intensity multiplied by 10; a 3 dB increase means intensity roughly doubled.
INVERSE SQUARE LAW (SOUND IN OPEN AIR)
I = sound intensity at distance r from a point source (W/m²); P = acoustic power output (W); r = distance from the source (m). Sound intensity decreases with the square of the distance; doubling distance reduces intensity by a factor of 4 (≈ 6 dB reduction).
KEY TAKEAWAY
SECTION 5
Sources, Pathways, and Ecological Effects
Noise pollution originates from a wide array of anthropogenic activities, and its effects propagate through both atmospheric and aquatic media. The AP exam commonly tests your ability to identify major noise sources, describe their ecological consequences, and distinguish between human-health and wildlife impacts. The diagram below maps the primary source categories to the organisms and systems they affect.
| Source Category | Typical dB Range | Primary Ecological Impact |
|---|---|---|
| Road traffic | 70 – 85 dB | Habitat fragmentation for terrestrial species; avoidance of roadside zones reduces effective habitat area |
| Aircraft | 90 – 130 dB (near runway) | Bird nest abandonment; reduced breeding success near airports |
| Naval sonar | Up to 235 dB underwater | Cetacean disorientation, mass strandings, disrupted echolocation in dolphins and whales |
| Construction / industry | 80 – 110 dB | Displacement of sensitive species; elevated cortisol levels in wildlife in adjacent areas |
Major noise pollution sources, their typical decibel ranges, and documented ecological impacts
 Traffic can mask portions of an animal call when their frequency and time ranges overlap within the listener’s sensitivity. Detectability depends on the signal, background noise and receiver.
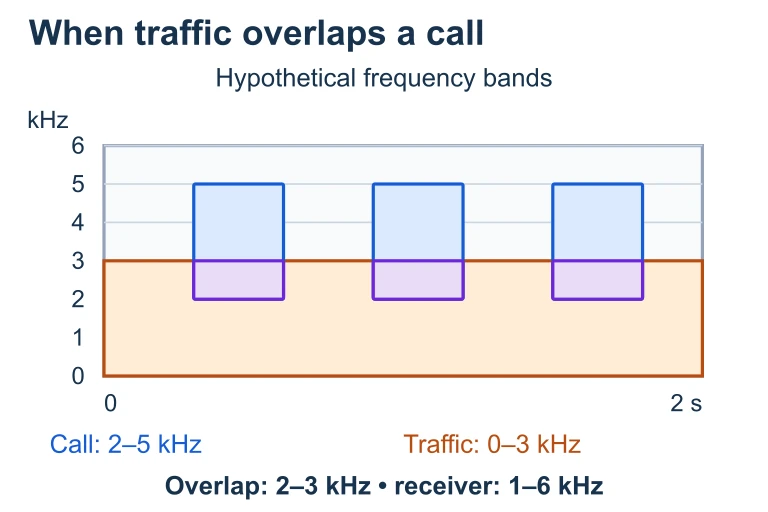 Traffic can mask portions of an animal call when their frequency and time ranges overlap within the listener’s sensitivity. Detectability depends on the signal, background noise and receiver.
SECTION 6
Worked Example — Applying the Decibel Scale and Inverse Square Law
A construction site generates sound at an intensity of 10⁻³ W/m² at a distance of 15 m from the jackhammer. A residential neighborhood begins 120 m from the source. Calculate the sound level in decibels at the construction site (15 m) and at the neighborhood (120 m), then determine whether the neighborhood level exceeds the WHO daytime guideline of 55 dB.
Noise Impact Assessment
- 1
Step 1 — Calculate dB at the Construction Site (15 m)
Use the decibel formula: β = 10 × log₁₀(I / I₀). Substituting: β = 10 × log₁₀(10⁻³ / 10⁻¹²) = 10 × log₁₀(10⁹) = 10 × 9.β = 90 dB at 15 m - 2
Step 2 — Apply the Inverse Square Law to Find Intensity at 120 m
The inverse square law states I ∝ 1/r². The ratio of distances is 120/15 = 8. Therefore: I₁₂₀ = I₁₅ × (15/120)² = 10⁻³ × (1/8)² = 10⁻³ × (1/64) = 1.5625 × 10⁻⁵ W/m².I at 120 m ≈ 1.56 × 10⁻⁵ W/m² - 3
Step 3 — Convert Intensity at 120 m to Decibels
β = 10 × log₁₀(1.5625 × 10⁻⁵ / 10⁻¹²) = 10 × log₁₀(1.5625 × 10⁷). Since log₁₀(1.5625 × 10⁷) = log₁₀(1.5625) + 7 ≈ 0.194 + 7 = 7.194, we get β = 10 × 7.194.β ≈ 71.9 dB at 120 m - 4
Step 4 — Compare to WHO Guideline and Interpret
The WHO daytime outdoor guideline is 55 dB. At 71.9 dB, the neighborhood is exposed to a level approximately 16.9 dB above the guideline. Because every 10 dB represents a tenfold increase in intensity, this exceedance corresponds to roughly 50 times more sound intensity than the recommended limit. Environmental mitigation—such as sound barriers, equipment enclosures, or increased buffer distances—would be necessary.71.9 dB exceeds the WHO guideline of 55 dB by ~17 dB → mitigation required
SECTION 7
Mitigation Strategies — Strengths & Limitations
Effective noise management typically combines engineering controls, land-use planning, and regulatory enforcement. The AP exam may present you with a scenario requiring evaluation of which strategies are most appropriate given economic, geographic, and ecological constraints. The table below summarizes the most widely used approaches along with their advantages and drawbacks.
| Strategy | Strengths | Limitations |
|---|---|---|
| Sound barriers / walls | Can reduce noise by 5–10 dB; effective along highways and rail corridors; relatively quick to install | Expensive ($150–$300/m²); visually intrusive; less effective for upper-floor residences above the barrier |
| Vegetation buffers | Provide co-benefits: carbon sequestration, habitat, aesthetics; psychologically reduce perceived noise | Require 30+ m of dense planting for meaningful (3–5 dB) reduction; slow-growing; seasonal leaf loss in deciduous species |
| Zoning / buffer zones | Prevents new noise-sensitive development near sources; low recurring cost; leverages inverse square law attenuation | Cannot help existing communities; requires political will; may restrict land use and development opportunities |
| Source controls (quieter machinery, electric vehicles) | Addresses noise at the origin; often the most effective per-dB-reduction strategy; benefits all exposed populations simultaneously | High upfront technology costs; fleet turnover is slow; may require regulatory mandates to incentivize adoption |
| Building insulation / acoustic glazing | Protects indoor environments effectively (20–35 dB reduction); can be retrofitted | Does not protect outdoor spaces; costly for large-scale programs; energy trade-offs with sealed buildings |
Comparison of common noise pollution mitigation strategies
KEY TAKEAWAY
 For a free-field point source, intensity at 120 m is 1/64 of that at 15 m. A barrier can block a low receiver’s line of sight while leaving an upper receiver exposed; diffraction, reflection and source geometry also affect the sound received.
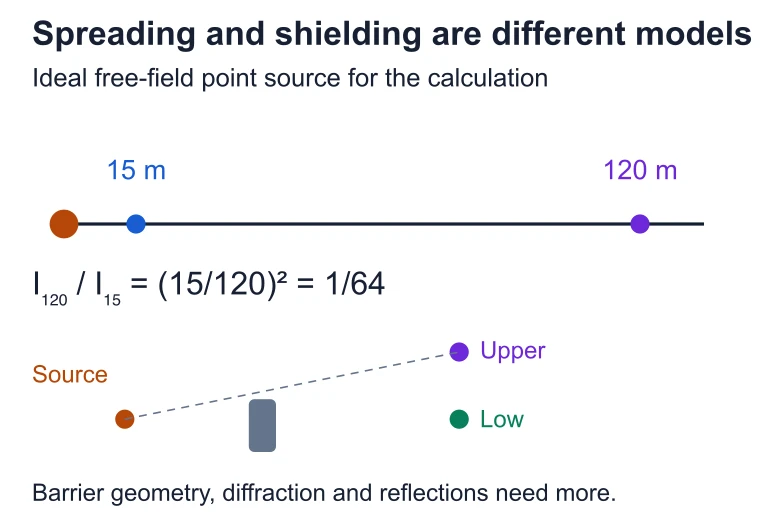 For a free-field point source, intensity at 120 m is 1/64 of that at 15 m. A barrier can block a low receiver’s line of sight while leaving an upper receiver exposed; diffraction, reflection and source geometry also affect the sound received.
SECTION 8
Regulatory Frameworks & Connections to Broader Environmental Science
Noise pollution intersects with several other topics in the AP Environmental Science curriculum, including urbanization, biodiversity, public health, and environmental policy. Regulatory frameworks for noise differ markedly from those governing chemical pollutants because noise does not persist in the environment—once the source stops, the pollutant vanishes—yet the health effects of chronic exposure are cumulative and may be irreversible. This distinction shapes how policies are designed and enforced.
| Dimension | Noise Pollution | Air Pollution (e.g., PM₂.₅) |
|---|---|---|
| Persistence | Ceases immediately when source stops; no residual contamination | Particulates can linger for hours to weeks; deposition creates secondary pollution |
| Health pathway | Stress hormones (cortisol), cardiovascular strain, hearing damage; effects are cumulative | Respiratory inflammation, carcinogenesis, cardiovascular damage; effects are cumulative |
| Measurement | Decibels (dB); A-weighted for human hearing (dBA); time-averaged metrics (Leq, Lden) | Micrograms per cubic meter (µg/m³); AQI indices |
| Major U.S. regulation | Noise Control Act (1972); largely defunded since 1982; regulation delegated to states/localities | Clean Air Act (1970, amended 1990); actively enforced by EPA with NAAQS |
| Environmental justice | Low-income communities near highways/airports disproportionately affected | Low-income communities near industrial zones disproportionately affected |
Comparing noise pollution regulation with air pollution regulation
A critical point for the AP exam is that the EPA's Office of Noise Abatement and Control was effectively defunded in 1982, leaving the United States without a dedicated federal noise enforcement body. Today, noise regulation in the U.S. is a patchwork of state and local ordinances, whereas the European Union has pursued centralized strategic noise mapping under Directive 2002/49/EC. Looking ahead, growing research on the synergistic effects of noise and air pollution on cardiovascular disease, as well as acoustic ecology studies documenting the value of natural soundscapes for biodiversity, are pushing noise toward greater prominence in environmental policy. Students should also note the connection to environmental justice: communities of color and low-income populations are disproportionately located near highways, rail yards, and airports—the same areas with the highest noise exposures.
AP Exam Connection
SECTION 9
Practice Problems
Question 1: CONCEPTUAL
- A. 160 dB
- B. 83 dB
- C. 90 dB
- D. 80 dB
Show answer (B)
Question 2: BASIC CALCULATION
- A. 60 dB
- B. 80 dB
- C. 90 dB
- D. 70 dB
Show answer (B)
Question 3: INTERMEDIATE
- A. The buffer is sufficient because 72 − 5 = 67 dB, which is below the 70 dB caution threshold.
- B. The buffer is insufficient because 72 − 5 = 67 dB, which still exceeds the WHO guideline of 55 dB by 12 dB; additional strategies such as sound walls or source reduction would be needed.
- C. The buffer is sufficient because vegetation absorbs noise exponentially, so the actual reduction will be much greater than 5 dB.
- D. The buffer is insufficient because vegetation buffers only reduce perceived noise psychologically and provide no measurable dB reduction.
Show answer (B)
Question 4: APPLIED
4 ptsShow answer
Question 5: CRITICAL THINKING
4 ptsShow answer
SUMMARY
Summary
Summary
Noise pollution is unwanted or harmful sound produced by anthropogenic activities—principally transportation, industry, construction, and military operations. Sound intensity is measured on the logarithmic decibel (dB) scale, where every 10 dB increase represents a tenfold increase in intensity. The key formula β = 10 × log₁₀(I/I₀) relates intensity to the dB reading, and the inverse square law (I = P/4πr²) governs how sound attenuates with distance from a point source—doubling the distance reduces intensity by approximately 6 dB.
Human health effects include noise-induced hearing loss (NIHL) above 85 dB, cardiovascular stress, sleep disruption, and cognitive impairment from chronic exposure above the WHO guideline of 55 dB. Ecological effects include disrupted animal communication, altered species distributions, and marine mammal strandings linked to naval sonar. Mitigation strategies range from source controls (the most effective) and sound barriers to zoning and vegetation buffers. In the U.S., federal noise enforcement was largely abandoned after 1982, leaving regulation to states and localities—an important environmental justice concern given the disproportionate exposure of low-income and minority communities.