

SECTION 1
Historical Context & Motivation
The domestication of livestock roughly 10,000 years ago marked one of the most consequential shifts in the relationship between human societies and the natural environment. Early pastoralists grazed small herds on open grasslands, and the ecological footprint of meat production remained modest for millennia. However, the Industrial Revolution and subsequent population boom of the nineteenth and twentieth centuries accelerated demand for animal protein, catalyzing a dramatic transformation in how meat is produced. By the mid-twentieth century, concentrated animal feeding operations (CAFOs) began replacing traditional pastoral systems across much of the industrialized world, concentrating thousands of animals in confined spaces to maximize output per unit of capital. Understanding this historical trajectory is essential for evaluating the environmental trade-offs embedded in contemporary meat production.
~8000 BCE • Livestock Domestication
1800s • Industrialized Ranching
1950s • Rise of CAFOs
2006 • Livestock's Long Shadow
2020s • Alternative Proteins Emerge
This historical arc raises a central question for environmental science: how do different meat production methods—from free-range grazing to concentrated feedlots—differ in their land use, water consumption, energy inputs, pollution outputs, and contributions to climate change? The answer informs policy decisions about sustainable food systems worldwide.
SECTION 2
Core Principles & Definitions
At its foundation, meat production involves converting feed energy and water into animal biomass that humans consume as protein. The efficiency of this conversion, the spatial footprint required, and the waste generated vary enormously across production systems. Several core principles govern how environmental scientists evaluate these systems.
Feed Conversion Ratio (FCR)
Trophic Efficiency
CAFO vs. Pasture-Raised
Externalities
Virtual Water & Ecological Footprint
KEY TAKEAWAY
SECTION 3
Visual Explanation: Comparing Production Systems
The diagram above illustrates a recurring theme in environmental science: trade-offs between efficiency and ecological integrity. CAFOs minimize the physical footprint per unit of meat produced, but they concentrate waste streams—manure, antibiotics, and excess nutrients—in ways that overwhelm local ecosystems. Pasture-raised systems distribute animals across broader landscapes, often maintaining soil health through managed rotational grazing, yet they demand far more land per kilogram of meat. For the AP exam, you should be able to articulate both sides of this trade-off and connect them to broader concepts such as eutrophication, deforestation, and carbon cycling.
SECTION 4
How Meat Production Drives Environmental Change
Although meat production is not typically analyzed through a single unifying equation, several quantitative relationships help environmental scientists assess its ecological costs. The feed conversion ratio provides a direct measure of how efficiently an animal converts feed biomass into edible product. Meanwhile, water and carbon footprint calculations integrate multiple inputs across an animal's entire life cycle.
FEED CONVERSION RATIO
Typical values: beef cattle ≈ 6–8, pigs ≈ 3–4, poultry ≈ 1.6–2.2. Lower FCR indicates higher efficiency. Feed includes grains, soy, and supplements.
TROPHIC LEVEL ENERGY LOSS
Where E_input is solar energy captured by primary producers, and n is the number of trophic transfers. For grain-fed beef (plant → cow → human), n = 2, so only about 1% of original energy reaches the consumer.
VIRTUAL WATER FOOTPRINT
W_feed accounts for irrigation of feed crops (by far the largest component), W_drinking is water consumed by the animal, and W_service includes water used for cleaning facilities. For 1 kg of beef: W_total ≈ 15,400 L; for 1 kg of chicken: W_total ≈ 4,300 L.
The greenhouse gas profile of meat production involves three major gases. Methane (CH₄) is produced via enteric fermentation in ruminant digestive systems—cattle, sheep, and goats house methanogenic archaea in their rumens that break down cellulose and release CH₄ as a byproduct. Nitrous oxide (N₂O) arises from manure management and the application of nitrogen fertilizers on feed crops. Carbon dioxide (CO₂) is released through fossil fuel combustion for farm machinery, transportation, and feed processing, as well as through deforestation to create pastureland—especially in tropical regions such as the Amazon basin. Collectively, the FAO estimates that livestock supply chains contribute approximately 14.5% of global anthropogenic greenhouse gas emissions.
AP EXAM TIP
SECTION 5
Environmental Impacts by Livestock Type
Not all meat carries the same environmental burden. Ruminant animals—particularly beef cattle—impose substantially higher resource demands per kilogram of edible protein than monogastric species such as poultry or pigs. This disparity arises from differences in digestive physiology, growth rates, reproductive cycles, and feed requirements. The following diagram and table break down these differences across several environmental indicators.
| Metric | Beef | Pork | Chicken |
|---|---|---|---|
| GHG emissions (kg CO₂-eq per kg meat) | ~27 | ~12 | ~6.9 |
| Water footprint (L per kg meat) | ~15,400 | ~6,000 | ~4,300 |
| Land use (m² per kg meat) | ~164 | ~11 | ~7.1 |
| Feed conversion ratio (kg feed / kg gain) | ~7 | ~3.5 | ~2 |
| Primary GHG sources | Enteric CH₄, deforestation CO₂ | Manure N₂O, feed production | Feed production, energy use |
Comparative environmental footprint of major livestock categories per kilogram of edible meat
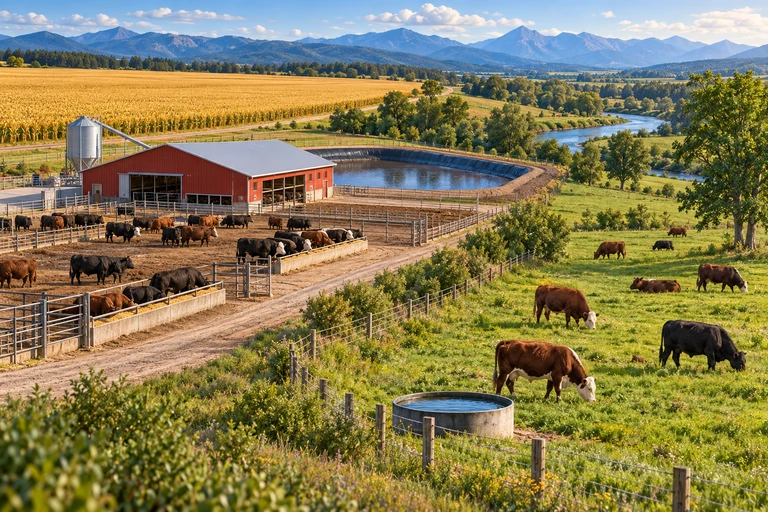
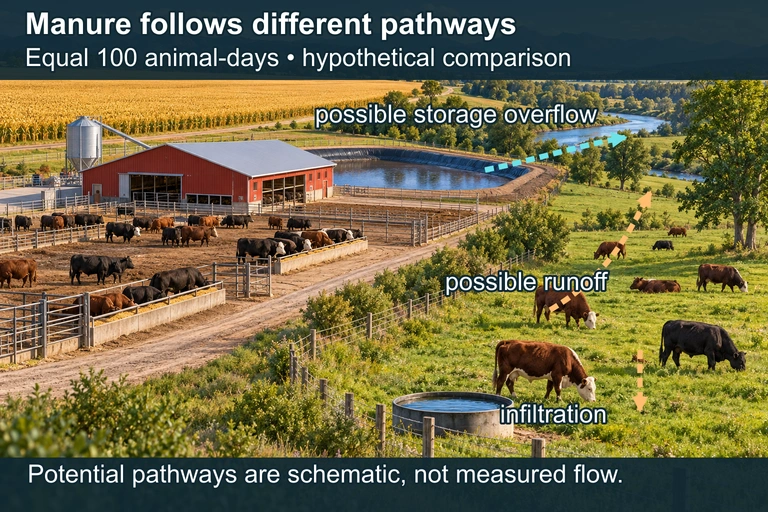 Concentrated storage and dispersed pasture deposition create different potential manure pathways. The equal-animal-day comparison is schematic and does not show a measured pollution ranking.
SECTION 6
Worked Example: Calculating Water and Land Footprints
On the AP Environmental Science exam, you may be asked to perform quantitative comparisons between meat production systems. The following worked example mirrors the style of an FRQ calculation prompt.
Comparing the Water Footprint of Beef vs. Chicken
- 1
Step 1 — Identify Given Values
A family consumes 2 kg of meat per week. We want to calculate the annual water savings if the family switches from beef to chicken. Water footprint of beef ≈ 15,400 L/kg; water footprint of chicken ≈ 4,300 L/kg. - 2
Step 2 — Calculate Annual Meat Consumption
Annual consumption = 2 kg/week × 52 weeks/year = 104 kg/year.104 kg/year - 3
Step 3 — Calculate Water Use for Beef
W_beef = 104 kg × 15,400 L/kg = 1,601,600 L/year.1,601,600 L/year for beef - 4
Step 4 — Calculate Water Use for Chicken
W_chicken = 104 kg × 4,300 L/kg = 447,200 L/year.447,200 L/year for chicken - 5
Step 5 — Calculate Savings
Water savings = 1,601,600 − 447,200 = 1,154,400 L/year. This represents a reduction of approximately 72%, illustrating how substituting a lower-FCR animal dramatically reduces virtual water consumption.Annual savings ≈ 1,154,400 L (72% reduction)
SECTION 7
Strengths, Limitations & Trade-offs
Evaluating meat production methods requires weighing multiple dimensions simultaneously. A system that excels in one metric—such as land-use efficiency—may perform poorly in another, such as animal welfare or pollution concentration. The table below synthesizes the key trade-offs between the three dominant production paradigms.
| Criterion | CAFO / Feedlot | Pasture-Raised | Mixed / Integrated |
|---|---|---|---|
| Production efficiency | High output per unit area; rapid weight gain from optimized feed | Lower output per hectare; slower growth on forage diets | Moderate; combines grazing with supplemental grain finishing |
| Water pollution | Manure lagoons risk nutrient runoff, causing eutrophication and dead zones | Dispersed waste; lower risk if stocking density is managed | Intermediate risk depending on management practices |
| GHG emissions | Lower CH₄ per kg (grain diet) but high embedded CO₂ from feed transport and grain production | Higher enteric CH₄ per kg (forage diet produces more methane), but possible soil carbon sequestration | Variable; depends on ratio of grazing to feedlot finishing time |
| Biodiversity | Feed-crop monocultures reduce habitat diversity; pesticide use harms pollinators | Can coexist with grassland biodiversity if well-managed; overgrazing degrades habitat | Moderate; depends on local ecosystem and management intensity |
| Antibiotic resistance | Routine subtherapeutic use accelerates resistance gene development | Minimal routine use; therapeutic applications only | Lower overall use than CAFOs |
| Scalability | Highly scalable; meets global demand at lower cost per unit | Limited by available grassland; cannot meet current global demand alone | Moderate scalability; requires diverse land types |
Comparative trade-offs among major meat production methods
KEY TAKEAWAY
 Compare cattle-production systems using the same product basis and system boundary. For a kilogram of edible protein, on-site land alone omits upstream feed production; lifecycle comparisons also consider water, energy, manure, methane and land conversion.
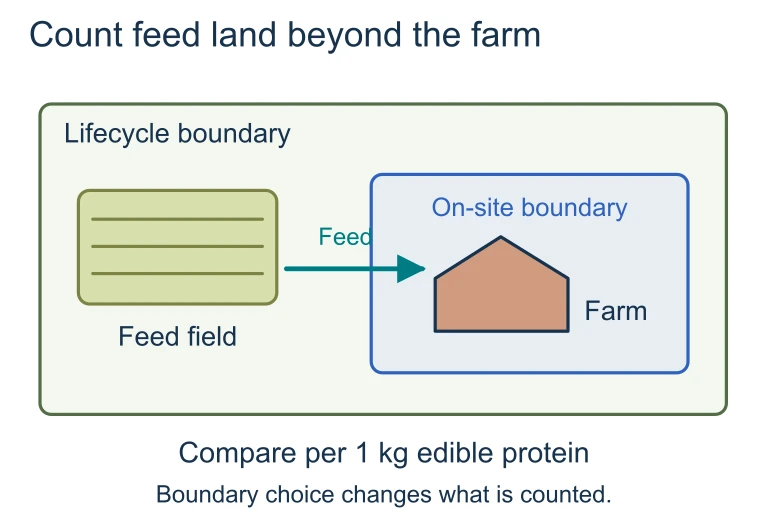 Compare cattle-production systems using the same product basis and system boundary. For a kilogram of edible protein, on-site land alone omits upstream feed production; lifecycle comparisons also consider water, energy, manure, methane and land conversion.
SECTION 8
Connections to Sustainability & Emerging Alternatives
The environmental challenges posed by conventional meat production have spurred exploration of alternatives and policy interventions that connect directly to broader AP Environmental Science themes. Rotational grazing aims to mimic natural herbivore migration patterns, allowing pastures to recover between grazing periods and potentially sequestering carbon in grassland soils. Cultured (lab-grown) meat eliminates the animal entirely by growing muscle tissue from stem cells in bioreactors, drastically reducing land and water use in preliminary life-cycle assessments, though energy inputs remain significant. Plant-based protein substitutes circumvent trophic inefficiency altogether by providing protein directly from crops, but their market adoption depends on consumer acceptance and taste technology.
| Approach | Potential Benefit | Current Limitation |
|---|---|---|
| Rotational / adaptive grazing | Soil carbon sequestration; improved grassland biodiversity | Net carbon balance debated; requires skilled management and large land area |
| Cultured (lab-grown) meat | Up to 96% less land, 82–96% less water per kg vs. conventional beef | High energy demand for bioreactors; scalability and cost not yet competitive |
| Plant-based protein | Bypasses trophic level losses; lowest overall resource footprint | Consumer acceptance barriers; may still require monoculture cropland |
| Insect farming | Very low FCR (~1.7); can be raised on organic waste streams | Cultural resistance in Western markets; regulatory frameworks undeveloped |
| Methane-reducing feed additives | Can reduce enteric CH₄ by 30–80% (e.g., 3-NOP, seaweed supplements) | Long-term effects on animal health and milk/meat quality under study |
Emerging approaches to reducing the environmental footprint of protein production
These innovations connect to the broader AP Environmental Science themes of sustainability and resource management. On the exam, you may be asked to evaluate a proposed solution for reducing the environmental impact of meat production and to identify both its benefits and potential unintended consequences—a skill that requires understanding the full systems-level picture presented in this lesson.
SECTION 9
Practice Problems
Question 1: CONCEPTUAL
- A. Cattle are raised exclusively in CAFOs, while poultry are always pasture-raised.
- B. Cattle are ruminants that produce significant methane through enteric fermentation and have a higher feed conversion ratio than poultry.
- C. Poultry consume more water per kilogram of body mass gained than cattle.
- D. Cattle grow faster than poultry, requiring more energy per unit time.
Show answer (B)
Question 2: BASIC CALCULATION
- A. 714 kg
- B. 7,143 kg
- C. 50,000 kg
- D. 350,000 kg
Show answer (B)
Question 3: INTERMEDIATE
- A. Decreased total methane emissions due to lower enteric fermentation on grain-based diets, but increased risk of localized water pollution from concentrated manure.
- B. Increased biodiversity on the former pastureland and decreased need for imported feed grains.
- C. Elimination of all greenhouse gas emissions from the operation.
- D. Reduced water consumption overall because confined animals require less drinking water.
Show answer (A)
Question 4: APPLIED
4 ptsShow answer
Question 5: CRITICAL THINKING
5 ptsShow answer
SUMMARY
Lesson Summary
Summary
Meat production methods span a spectrum from concentrated animal feeding operations (CAFOs) to pasture-raised and free-range systems, each presenting distinct environmental trade-offs. CAFOs maximize production efficiency per unit area but concentrate waste, amplify water pollution risks, and accelerate antibiotic resistance. Pasture systems use more land but can support grassland biodiversity when managed responsibly. The key quantitative tools for comparing systems include the feed conversion ratio (FCR), virtual water footprint, and greenhouse gas emissions per kilogram of meat.
Beef production consistently shows the highest environmental footprint across all metrics due to cattle's status as ruminants with high enteric methane emissions and slow growth rates. Emerging alternatives—including cultured meat, plant-based proteins, and methane-reducing feed additives—offer promising pathways to reduce the ecological burden of global protein production but face scalability, cost, and consumer-acceptance challenges. For the AP exam, be prepared to compare production systems quantitatively, identify specific pollutants and their pathways, and evaluate proposed solutions with attention to both benefits and unintended consequences.