

SECTION 1
Historical Context & Motivation
Ecologists have long observed a striking paradox: some organisms produce millions of offspring yet invest almost nothing in each one, while others devote years of parental care to a single young. This variation in life-history strategy is not random — it reflects millions of years of natural selection acting under different environmental pressures. The theoretical framework that explains this trade-off grew out of mid-twentieth-century population ecology, when mathematicians and field biologists began formalizing the relationship between reproductive output, survivorship, and population regulation.
1838 • Verhulst's Logistic Equation
1950s • Island Biogeography Work Begins
1967 • r/K Selection Theory Formalized
1970 • Pianka's Comparative Framework
2002 • Modern Refinements
The central question that r/K selection theory addresses is deceptively simple: Why do some species invest in quantity of offspring while others invest in quality? The answer lies in how the parameters r (intrinsic rate of natural increase) and K (carrying capacity) from the logistic growth equation act as selective pressures in different ecological contexts.
SECTION 2
Core Principles & Definitions
The r/K selection framework is rooted in the logistic growth model, which describes how populations grow rapidly when resources are abundant and slow as they approach carrying capacity. The two parameters in that model — r and K — represent competing evolutionary pressures. In unstable or unpredictable environments where populations are often far below K, natural selection favors traits that maximize r. In stable, crowded environments near K, selection favors traits that enhance competitive ability and efficient resource use.
r-Selected Species
K-Selected Species
The r/K Continuum
Survivorship Curves
Environmental Drivers
SECTION 3
Visual Explanation — Survivorship Curves
The survivorship curve diagram captures one of the most important ecological consequences of r/K selection. A Type I curve characterizes K-selected species such as elephants and humans, where heavy parental investment ensures that the vast majority of offspring survive to reproductive age, and mortality concentrates in post-reproductive life. The Type III curve typifies r-selected species like oysters and most annual plants: thousands of offspring are produced, most die before reaching maturity, and the few survivors that do make it may live reasonably long lives. Type II curves, exhibited by many birds and small mammals, represent an intermediate strategy with a constant probability of death at any age. When you see population data on the AP exam, recognizing the survivorship curve shape immediately tells you about a species' reproductive strategy.
SECTION 4
Mathematical Framework — The Logistic Model
The names "r-selected" and "K-selected" derive directly from the two key parameters in the logistic growth equation. Understanding this equation is essential because it reveals why the r/K trade-off exists mathematically.
EXPONENTIAL GROWTH
Where N = population size, r = intrinsic rate of natural increase (births − deaths per capita), and t = time. This models unlimited growth — the ideal for r-selected species.
LOGISTIC GROWTH
The term (K − N)/K is the environmental resistance factor. As N approaches K, growth slows to zero. K = carrying capacity of the environment.
MAXIMUM GROWTH RATE
The population grows fastest at half the carrying capacity. This is the inflection point of the logistic S-curve and is frequently tested on the AP exam.
When a population is far below K (i.e., N ≪ K), the fraction (K − N)/K approaches 1, and logistic growth approximates exponential growth. In this regime, species with the highest r values dominate — hence "r-selected." Conversely, when population density is high and N is near K, the growth rate approaches zero regardless of r, and competitive efficiency determines success — hence "K-selected." This mathematical insight explains why early colonizers of disturbed habitats tend to be r-strategists, while climax-community species tend to be K-strategists.
POPULATION GROWTH RATE (DISCRETE)
For discrete generations (common with r-selected species), λ (lambda) is the finite rate of increase. When λ > 1, the population grows; when λ < 1, it declines. The relationship to r is: λ = er.
SECTION 5
Detailed Trait Comparison — r vs. K
| Characteristic | r-Selected | K-Selected |
|---|---|---|
| Offspring number | Many (hundreds to millions) | Few (1–2 per reproductive event) |
| Offspring size | Small | Large |
| Parental care | None or minimal | Extensive, prolonged |
| Age at first reproduction | Early | Late |
| Lifespan | Short | Long |
| Body size | Generally small | Generally large |
| Population growth pattern | Boom-and-bust; J-curve | Stable near K; S-curve |
| Mortality regulation | Density-independent (storms, drought) | Density-dependent (competition, disease) |
| Survivorship curve | Type III | Type I |
| Typical habitat | Unpredictable, disturbed | Stable, competitive |
Comprehensive trait comparison of r-selected vs. K-selected species
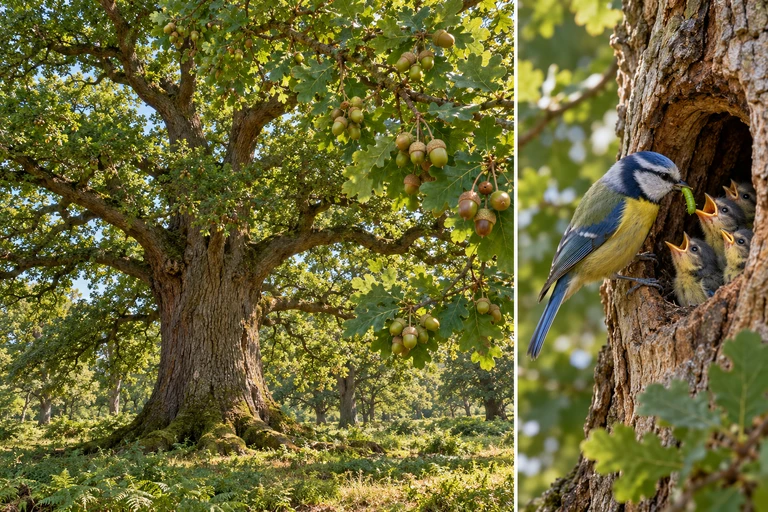 English oak combines long life with many acorns, while blue tits invest in feeding dependent chicks. Comparing traits separately reveals combinations that a single r/K label can conceal.
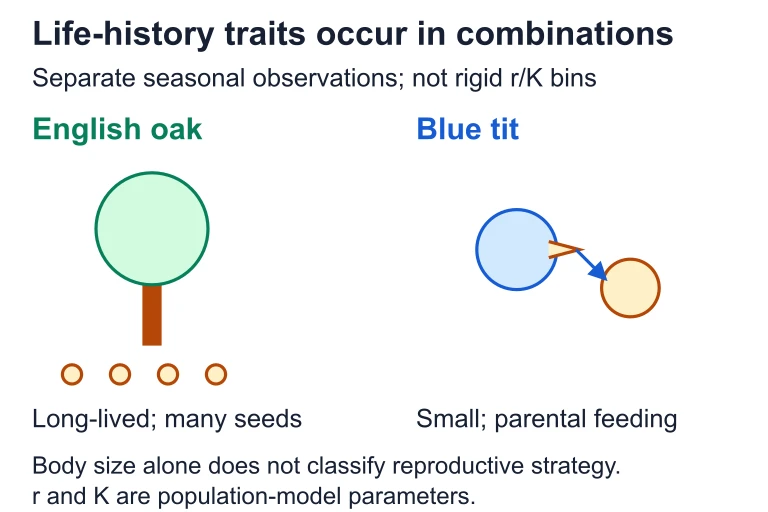 English oak combines long life with many acorns, while blue tits invest in feeding dependent chicks. Comparing traits separately reveals combinations that a single r/K label can conceal.
SECTION 6
Worked Example — Population Growth Analysis
A wildlife manager is comparing two populations: a colony of rabbits (relatively r-selected among mammals) and a herd of bison (relatively K-selected). Both populations currently number 50 individuals. The rabbit population has r = 1.0 per year and K = 500. The bison population has r = 0.05 per year and K = 200. Calculate the population growth rate (dN/dt) for each species and discuss the ecological implications.
Worked example
- 1
Step 1 — Identify Given Values
Rabbits: N = 50, r = 1.0/yr, K = 500. Bison: N = 50, r = 0.05/yr, K = 200. We apply the logistic equation dN/dt = rN((K − N)/K) to each. - 2
Step 2 — Calculate for Rabbits
dN/dt = (1.0)(50) × ((500 − 50)/500) = 50 × (450/500) = 50 × 0.90 = 45 rabbits/year. Because N is far below K (only 10% of carrying capacity), the environmental resistance term is close to 1 and growth is nearly exponential.dN/dt (rabbits) = 45 individuals/year - 3
Step 3 — Calculate for Bison
dN/dt = (0.05)(50) × ((200 − 50)/200) = 2.5 × (150/200) = 2.5 × 0.75 = 1.875 bison/year. The much lower r value and the fact that 50 individuals already represents 25% of K both reduce the growth rate substantially.dN/dt (bison) ≈ 1.9 individuals/year - 4
Step 4 — Interpret Ecological Implications
The rabbit population grows roughly 24 times faster than the bison herd, illustrating why r-selected species recover quickly after disturbances and why K-selected species are far more vulnerable to population crashes. If a drought killed 40 of 50 individuals in each population, the rabbits could rebound within a few years, while the bison might take decades — a critical insight for conservation management.r-selected species recover from disturbance far more rapidly than K-selected species
SECTION 7
Strengths & Limitations of r/K Theory
| Strengths | Limitations |
|---|---|
| Provides an intuitive, accessible framework for comparing life-history strategies across diverse taxa | Oversimplifies complex life histories into a binary; many species do not fit neatly (e.g., sea turtles, coconut palms) |
| Directly tied to the well-established logistic growth equation, giving it mathematical rigor | Assumes environmental stability or instability is the primary selective pressure, ignoring predation, sexual selection, and phylogenetic constraints |
| Effective for predicting which species are most vulnerable to extinction and which become invasive | Empirical tests have shown poor predictive power for many taxa; correlations between r/K traits are weaker than predicted |
| Useful pedagogical tool for understanding density-dependent vs. density-independent regulation | Largely superseded in academic ecology by more nuanced life-history models (e.g., bet-hedging, demographic stochasticity frameworks) |
Evaluation of the r/K selection framework
Key takeaway
SECTION 8
Conservation Applications & Advanced Connections
The r/K framework has direct, practical implications for conservation biology and invasive species management. K-selected species — with their long generation times, low fecundity, and slow recovery rates — are disproportionately represented on endangered species lists. Elephants, rhinoceroses, great apes, and large cetaceans all share K-selected traits that make them exceptionally vulnerable to habitat loss, poaching, and climate change. Conversely, many of the world's most problematic invasive species — zebra mussels, kudzu, starlings, and cane toads — exhibit classic r-selected traits: rapid reproduction, high dispersal ability, and tolerance for a wide range of environmental conditions.
| Application Area | r-Selected Implications | K-Selected Implications |
|---|---|---|
| Endangered species | Rarely endangered; populations rebound quickly after disturbance | Highly vulnerable; slow recovery makes extinction risk much greater |
| Invasive species | Often invasive; rapid reproduction allows colonization of new habitats | Rarely invasive; low dispersal and slow growth limit establishment |
| Ecological succession | Pioneer species in early succession; colonize disturbed areas first | Climax community species; dominate stable, mature ecosystems |
| Pest management | Pest species (insects, rodents) often r-selected — chemical and biological controls needed | Rarely pests; management focuses on habitat preservation |
| Climate change response | May adapt rapidly due to short generation times and high genetic variation | Adapt slowly; reliance on stable conditions makes them more vulnerable |
Real-world conservation and management applications of r/K theory
SECTION 9
Practice Problems
Question 1: CONCEPTUAL
- A. K-selected, because it is a vertebrate with a defined lifespan
- B. r-selected, because it matures early, produces many offspring, and provides no parental care
- C. K-selected, because fish are generally long-lived and competitive
- D. r-selected, because it has a Type I survivorship curve
Show answer (B)
Question 2: BASIC CALCULATION
- A. 80 individuals/month
- B. 100 individuals/month
- C. 50 individuals/month
- D. 160 individuals/month
Show answer (A)
Question 3: INTERMEDIATE
- A. K-selected species colonize first, followed by r-selected species as the ecosystem matures
- B. r-selected pioneer species colonize first, gradually replaced by K-selected climax species as the environment stabilizes
- C. Only r-selected species can survive on volcanic islands regardless of succession stage
- D. K-selected and r-selected species arrive simultaneously because dispersal is random
Show answer (B)
Question 4: APPLIED
Show answer
Question 5: CRITICAL THINKING