

SECTION 1
Historical Context & Motivation
For centuries, naturalists noticed a curious pattern: oceanic islands tend to harbor fewer species than comparable areas on the mainland, yet the species they do support are often found nowhere else on Earth. Charles Darwin's observations in the Galápagos and Alfred Russel Wallace's surveys of the Malay Archipelago laid the qualitative groundwork, but a predictive, quantitative framework did not emerge until the mid-twentieth century. The question that drove early biogeographers was deceptively simple—why do some islands have more species than others? Answering it required moving beyond species lists and toward the dynamic processes of colonization and extinction.
1835 • Darwin in the Galápagos
1876 • Wallace's Biogeographic Regions
1963 • MacArthur & Wilson's Theory
1967 • The Theory of Island Biogeography (book)
1969 • Simberloff & Wilson's Defaunation Experiment
The MacArthur–Wilson framework transformed ecology by treating species richness not as a fixed attribute of a place but as the outcome of two opposing processes—immigration and extinction—that continuously adjust toward an equilibrium number of species. This dynamic perspective also opened a powerful analogy: habitat fragments on the mainland can be modeled as 'islands' in a 'sea' of inhospitable land, an insight that now lies at the heart of modern conservation biology and the design of nature reserves.
SECTION 2
Core Principles & Definitions
The Theory of Island Biogeography rests on a small set of elegant ideas that, taken together, predict how many species an island will support at equilibrium. Understanding each principle individually is essential before exploring the mathematics and conservation applications that follow.
Immigration Rate
Extinction Rate
Dynamic Equilibrium
Distance Effect
Area Effect
KEY TAKEAWAY
Two additional nuances are worth noting. First, the model treats the mainland as an effectively infinite source pool of species whose composition does not change. Second, species turnover at equilibrium means the set of species on the island is not static; the rate at which new species replace extinct ones is called the turnover rate, and it is highest on small, near islands where both immigration and extinction rates are elevated.
SECTION 3
The Equilibrium Model—Visualized
The most iconic diagram in island biogeography is the crossing of immigration and extinction curves. The graph below illustrates four scenarios by combining two levels of island size (large vs. small) with two levels of distance from the mainland (near vs. far). Where each immigration curve crosses each extinction curve, a distinct equilibrium species number (Ŝ) is predicted.
Several features of this diagram deserve emphasis. First, the immigration curve is concave-up because as species accumulate, the probability that the next colonist represents a species already present increases, reducing the effective immigration of new species. Second, the extinction curve is concave-down because each additional species added to a crowded island faces disproportionately more competition for finite resources. Third, the turnover rate at equilibrium equals the y-value where the curves intersect: small, near islands have higher turnover than large, far islands even though the latter may support more total species.
 Species richness can stay the same across two snapshots even though one species disappears and another arrives. A stable count can therefore accompany continuing turnover.
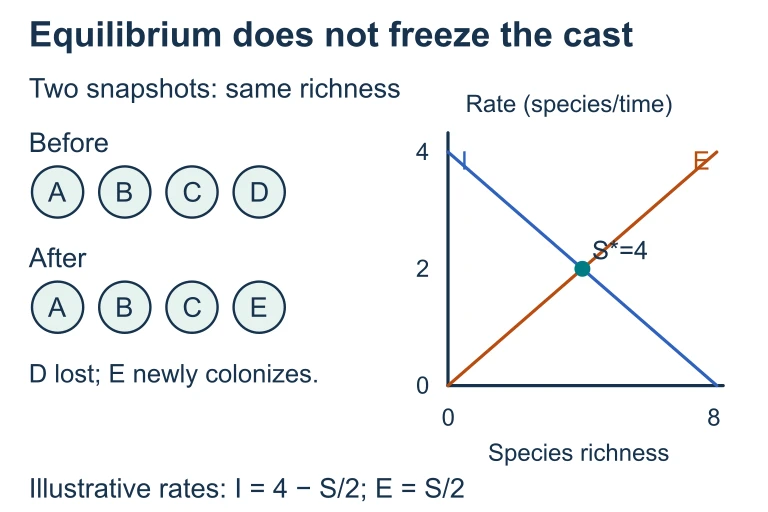 Species richness can stay the same across two snapshots even though one species disappears and another arrives. A stable count can therefore accompany continuing turnover.
SECTION 4
Mathematical Framework
While the AP Environmental Science exam does not require you to derive the equilibrium model, a quantitative familiarity with the species–area relationship and the logic of equilibrium is expected. Two key equations underpin island biogeography.
SPECIES–AREA RELATIONSHIP
Where S = number of species, A = area of the island (km²), c = a taxon- and region-specific constant, and z = the slope of the species–area curve on a log–log plot (typically 0.20–0.35 for oceanic islands).
Taking the logarithm of both sides yields a linear relationship: log S = log c + z × log A. When you plot log(species) against log(area) for a group of islands, the data fall along a straight line with slope z and y-intercept log c. A higher z means species richness is more sensitive to area; isolated archipelagoes typically have steeper slopes than mainland habitat patches.
EQUILIBRIUM CONDITION
At equilibrium, the immigration rate I(S) equals the extinction rate E(S). Both are functions of the current number of species S. The equilibrium species richness Ŝ is the value of S where I(S) = E(S).
AP EXAM TIP
SECTION 5
Habitat Fragments as Virtual Islands
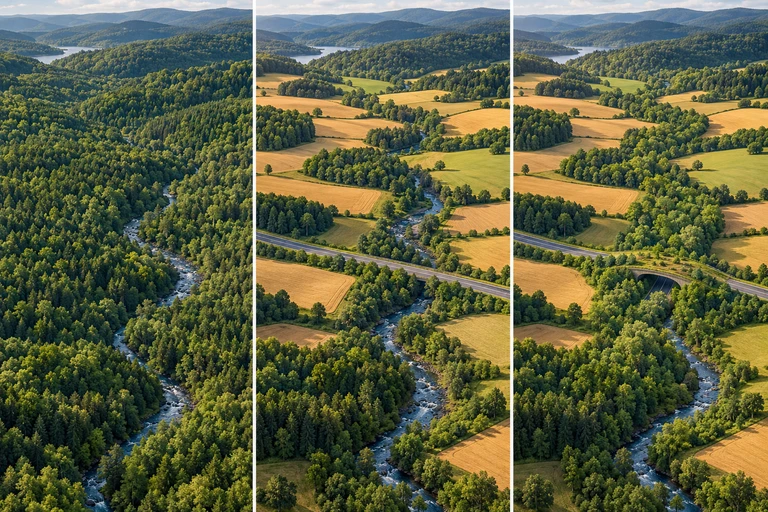
One of the most far-reaching applications of island biogeography is its extension to habitat fragmentation on the mainland. When a continuous forest is broken into patches by roads, agriculture, or urban development, each patch behaves like an island surrounded by an inhospitable 'sea' of altered landscape. The same principles apply: smaller patches lose species faster, and more isolated patches receive fewer immigrants. This analogy has guided the design of nature reserves and wildlife corridors for decades.
The SLOSS debate (Single Large Or Several Small) has been one of conservation biology's longest-running discussions. MacArthur–Wilson theory originally favored a single large reserve because of lower extinction rates. However, ecologists such as Dan Simberloff pointed out that several small reserves can capture more habitat diversity and protect against catastrophic events—a wildfire that burns one reserve may leave others intact. Modern consensus recognizes that the optimal strategy depends on the landscape context, the target taxa, and the degree of connectivity among patches. Wildlife corridors—strips of habitat connecting fragments—can provide the benefits of both approaches by allowing gene flow and recolonization across a network of reserves.
SECTION 6
Worked Example: Predicting Species Loss from Habitat Reduction
A common AP-level application asks you to use the species–area relationship to estimate the effect of deforestation on species richness. Let's work through a representative problem step by step.
PROBLEM
Species–Area Calculation
- 1
Step 1 — Identify Given Values
Original area A₁ = 10,000 km². Original species count S₁ = 500. Reduced area A₂ = 1,000 km². The z-value = 0.30. - 2
Step 2 — Set Up the Ratio
Because S = cAz, we can write S₂ / S₁ = (A₂ / A₁)z. The constant c cancels out, which is extremely convenient because c is rarely known precisely. - 3
Step 3 — Calculate the Area Ratio
A₂ / A₁ = 1,000 / 10,000 = 0.10. The area has been reduced to 10% of its original extent.Area ratio = 0.10 - 4
Step 4 — Raise to the Power z
(A₂ / A₁)z = 0.100.30. Using a calculator: 0.100.30 = 10−0.30 ≈ 0.501.Species ratio ≈ 0.501 - 5
Step 5 — Compute New Species Count
S₂ = S₁ × 0.501 = 500 × 0.501 ≈ 251 species.≈ 251 bird species expected to survive - 6
Step 6 — Interpret the Result
Reducing the habitat by 90% eliminates approximately 50% of bird species. This is the hallmark of the species–area curve: species loss is not proportional to area loss but follows a power-law function. Even so, the loss of roughly 249 species from a single island would be catastrophic for regional biodiversity.
SECTION 7
Strengths & Limitations of the Model
Like all models, the Theory of Island Biogeography simplifies complex ecological reality to generate testable predictions. Understanding both its power and its blind spots is essential for applying it correctly on the AP exam and in real-world conservation planning.
| Strengths | Limitations |
|---|---|
| Provides a clear, quantitative prediction (Ŝ) testable with field data. | Treats all species as ecologically equivalent—ignores differences in dispersal ability, trophic level, and body size. |
| Successfully predicts broad patterns (species–area curves) across taxa and biomes. | Ignores speciation—important on large, ancient islands (e.g., Madagascar) where in-situ evolution adds species. |
| Applicable to mainland habitat fragments, guiding reserve design and corridor planning. | Assumes a homogeneous mainland source pool with constant composition—unrealistic for degraded mainland habitats. |
| Experimentally supported (Simberloff & Wilson mangrove island experiments; recolonization after volcanic eruptions). | Does not account for habitat heterogeneity within an island—a topographically complex island may support more species than a flat one of equal area. |
| Simple enough to be taught, applied, and communicated to policymakers. | Edge effects, matrix quality (the nature of the 'sea' around habitat islands), and disturbance regimes are not explicitly modeled. |
Strengths and limitations of the MacArthur–Wilson equilibrium model
KEY TAKEAWAY
SECTION 8
Connections to Modern Conservation Biology
Island biogeography does not exist in an intellectual vacuum—it connects directly to several advanced ecological concepts that appear across the APES curriculum and in current research. The table below maps each core idea from island biogeography to its broader conservation counterpart.
| Island Biogeography Concept | Advanced Conservation Application |
|---|---|
| Species–area relationship (S = cAz) | Predicting extinction debt — species that are doomed but haven't gone extinct yet after habitat loss. |
| Distance effect on immigration | Metapopulation theory — networks of subpopulations connected by dispersal; source–sink dynamics. |
| Area effect on extinction | Minimum viable population (MVP) analysis — below a critical area, populations become too small to avoid inbreeding depression and stochastic extinction. |
| Dynamic equilibrium / turnover | Landscape ecology — understanding how habitat mosaics, edge effects, and disturbance regimes influence biodiversity over time. |
| Reserve design (SLOSS, corridors) | Systematic conservation planning — tools like Marxan use species–area relationships and connectivity models to optimize reserve networks globally. |
Island biogeography concepts mapped to modern conservation applications
Perhaps the most urgent contemporary application is the concept of extinction debt. When a habitat is reduced, the species–area relationship predicts a new, lower equilibrium. However, species do not vanish instantly; some persist for years or decades in populations too small to be viable in the long run. These 'living dead' species represent a debt that nature will eventually 'collect.' Recognizing extinction debt is critical because it means current species counts in recently fragmented habitats overestimate the long-term biodiversity those habitats can sustain, creating a false sense of security if used uncritically in conservation assessments.
 Equal total reserve area can conceal differences in core habitat. With a one-unit edge zone, one 10-by-10 square retains 64 square units of core, while four 5-by-5 squares retain 36 in total.
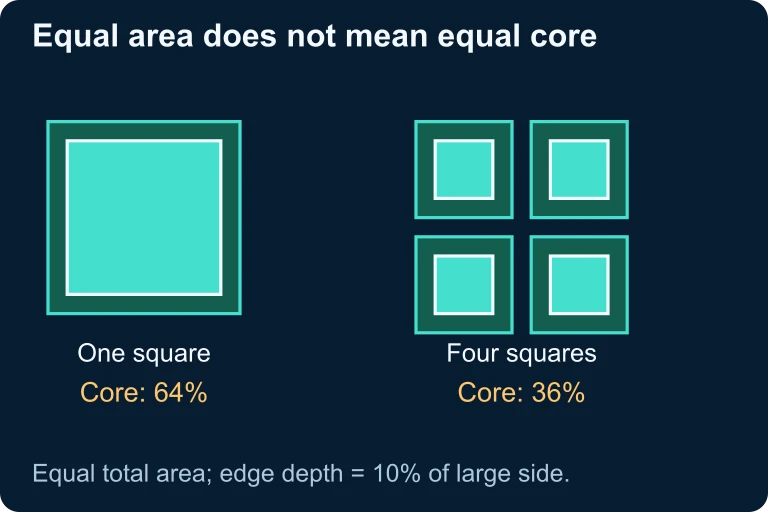 With a one-unit edge depth, one 10-by-10 square contains 64 square units of core. Four 5-by-5 squares have the same total area but only 36 square units of core.
SECTION 9
Practice Problems
Question 1: CONCEPTUAL
- A. A small island far from the mainland
- B. A large island far from the mainland
- C. A small island near the mainland
- D. A large island near the mainland
Show answer (D)
Question 2: BASIC CALCULATION
- A. 20 species
- B. 112 species
- C. 150 species
- D. 178 species
Show answer (B)
Question 3: INTERMEDIATE
- A. The z-value for this region must be higher than assumed
- B. Extinction debt—species committed to extinction have not yet disappeared
- C. Edge effects have increased habitat diversity
- D. Immigration from the surrounding matrix has added new species
Show answer (B)
Question 4: APPLIED
4 ptsShow answer
Question 5: CRITICAL THINKING
4 ptsShow answer
SUMMARY
Summary
Summary
The Theory of Island Biogeography, developed by MacArthur and Wilson in the 1960s, predicts that an island's species richness reaches a dynamic equilibrium where the immigration rate of new species equals the extinction rate of established species. Two key factors determine the equilibrium number: the distance effect (farther islands receive fewer colonists) and the area effect (larger islands have lower extinction). The quantitative backbone of the theory is the species–area relationship (S = cAz), which enables predictions of species loss following habitat reduction.
Beyond oceanic islands, this framework applies to any insular habitat—habitat fragments, mountaintops, lakes, and nature reserves—making it central to conservation biology. Key design principles favor reserves that are large, close together, connected by corridors, and round in shape. The concept of extinction debt warns that present species counts may overestimate the long-term viability of fragmented landscapes. For the AP exam, be prepared to interpret species–area graphs, perform calculations with S = cAz, explain the SLOSS debate, and connect island biogeography to real-world conservation scenarios involving species turnover and habitat fragmentation.