

SECTION 1
Historical Context & Motivation
Agriculture accounts for roughly 70 percent of global freshwater withdrawals, making irrigation the single largest anthropogenic demand on the hydrologic cycle. The methods humans have devised to move water from rivers, aquifers, and reservoirs onto cropland reflect both technological capability and ecological constraint. Understanding the evolution of irrigation is essential for evaluating modern water-use policy, because each method embodies a different trade-off between efficiency, cost, and environmental impact.
~6000 BCE • Mesopotamian Canal Systems
~300 BCE • Qanat Tunnels (Persia)
1930s • Center-Pivot Sprinkler Invented
1960s • Drip Irrigation Commercialized
2020s • Precision & Sensor-Based Irrigation
Despite millennia of innovation, water scarcity and soil degradation remain critical challenges. The central question this lesson addresses is: How do different irrigation methods compare in water-use efficiency, energy input, and environmental impact, and what trade-offs guide the choice among them?
SECTION 2
Core Principles & Definitions
Before comparing specific methods, it is useful to establish the foundational concepts that govern all irrigation systems. Every system must solve the same fundamental problem: delivering the right volume of water to the root zone of a crop at the right time, while minimizing losses to evaporation, runoff, and deep percolation beyond root reach.
Irrigation Efficiency
Evapotranspiration (ET)
Salinization
Waterlogging
Water Budget
SECTION 3
Visual Explanation — Irrigation Methods Compared
In the flood panel, water pools across the entire soil surface, exposing a large area to evaporation and allowing runoff at field margins. The sprinkler panel shows water arcing from a pressurized nozzle; while coverage is more uniform than flood, droplets are exposed to wind drift and mid-air evaporation. The drip panel illustrates emitters that release water at low pressure directly onto or into the soil near each plant's root zone, creating localized wetting bulbs (the blue ellipses). This targeted delivery is why drip systems achieve the highest efficiencies but also require the greatest infrastructure investment per hectare.
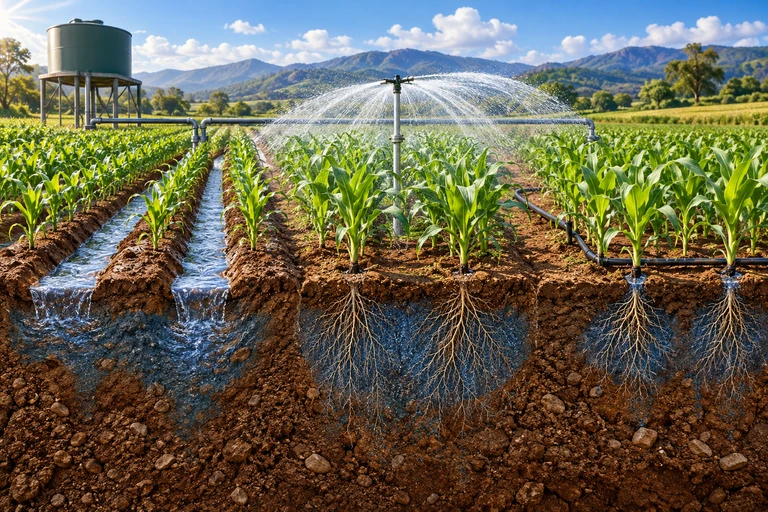 A crop can receive irrigation through surface channels, overhead spray or localized emitters. Delivery geometry changes the pathways and risks of runoff, evaporation, wind drift and deep percolation.
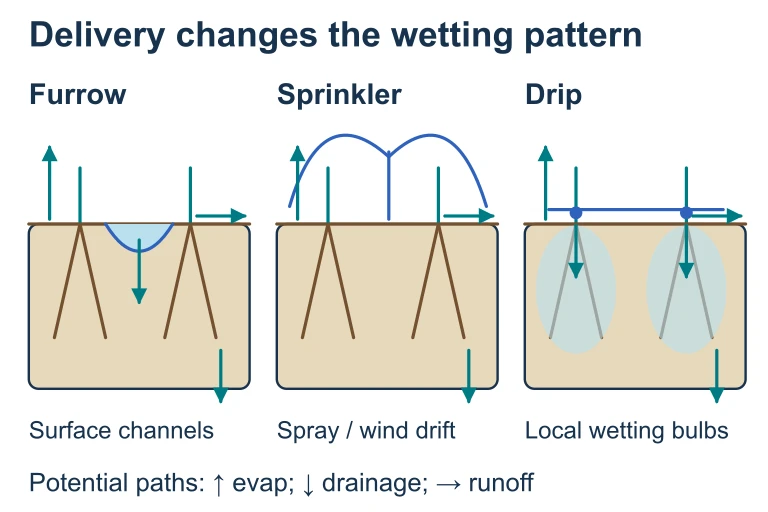 A crop can receive irrigation through surface channels, overhead spray or localized emitters. Delivery geometry changes the pathways and risks of runoff, evaporation, wind drift and deep percolation.
SECTION 4
Mathematical Framework — Water-Use Efficiency
Quantifying irrigation performance requires several interconnected calculations. The AP Environmental Science exam expects you to calculate water-use efficiency and determine volumes of water lost or consumed under different irrigation scenarios. Below are the key relationships.
IRRIGATION EFFICIENCY
"Beneficially used" primarily means crop evapotranspiration (ET). Losses include surface runoff, deep percolation below roots, and direct evaporation from wet soil or spray droplets.
WATER LOST
This relationship allows you to calculate waste volumes. If a farm applies 1,000 m³ at 60% efficiency, then 400 m³ is lost to runoff, evaporation, or deep percolation.
TOTAL WATER REQUIRED
If a crop's ET demand is 600 mm per season and you irrigate at 75% efficiency, you must apply 600 ÷ 0.75 = 800 mm total.
WATER SAVINGS FROM SWITCHING METHODS
Where e₁ = old efficiency (as a decimal) and e₂ = new efficiency. This equation is useful for policy analysis: how much water does a region conserve by upgrading from flood to drip?
SECTION 5
Detailed Classification of Irrigation Methods
Irrigation methods are generally grouped into three families: surface (gravity), overhead (sprinkler), and micro (drip/trickle). Within each family, variants exist. The diagram below summarizes this classification and lists key sub-types.
Surface methods rely on gravity, requiring minimal infrastructure—essentially just leveled fields and ditches—which is why they remain the most common approach globally, especially in developing nations. Furrow irrigation channels water between crop rows, slightly improving efficiency over full-field flooding. Sprinkler systems pressurize water through nozzles, simulating rainfall; the iconic center-pivot creates the circular crop patterns visible in satellite imagery of the U.S. Great Plains. Micro-irrigation targets individual plants, virtually eliminating runoff, but requires filtration and maintenance to prevent emitter clogging—making it best suited for high-value crops like fruits, vegetables, and vineyards.
SECTION 6
Worked Example — Calculating Water Savings
A common AP exam scenario asks you to determine how much water a farm can save by switching irrigation methods. Let's walk through a representative problem.
Worked example
- 1
Step 1 — Identify Given Values
A farm grows tomatoes on 50 hectares. The crop's seasonal ET demand is 600 mm. Currently, the farm uses flood irrigation at 50% efficiency. The farmer considers switching to drip irrigation at 90% efficiency. - 2
Step 2 — Calculate Total Water Applied Under Flood
Total water = ET ÷ efficiency = 600 mm ÷ 0.50 = 1,200 mm applied to each hectare. For 50 ha, convert to volume: 1,200 mm = 1.2 m depth. Volume = 1.2 m × 50 ha × 10,000 m²/ha = 600,000 m³.Flood total: 600,000 m³ per season - 3
Step 3 — Calculate Total Water Applied Under Drip
Total water = 600 mm ÷ 0.90 = 666.7 mm per hectare. Volume = 0.6667 m × 50 × 10,000 = 333,333 m³.Drip total: 333,333 m³ per season - 4
Step 4 — Calculate Water Saved
Savings = 600,000 − 333,333 = 266,667 m³ per season. That is a 44.4% reduction in total water withdrawals.Water saved ≈ 266,667 m³ (44.4% reduction) - 5
Step 5 — Interpret the Result
The switch conserves enough water to fill roughly 107 Olympic swimming pools. On the AP exam, you might be asked to discuss whether this saving justifies the higher capital cost of drip infrastructure, or to explain the downstream ecological benefits of leaving more water in the source river or aquifer.
SECTION 7
Strengths, Limitations & Environmental Impacts
| Criterion | Flood / Furrow | Sprinkler | Drip / Micro |
|---|---|---|---|
| Efficiency | 40–60% | 60–80% | 90–95% |
| Capital cost | Low | Moderate–High | High |
| Energy requirement | Minimal (gravity) | High (pumps) | Low–Moderate |
| Salinization risk | High | Moderate | Low |
| Waterlogging risk | High | Low–Moderate | Very low |
| Runoff / erosion | High | Moderate | Minimal |
| Best suited for | Rice paddies, flat land, low-value crops | Large fields, grain crops, rolling terrain | High-value row crops, orchards, arid regions |
Comparative summary of major irrigation methods
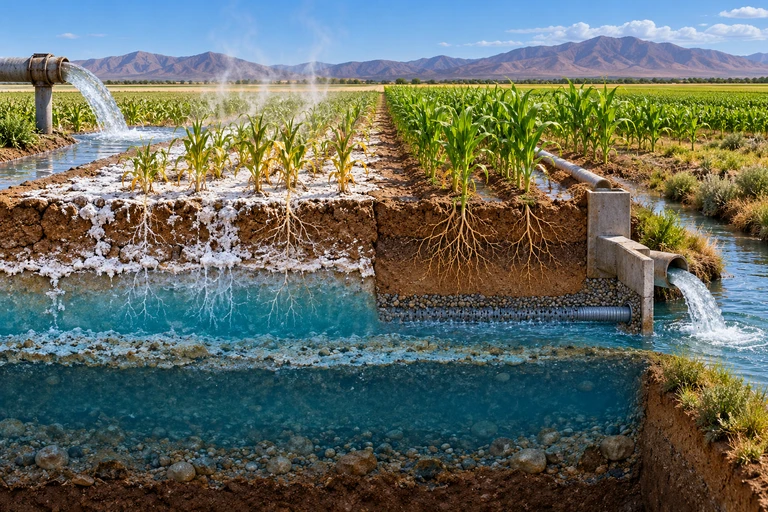 Waterlogging restricts root oxygen when pores remain saturated. Salinization concentrates salts already present in water or soil. These processes can occur together but have different mechanisms.
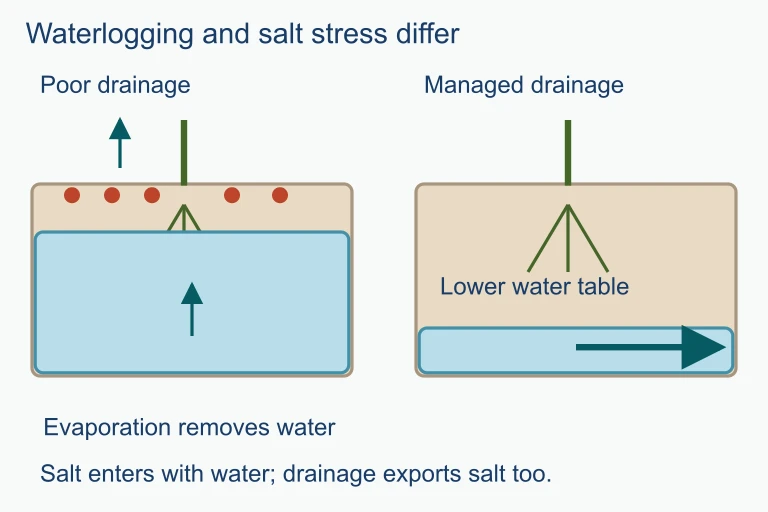 Waterlogging restricts root oxygen when pores remain saturated. Salinization concentrates salts already present in water or soil. These processes can occur together but have different mechanisms.
SECTION 8
Connections to Policy, Sustainability & Advanced Topics
Irrigation does not exist in a vacuum; it intersects with groundwater law, international water treaties, energy policy, and climate change adaptation. The AP Environmental Science exam frequently links irrigation to broader themes such as the tragedy of the commons (over-pumping shared aquifers), food–energy–water nexus, and ecological impacts of water diversion (e.g., the shrinking of the Aral Sea due to cotton irrigation withdrawals from the Amu Darya and Syr Darya rivers).
| Current Practice | Emerging / Advanced Approach |
|---|---|
| Timer-based sprinkler schedules | Sensor-driven precision irrigation using soil moisture probes and satellite ET data |
| Uniform application across a field | Variable-rate irrigation (VRI) adjusting depth pixel by pixel |
| Freshwater from rivers/aquifers | Treated wastewater reuse and desalination for agriculture |
| Gravity-fed surface irrigation | Solar-powered drip systems for smallholder farms in developing regions |
Current vs. emerging irrigation technologies
Looking ahead, climate models project that warming will intensify ET demand in many agricultural regions while simultaneously reducing reliable precipitation and snowpack. These trends make improving irrigation efficiency not merely an economic choice but an environmental imperative. Policy tools such as water pricing, cap-and-trade water markets, and subsidies for drip conversion are being tested worldwide as governments attempt to incentivize the shift away from wasteful surface irrigation.
SECTION 9
Practice Problems
Question 1: CONCEPTUAL
- A. Flood irrigation uses saltier source water than drip irrigation.
- B. Flood irrigation wets the entire soil surface, and as the large volume of standing water evaporates, dissolved salts accumulate in the upper soil layers.
- C. Drip irrigation removes salts from the soil through deep percolation at a higher rate than flood irrigation.
- D. Flood irrigation is always applied during the hottest part of the day, increasing evaporation and salt deposition.
Show answer (B)
Question 2: BASIC CALCULATION
- A. 200 mm
- B. 533 mm
- C. 600 mm
- D. 1,067 mm
Show answer (C)
Question 3: INTERMEDIATE
- A. 250 mm
- B. 500 mm
- C. 750 mm
- D. 1,000 mm
Show answer (B)
Question 4: APPLIED
Show answer
Question 5: CRITICAL THINKING