

SECTION 1
Historical Context & Motivation
Humans have transported organisms across biogeographic barriers for millennia, but the ecological consequences of these introductions only became a formal field of study in the twentieth century. The concept of invasive species refers to non-native organisms whose introduction causes or is likely to cause economic harm, environmental harm, or harm to human health. While not all introduced species become invasive—indeed, most fail to establish self-sustaining populations—those that do can fundamentally alter community structure, nutrient cycling, and trophic dynamics. Understanding the history of biological invasions reveals how global trade, colonization, and land-use change have accelerated a phenomenon that now ranks among the top drivers of global biodiversity loss.
1859 • European Rabbits in Australia
1890 • European Starlings in North America
1958 • Charles Elton's Foundational Text
1999 • Executive Order 13112
2023 • IPBES Global Assessment
This historical trajectory raises a central question for environmental scientists: what ecological traits and environmental conditions determine whether an introduced species becomes invasive, and how can we predict, prevent, and mitigate the damage these species cause to native ecosystems and the services they provide?
SECTION 2
Core Principles & Definitions
Before analyzing specific invasions, it is essential to distinguish among three related but distinct categories of organisms. A native species is one that occurs naturally in an ecosystem without human introduction. An introduced (non-native or exotic) species has been transported beyond its native range by human activity, whether intentionally or accidentally. An invasive species is a subset of introduced species that establishes, spreads, and causes measurable harm. Critically, not all introduced species become invasive—ecologists estimate that roughly only about 10% of introduced species establish viable populations, and roughly 10% of those become harmful invasives, a pattern sometimes called the "tens rule."
Pathways of Introduction
Traits of Successful Invaders
Characteristics of Vulnerable Ecosystems
Enemy Release Hypothesis
Ecological & Economic Impacts
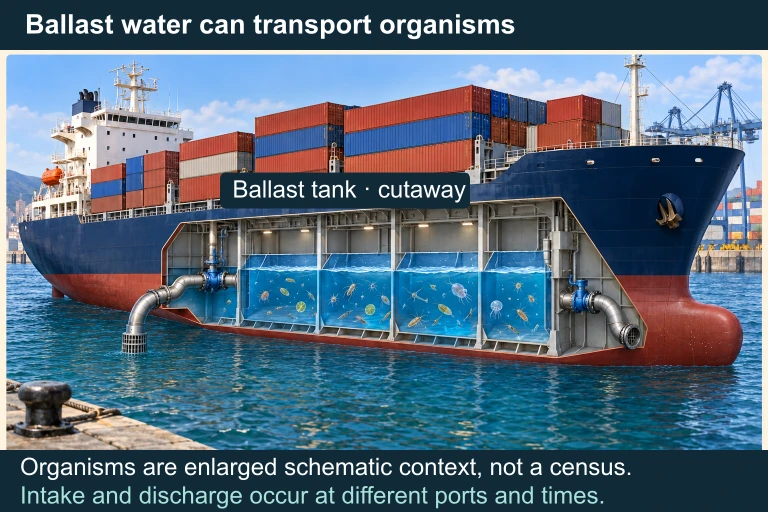 Ballast water can carry organisms between ports; survival, establishment and ecological effects are conditional. Prevention before discharge differs from management after establishment.
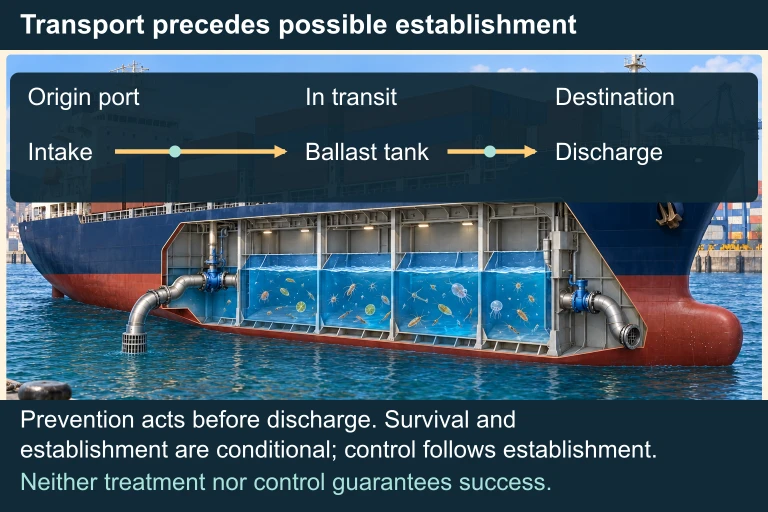 Ballast-water transfer can introduce organisms; survival and establishment are conditional. Prevention acts before discharge.
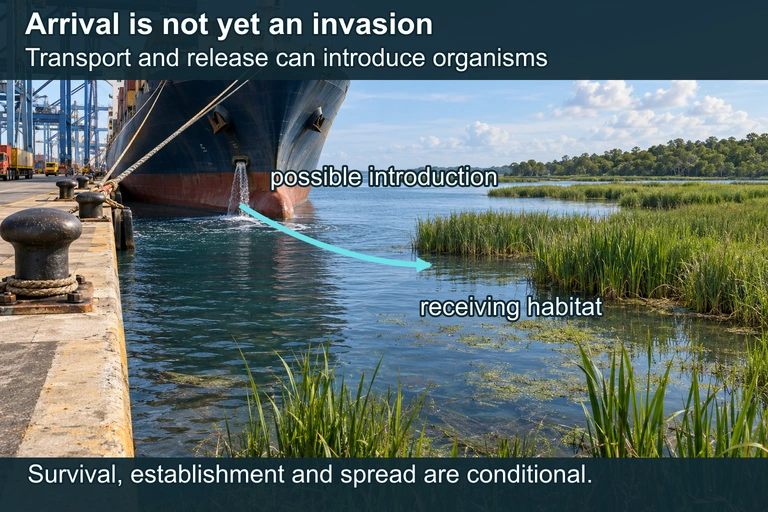 Introduction, survival, establishment, spread and harmful impact are separate conditional stages. Arrival outside a native range does not automatically establish an invasion.
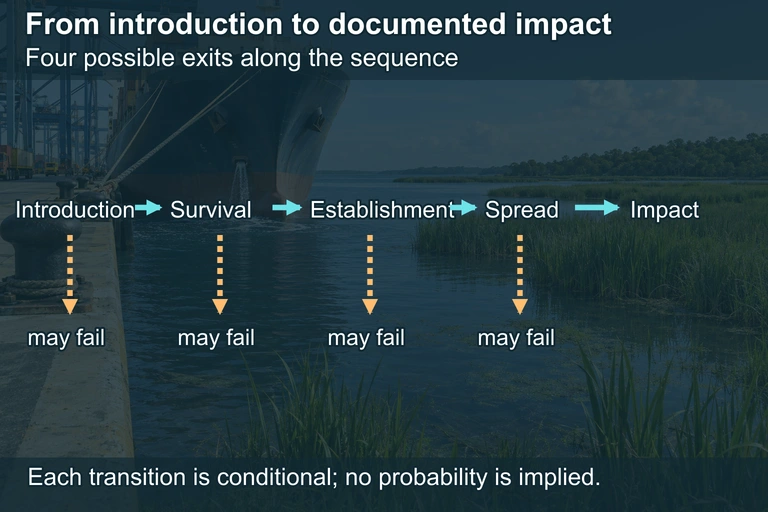 Introduction, survival, establishment, spread and impact are distinct conditional stages; failure can occur between stages.
SECTION 3
Invasion Process: From Introduction to Impact
The diagram illustrates a key concept in invasion biology: the lag phase between establishment and rapid spread. During this period—which can last years to decades—the invasive population may remain small and undetected, making early-stage eradication difficult in practice but extremely cost-effective when achieved. Once the population enters the exponential growth phase, control costs escalate dramatically while the probability of eradication drops to near zero. This temporal dynamic underscores why environmental scientists emphasize prevention and early detection as the most efficient management strategies. The IPBES estimates that for every dollar spent on prevention, ten to one hundred dollars are saved in later control and damage mitigation.
SECTION 4
Mechanisms of Invasion & Ecological Disruption
How Invasive Species Displace Native Organisms
Invasive species disrupt native ecosystems through several interrelated mechanisms. Competitive exclusion occurs when an invader outcompetes native species for the same limiting resources—food, light, nesting sites, or water—eventually driving the native species from its niche. The competitive exclusion principle predicts that two species occupying identical niches cannot coexist indefinitely; the species with even a slight competitive advantage will eventually dominate. Invasive species frequently hold this advantage because they arrive without their native predators, parasites, and diseases—a concept formalized as the enemy release hypothesis.
Predation by invasive species can devastate native prey populations that have not evolved defensive behaviors against the novel predator. The brown tree snake (Boiga irregularis) in Guam extirpated nearly all native forest bird species within a few decades of its accidental introduction. Habitat alteration represents another powerful mechanism: invasive plants like kudzu (Pueraria montana) smother native vegetation, while invasive beavers or earthworms can restructure soil and hydrological systems. Some invasives also introduce novel diseases to which native species have no immunity—avian malaria transmitted by introduced mosquitoes has decimated Hawaiian honeycreepers.
Population Growth & the Invasion Curve
EXPONENTIAL GROWTH MODEL
N = population size; r = intrinsic rate of increase; t = time. During the spread phase, invasive populations often approximate exponential growth because resources are abundant and natural enemies are absent.
LOGISTIC GROWTH MODEL
K = carrying capacity. As the invasive population saturates available resources or management reduces K, growth decelerates. Effective management aims to reduce K or lower r through biological or chemical control.
Understanding growth models matters for management timing. During the lag phase, the population is small enough that eradication may be feasible. Once exponential growth begins, the population may exceed any realistic control effort's capacity. Environmental scientists use population growth rate (r) to estimate doubling time (t₂ = ln 2 / r ≈ 0.693 / r) and project when an invader will reach critical population thresholds, enabling timely allocation of management resources.
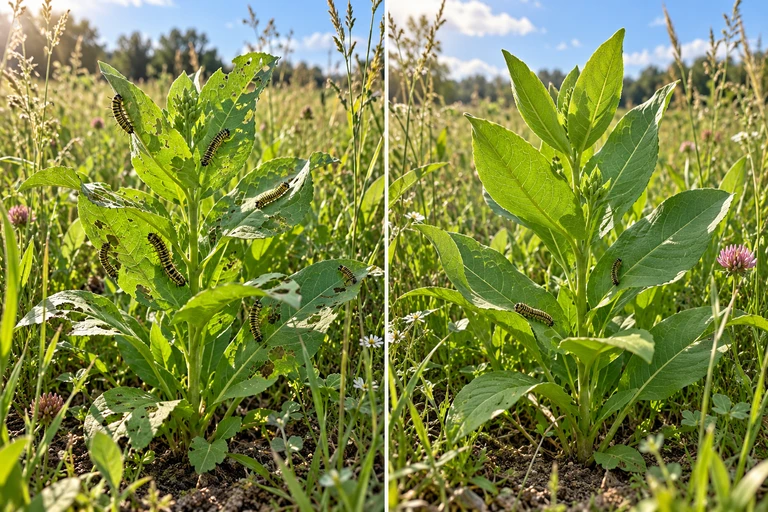 Test enemy release by comparing enemy pressure, survival and reproduction while accounting for climate and competition. Introduced species differ in whether release from enemies contributes to establishment or spread.
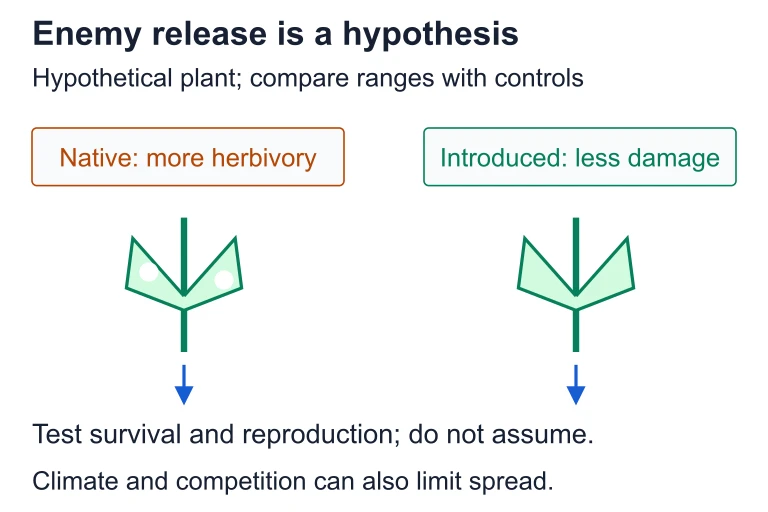 Test enemy release by comparing enemy pressure, survival and reproduction while accounting for climate and competition. Introduced species differ in whether release from enemies contributes to establishment or spread.
SECTION 5
Case Studies & Classification of Impacts
| Invasive Species | Native Region | Invaded Region | Primary Mechanism |
|---|---|---|---|
| Dreissena polymorpha (zebra mussel) | Black & Caspian Seas | North American Great Lakes | Competition; biofouling of infrastructure |
| Python bivittatus (Burmese python) | Southeast Asia | Florida Everglades | Predation on native mammals and birds |
| Bromus tectorum (cheatgrass) | Europe / SW Asia | Western U.S. rangelands | Habitat alteration via increased fire frequency |
| Batrachochytrium dendrobatidis (chytrid fungus) | Korean Peninsula (likely) | Global amphibian populations | Disease introduction; 90+ species extinctions |
| Myocastor coypus (nutria) | South America | U.S. Gulf Coast wetlands | Habitat alteration; destruction of marsh vegetation |
Representative invasive species tested on the AP Environmental Science exam
The cheatgrass example illustrates a particularly dangerous feedback loop: cheatgrass invades sagebrush steppe, dries out earlier than native vegetation, and fuels more frequent fires. After fire, cheatgrass recolonizes faster than native plants, creating a positive feedback cycle that converts diverse native habitat into a cheatgrass monoculture. This type of ecosystem-level transformation—where the invader fundamentally changes disturbance regimes—is among the most challenging impacts to reverse.
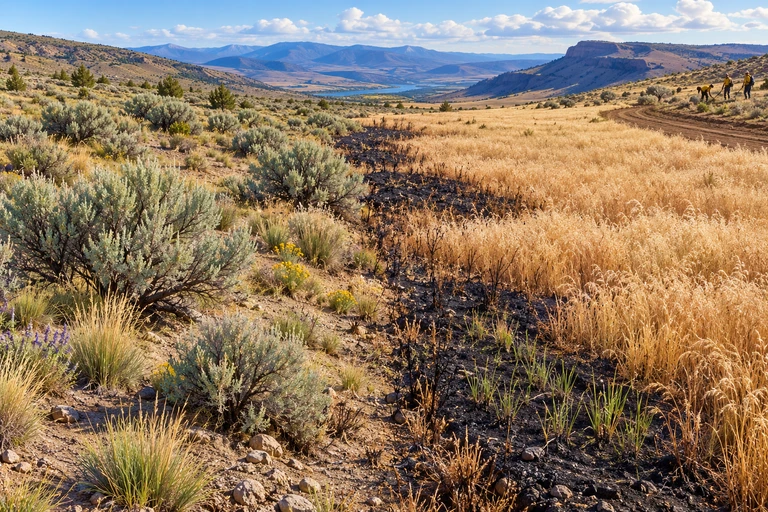 Cheatgrass can create continuous, early-drying fuel in sagebrush steppe. More frequent fires can constrain native recovery while cheatgrass rapidly returns, reinforcing the changed fire regime.
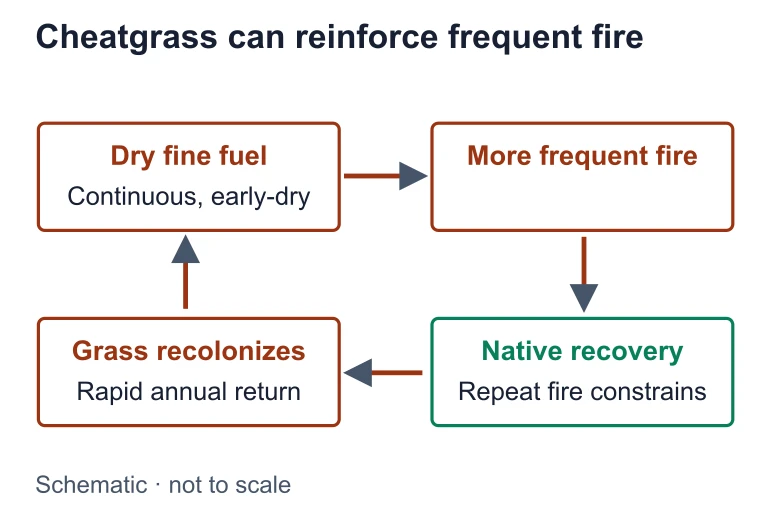 Cheatgrass can create continuous, early-drying fuel in sagebrush steppe. More frequent fires can constrain native recovery while cheatgrass rapidly returns, reinforcing the changed fire regime.
SECTION 6
Worked Example: Invasive Population Growth & Management
A wildlife agency discovers that an invasive carp species was introduced to a 500-hectare lake three years ago. The initial founding population was estimated at 200 individuals. The intrinsic growth rate (r) is 0.45 per year. Calculate the projected population after 5 total years, the doubling time, and evaluate whether eradication is still feasible.
Worked example
- 1
Step 1 — Identify Given Values
N₀ = 200 (initial population), r = 0.45 yr⁻¹, t = 5 years. We use the exponential growth formula because resources are effectively unlimited in the early invasion phase: N(t) = N₀ × ert. - 2
Step 2 — Calculate Population at t = 5 years
N(5) = 200 × e(0.45 × 5) = 200 × e2.25 = 200 × 9.488 ≈ 1,898 individuals.N(5) ≈ 1,898 individuals - 3
Step 3 — Calculate Doubling Time
t₂ = ln(2) / r = 0.693 / 0.45 ≈ 1.54 years. The population doubles roughly every 18.5 months, indicating rapid exponential growth.Doubling time ≈ 1.54 years - 4
Step 4 — Assess Management Feasibility
At t = 3 years (present day): N(3) = 200 × e1.35 ≈ 771 fish. At t = 5: ≈ 1,898 fish. At t = 10: N(10) = 200 × e4.5 ≈ 18,034. The exponential trajectory shows that delay dramatically increases control costs. Current population (~771) may still be manageable with intensive netting and chemical treatment (rotenone), but waiting two more years nearly triples the population.Immediate action recommended — delay increases population by ~146% in 2 years
SECTION 7
Management Strategies: Strengths & Limitations
Managing invasive species requires selecting from a toolkit of approaches, each with trade-offs. The AP exam frequently tests students' ability to evaluate management strategies in context, weighing ecological effectiveness, cost, and unintended consequences.
| Strategy | Description | Strengths | Limitations |
|---|---|---|---|
| Prevention | Regulations on ballast water, quarantine, border inspection | Most cost-effective; avoids damage entirely | Requires international cooperation; cannot stop all pathways |
| Mechanical removal | Trapping, hand-pulling, netting, hunting | Species-specific; no chemical residues | Labor-intensive; often cannot achieve eradication |
| Chemical control | Herbicides, piscicides (e.g., rotenone), pesticides | Rapid population reduction over large areas | Non-target species harmed; bioaccumulation risk; public opposition |
| Biological control | Introducing a natural enemy from the invader's native range | Self-sustaining; targets only the invasive species (ideally) | Risk of biocontrol agent itself becoming invasive (e.g., cane toad in Australia); slow to establish |
| Integrated Pest Management (IPM) | Combines multiple methods (mechanical + biological + limited chemical) | Most adaptable; reduces reliance on any single method | Complex coordination; requires ongoing monitoring and funding |
Comparison of invasive species management strategies
SECTION 8
Connection to Global Change & Biodiversity Loss
Invasive species do not operate in isolation—they interact synergistically with other drivers of global change, a phenomenon ecologists call the "extinction vortex" or "threat synergies." Climate change is already expanding the potential range of many invasive species by shifting temperature and precipitation zones poleward and to higher elevations. Meanwhile, habitat fragmentation from land-use change reduces the resilience of native communities, making them more susceptible to invasion. Understanding these interactions is essential for the AP exam's emphasis on systems thinking.
| Factor | Interaction with Invasive Species | Example |
|---|---|---|
| Climate change | Warmer temperatures expand invader ranges; extreme events create disturbance opportunities | Lionfish range expanding northward along U.S. East Coast as ocean temperatures rise |
| Habitat fragmentation | Edge habitats and disturbed corridors facilitate invader establishment | Roads and logging corridors serve as invasion highways for exotic plants |
| Pollution / eutrophication | Nutrient enrichment favors fast-growing invasive species over slow-growing natives | Hydrilla thrives in nutrient-rich waterways, outcompeting native aquatic plants |
| Overexploitation | Removal of native predators or competitors opens niches for invaders | Overfishing in Lake Victoria allowed Nile perch to dominate after introduction |
Synergies between invasive species and other global change drivers
SECTION 9
Practice Problems
Question 1: CONCEPTUAL
- A. Islands have higher rates of speciation, which creates more niches for invasive species to fill.
- B. Island species have evolved in isolation with fewer predators and competitors, making them poorly adapted to resist novel invaders.
- C. Islands have more nutrient-rich soils due to volcanic activity, which preferentially supports fast-growing invasive plants.
- D. Island climates are warmer and wetter than continental climates, creating ideal conditions for all non-native species.
Show answer (B)
Question 2: BASIC CALCULATION
- A. 0.5 years
- B. 1.0 year
- C. 2.0 years
- D. 3.5 years
Show answer (C)
Question 3: INTERMEDIATE
- A. Biological control agents reproduce slowly and therefore cannot keep pace with fast-growing invasive plants.
- B. The introduced biocontrol agent may itself become invasive or attack non-target native species, creating a secondary invasion problem.
- C. Herbicides are always more effective than biological control agents at reducing invasive plant populations.
- D. Parasitic flies cannot survive in aquatic environments, so the proposed agent would be ineffective.
Show answer (B)
Question 4: APPLIED
Show answer
Question 5: CRITICAL THINKING