

SECTION 1
Historical Context & Motivation
The concept of sustainability has deep roots in human civilization, although the formal vocabulary emerged only in the late twentieth century. Indigenous communities across every inhabited continent practiced rotational farming, seasonal hunting restrictions, and prescribed burns that maintained ecosystem health for millennia. European colonial expansion, followed by the Industrial Revolution, disrupted many of these practices by introducing a linear economic model—extract, produce, consume, discard—that treated natural resources as inexhaustible inputs. By the mid-1900s, accelerating deforestation, soil degradation, fishery collapses, and air pollution made it clear that the biosphere could not absorb unlimited exploitation. The intellectual journey from alarm to action produced a series of landmark moments that shaped the sustainability framework environmental scientists use today.
1962 • Silent Spring Published
1972 • Limits to Growth Report
1987 • Brundtland Report
1992 • Earth Summit in Rio
2015 • UN Sustainable Development Goals
The historical trajectory reveals a central tension that the AP Environmental Science curriculum explores: How can human societies satisfy their growing demand for food, water, energy, and materials while preserving the ecological systems that supply those very resources? Sustainability science attempts to answer that question by integrating environmental, economic, and social analyses into a coherent decision-making framework.
SECTION 2
Core Principles & Definitions
Sustainability rests on the idea that natural systems have finite regenerative capacities and that human well-being depends on staying within those limits. The Brundtland definition provides the philosophical foundation, but environmental scientists operationalize sustainability through several interconnected principles. Understanding these principles is essential for the AP exam because questions frequently require you to evaluate whether a resource management strategy is sustainable and to justify your reasoning using specific criteria.
The Three Pillars
Renewable vs. Non-Renewable Resources
Carrying Capacity & Ecological Footprint
Intergenerational Equity
Precautionary Principle
KEY TAKEAWAY
SECTION 3
The Three Pillars of Sustainability
The visual above is the conceptual backbone of sustainability analysis. When the AP exam presents a resource-management scenario—say, a proposed logging operation in a national forest—you should evaluate it against all three pillars. Does the operation maintain forest ecosystem services such as carbon sequestration, watershed protection, and wildlife habitat (environmental)? Does it generate revenue and employment over the long term without boom-and-bust cycles (economic)? Does it protect the livelihoods of local and indigenous communities and ensure equitable distribution of benefits (social)? Only when all three criteria are satisfied does the practice qualify as sustainable. A policy that is economically profitable but degrades soil fertility, for instance, may be equitable or viable in the short run but will ultimately collapse environmentally, pulling the other pillars down with it.
SECTION 4
Quantifying Sustainability: Key Metrics
Although sustainability is partly a qualitative concept, environmental scientists rely on quantitative metrics to measure it. On the AP Environmental Science exam, you may be asked to perform calculations involving ecological footprints, maximum sustainable yield, and resource depletion rates. The following equations formalize the sustainability concepts introduced in Section 2 and provide the mathematical tools you need for the free-response section of the exam.
ECOLOGICAL FOOTPRINT
Where EF = ecological footprint (global hectares, gha), Cᵢ = consumption of resource category i (e.g., cropland, forest, carbon), Yᵢ = national average yield for category i (tonnes per hectare), and EQFᵢ = equivalence factor that converts category-specific hectares to global hectares. An individual or nation is in ecological overshoot when EF exceeds biocapacity.
MAXIMUM SUSTAINABLE YIELD (MSY)
Where r = intrinsic growth rate of the population and K = carrying capacity of the environment for that species. MSY represents the greatest harvest that can be taken from a population year after year without causing long-term decline; it occurs when the population is at K/2.
RESOURCE DEPLETION TIME
Where T = time until resource exhaustion (years), R = total remaining reserves (units of resource), and C = annual consumption rate (same units per year). This simple model assumes constant consumption; exponential growth in consumption shortens T dramatically. For exponential consumption growth at rate g: T = ln(1 + gR/C) / g.
IPAT EQUATION
Where I = environmental impact, P = population, A = affluence (consumption per capita), and T = technology (environmental impact per unit of consumption). Sustainability efforts aim to reduce I by lowering one or more of these factors—for instance, improving T through cleaner production methods.
AP EXAM TIP
SECTION 5
Sustainable vs. Unsustainable Practices
In the context of land and water use, distinguishing sustainable from unsustainable practices is one of the most tested skills on the AP exam. The diagram below contrasts a linear resource-use model—the conventional extract-use-discard pathway—with a circular model that minimizes waste and closes material loops. Understanding this distinction helps you evaluate agricultural, forestry, mining, and urban development scenarios.
| Practice | Sustainable Approach | Unsustainable Approach |
|---|---|---|
| Agriculture | Crop rotation, integrated pest management, no-till farming, polyculture | Monoculture, heavy pesticide use, slash-and-burn without fallow, excessive irrigation |
| Forestry | Selective cutting, shelterwood harvesting, FSC certification, replanting programs | Clear-cutting entire watersheds, illegal logging, no replanting |
| Fisheries | Harvest at or below MSY, seasonal closures, bycatch reduction devices, marine protected areas | Overfishing beyond MSY, bottom trawling, discarding bycatch, no enforcement of quotas |
| Water Use | Drip irrigation, rainwater harvesting, greywater recycling, watershed protection | Aquifer overdraft, unlined irrigation canals, damming without environmental flow, deforestation of riparian zones |
| Urban Development | Green building (LEED), mass transit, urban green spaces, mixed-use zoning | Suburban sprawl, car-dependent infrastructure, impervious surface expansion, habitat fragmentation |
Comparison of sustainable and unsustainable land and water use practices across five sectors commonly tested on the AP exam.
SECTION 6
Worked Example: Calculating Sustainable Yield & Resource Depletion
The following example integrates the MSY and resource depletion time equations from Section 4 into a realistic fisheries scenario—exactly the type of calculation you might encounter in an AP Environmental Science free-response question.
Sustainable Harvest of a Cod Population
- 1
Step 1 — Identify Given Values
A marine biologist estimates that a North Atlantic cod population has a carrying capacity of K = 500,000 individuals and an intrinsic growth rate of r = 0.20 per year. The current population is 250,000 fish—exactly K/2. The local fishing fleet currently harvests 30,000 fish per year. Determine (a) the maximum sustainable yield and (b) whether the current harvest is sustainable. - 2
Step 2 — Calculate MSY
Applying the MSY formula: MSY = (r × K) / 4 = (0.20 × 500,000) / 4 = 100,000 / 4.MSY = 25,000 fish per year - 3
Step 3 — Compare Harvest to MSY
The fleet harvests 30,000 fish per year, which exceeds the MSY of 25,000 fish per year. At this rate, the population will decline below K/2, growth rate will slow, and the fishery risks collapse.Current harvest (30,000) > MSY (25,000) → UNSUSTAINABLE - 4
Step 4 — Estimate Time to Population Decline (Simplified)
The net population change per year = growth − harvest. At K/2, annual growth = r × N × (1 − N/K) = 0.20 × 250,000 × (1 − 0.5) = 25,000 fish added per year. Net change = 25,000 − 30,000 = −5,000 fish per year. Although the decline is non-linear (growth rate changes as population decreases), this linear approximation shows the population would fall to dangerously low levels within roughly 250,000 / 5,000 = 50 years if nothing changed.Net annual change ≈ −5,000 fish/year (population declining) - 5
Step 5 — Recommend a Sustainable Policy
To restore sustainability, the fleet should reduce its harvest to at most 25,000 fish per year, implement seasonal closures to allow spawning, and establish marine protected areas. Reducing the harvest to fewer than 25,000 temporarily would allow the population to rebuild toward K/2, maximizing long-term yield.Sustainable recommendation: reduce harvest to ≤ 25,000 fish/year and allow stock recovery
SECTION 7
Strengths, Limitations & Tradeoffs of Sustainability Strategies
No sustainability strategy is without tradeoffs. AP exam questions frequently test your ability to evaluate the strengths and weaknesses of different approaches. The table below compares commonly tested strategies across the three pillars, highlighting both their advantages and the challenges they present. Recognizing these nuances will help you construct higher-scoring free-response answers.
| Strategy | Strengths | Limitations / Tradeoffs |
|---|---|---|
| Integrated Pest Management (IPM) | Reduces chemical inputs, preserves beneficial insects, lowers costs over time | Requires farmer education and monitoring; may not work for all pest species; short-term yields can dip during transition |
| Marine Protected Areas (MPAs) | Protect biodiversity, allow fish stock recovery, provide ecosystem services like storm buffering | Displaces fishing communities; enforcement is expensive; effectiveness depends on size and connectivity; may shift fishing pressure elsewhere |
| Green Building (LEED) | Reduces energy use 25–50%, improves indoor air quality, long-term cost savings | Higher upfront construction costs; certification process is complex; benefits accrue over decades, not immediately |
| Drip Irrigation | Reduces water use by 30–60% vs. flood irrigation, minimizes soil salinization, precise nutrient delivery | Expensive to install; requires clean water to prevent clogging; technical maintenance; not suited to all crop types |
| Carbon Pricing (Tax / Cap-and-Trade) | Internalizes externalities, incentivizes innovation, generates government revenue for green investment | Regressive impact on low-income populations; carbon leakage if only some nations participate; political resistance; requires accurate emissions monitoring |
Each strategy offers genuine environmental benefits but involves economic, social, or practical tradeoffs that must be weighed.
KEY TAKEAWAY
SECTION 8
Connecting Sustainability to Advanced Concepts
Sustainability does not exist in isolation; it connects to nearly every other unit in the AP Environmental Science curriculum. Understanding these linkages strengthens your ability to write comprehensive free-response answers and to recognize cross-cutting themes in multiple-choice questions. The table below maps core sustainability concepts to the advanced topics they inform.
| Sustainability Concept | Advanced AP Topic | Connection |
|---|---|---|
| Ecological Footprint | Global Climate Change (Unit 9) | The carbon component of ecological footprints directly measures fossil fuel dependence, linking consumption patterns to greenhouse gas emissions and climate policy. |
| Maximum Sustainable Yield | Populations (Unit 3) | MSY is derived from the logistic growth model; understanding density-dependent factors and population dynamics is prerequisite to applying MSY in real fisheries and wildlife management. |
| Three Pillars Model | Energy Resources & Consumption (Unit 6) | Energy transitions (e.g., coal to solar) must be evaluated against all three pillars: environmental (emissions reduction), economic (job creation vs. loss), and social (energy equity). |
| IPAT Equation | Human Populations (Unit 4) | The P variable links sustainability to demographic transition theory; as populations stabilize, the relative importance of A (affluence) and T (technology) shifts, requiring different policy responses. |
| Circular Economy / Zero Waste | Pollution (Unit 8) | Circular resource models minimize waste output at every stage, directly reducing solid waste, water pollution, and air emissions compared to linear throughput economies. |
Sustainability concepts and their connections to other AP Environmental Science units.
As you progress through the AP Environmental Science curriculum, look for opportunities to reference sustainability principles when analyzing any resource-use question. Free-response prompts that ask you to "propose a solution" almost always reward answers grounded in sustainability reasoning—solutions that address environmental, economic, and social dimensions earn full credit more reliably than one-dimensional answers. In the analyze-propose-calculations FRQ type, expect to combine IPAT or MSY calculations with a narrative justification of why a given policy promotes long-term sustainability.
 Repair and reuse return products to service. Recycling recovers materials for manufacturing. These processes require energy and can produce residual waste.
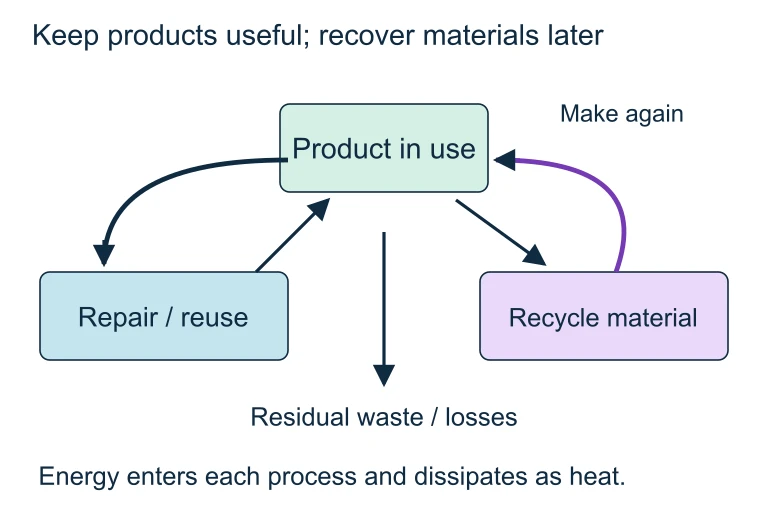 Repair and reuse return products to service. Recycling recovers materials for manufacturing. These processes require energy and can produce residual waste.
SECTION 9
Practice Problems
Question 1: CONCEPTUAL
- A. A timber company clear-cuts a forest and replants it with a single fast-growing species to maximize short-term profits.
- B. A fishing fleet uses sonar to locate and harvest the maximum number of fish in each trip, exceeding government quotas when enforcement is weak.
- C. A municipality invests in drip irrigation infrastructure and recycled wastewater systems to reduce aquifer withdrawal to a level at or below the natural recharge rate.
- D. A mining company extracts ore rapidly to take advantage of high market prices, then abandons the site without remediation.
Show answer (C)
Question 2: BASIC CALCULATION
- A. 1,000 deer per year
- B. 1,500 deer per year
- C. 3,000 deer per year
- D. 6,000 deer per year
Show answer (B)
Question 3: INTERMEDIATE
- A. 500 million tonnes CO₂
- B. 1 billion tonnes CO₂
- C. 2 billion tonnes CO₂
- D. 10 billion tonnes CO₂
Show answer (B)
Question 4: APPLIED
4 ptsShow answer
Question 5: CRITICAL THINKING
4 ptsShow answer
SUMMARY
Lesson Summary
Summary
Sustainability is the organizing principle for responsible land and water use, defined by the Brundtland Commission as meeting present needs without compromising the ability of future generations to meet theirs. It rests on three pillars—environmental, economic, and social—and only practices that satisfy all three qualify as truly sustainable. Key quantitative tools include the ecological footprint (which measures human demand against biocapacity), maximum sustainable yield (the largest harvest a population can sustain indefinitely, calculated as MSY = rK/4), and the IPAT equation (I = P × A × T, which links population, affluence, and technology to total environmental impact).
Sustainable practices in agriculture, forestry, fisheries, water management, and urban development share a common logic: they keep resource extraction at or below natural replenishment rates and transition from linear (extract-use-waste) models to circular (design-produce-consume-recycle-recover) models. Every sustainability strategy involves tradeoffs across the three pillars, and high-scoring AP responses acknowledge these tradeoffs while explaining how policies apply the precautionary principle and promote intergenerational equity.