AP Environmental Science • The Living World: Ecosystems

Introduction to Ecosystems

Understanding the flow of energy and cycling of matter that sustain life on Earth.

A sprouting plant framed by Earth and recycling symbols.
Inside this lesson 10 sections 5 questions 7 figures

SECTION 1

Historical Context & Motivation

The concept of an ecosystem — a community of organisms interacting with their physical environment as a functional unit — arose from a long tradition of naturalists attempting to explain why certain species thrive in particular places. Early natural historians documented patterns of distribution and abundance, but it was not until the twentieth century that ecologists formalized the idea that living organisms and their abiotic surroundings form integrated, self-sustaining systems governed by energy flow and nutrient cycling. Understanding this intellectual trajectory helps contextualize why modern environmental science treats the ecosystem as its fundamental unit of analysis.

1866 • Haeckel Coins 'Ecology'

German biologist Ernst Haeckel introduced the term Ökologie, defining it as the study of organisms' relationships with their environment and setting the conceptual stage for ecosystem science.

1935 • Tansley Defines 'Ecosystem'

British ecologist Arthur Tansley formally proposed the term ecosystem, arguing that organisms and their physical surroundings must be studied as a single interacting system rather than in isolation.

1942 • Lindeman's Trophic-Dynamic Concept

Raymond Lindeman published his trophic-dynamic model of Cedar Bog Lake, quantifying energy transfer between trophic levels and establishing the 10% rule of ecological efficiency.

1953 • Odum's Ecosystem Energetics

Howard T. Odum published his landmark study of energy flow at Silver Springs, Florida, producing one of the first comprehensive energy budgets for a natural ecosystem and popularizing the systems-ecology approach.

1969 • Hubbard Brook Watershed Experiment

Gene Likens and colleagues demonstrated through deforestation experiments that nutrient cycling within ecosystems is tightly coupled to vegetation, proving that disruptions to biotic components have measurable abiotic consequences.

These milestones collectively shifted ecology from a purely descriptive discipline toward a quantitative science concerned with measurable flows of energy and matter. The central question that ecosystem ecology addresses — How do energy and nutrients move through living and nonliving components of the natural world? — remains the organizing framework for the AP Environmental Science curriculum on the living world.

SECTION 2

Core Principles & Definitions

An ecosystem can be as small as a tide pool or as vast as the Amazon basin, but every ecosystem shares the same fundamental architecture: a biotic community of living organisms embedded in an abiotic matrix of physical and chemical factors. Four core principles govern how ecosystems function, and these principles recur throughout the AP Environmental Science exam in topics ranging from biogeochemical cycles to biodiversity loss.

1

Energy Flows, Matter Cycles

Energy enters most ecosystems as solar radiation, moves unidirectionally through trophic levels, and exits as heat. In contrast, matter (nutrients such as carbon, nitrogen, and phosphorus) is continuously recycled between biotic and abiotic reservoirs.
2

Trophic Structure

Organisms occupy distinct feeding positions — producers, primary consumers, secondary consumers, and decomposers — forming a hierarchical trophic structure that determines energy availability at each level.
3

Productivity & Biomass

The rate at which producers convert inorganic compounds into organic matter — gross primary productivity (GPP) — sets the energetic ceiling for the entire ecosystem. After producers respire, the remaining energy is net primary productivity (NPP).
4

Nutrient Cycling

Biogeochemical cycles (carbon, nitrogen, phosphorus, water) move essential elements through abiotic reservoirs, living organisms, and back again — a process that sustains ecosystems over geological timescales.
5

Ecological Efficiency

Only about 10% of the energy stored at one trophic level is transferred to the next. This ecological efficiency constrains the number of trophic levels an ecosystem can support, typically to four or five.
✦

KEY TAKEAWAY

Think of an ecosystem like a factory with a one-way conveyor belt for energy and a set of internal recycling bins for materials. Sunlight is the raw power supply that drives the conveyor forward — once used, it dissipates as waste heat and cannot be recaptured. But the atoms of carbon, nitrogen, and phosphorus are like factory parts that get disassembled and reassembled over and over. Disrupting either the power supply (energy flow) or the recycling system (nutrient cycling) degrades the entire operation.

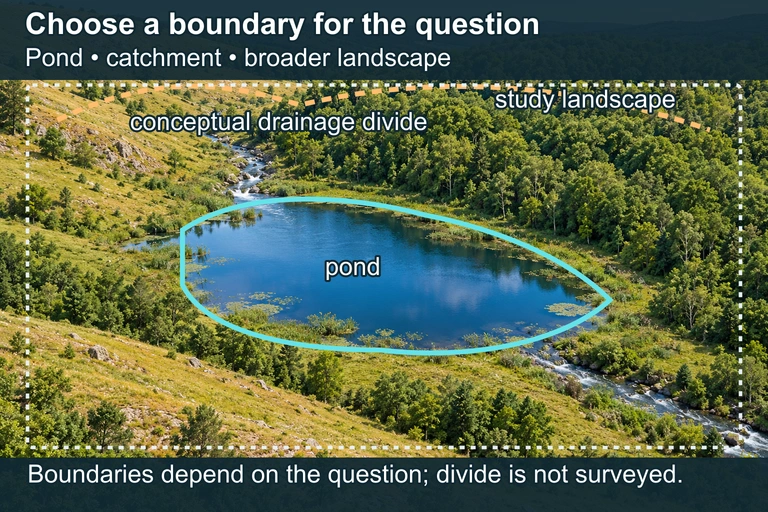
An ecological landscape shows pond outline, conceptual drainage divide and a broader study boundary; a companion illustrates crossings.Pond, catchment and landscape boundaries answer different research questions. Organisms, matter and energy can cross the selected ecosystem boundary.
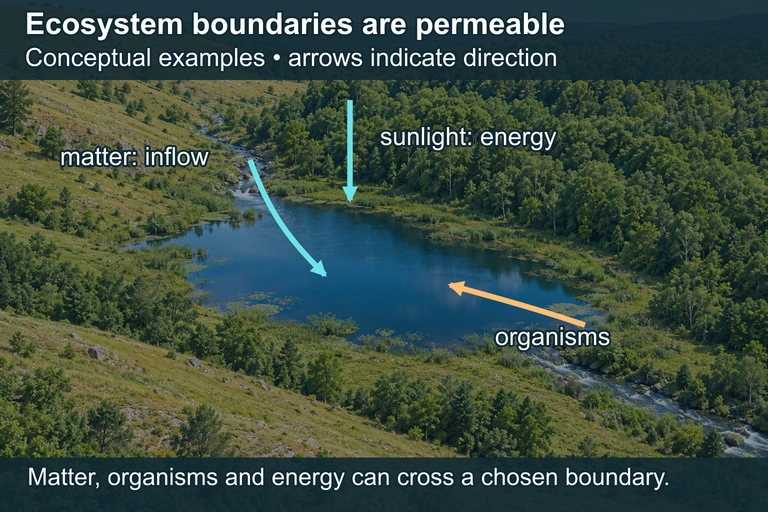
Arrows carry sunlight, matter and an organism across the selected pond boundary.Energy, matter and organisms can cross a chosen ecosystem boundary; this is not a closed quantitative budget.

SECTION 3

Energy Flow Through an Ecosystem

Energy Flow Through Trophic Levels☀ SOLAR ENERGYPRODUCERS10,000 kcalPRIMARYCONSUMERS1,000 kcalSECONDARYCONSUMERS100 kcalTERTIARYCONSUMERS10 kcal10%10%10%9,000 kcal900 kcal90 kcal9 kcalheat lostheat lostheat lostheat lostDECOMPOSERS(recycle nutrients from all levels)Energy transferHeat loss (respiration)Decomposer pathways
Energy enters the ecosystem via solar radiation and flows left to right through producers, primary consumers, secondary consumers, and tertiary consumers. At each transfer, approximately 90% of energy is lost as metabolic heat (red dashed arrows), leaving only about 10% available to the next trophic level. Decomposers (orange dashed lines) recycle nutrients from all levels back into the abiotic environment.

The diagram above illustrates the most important quantitative pattern tested on the AP Environmental Science exam: the unidirectional flow of energy through trophic levels. Notice that producers fix 10,000 kcal of energy through photosynthesis, but only 1,000 kcal reach primary consumers, 100 kcal reach secondary consumers, and a mere 10 kcal reach tertiary consumers. This exponential decline explains why apex predators such as eagles and sharks are always rare relative to herbivores — there is simply not enough energy at the top of the food chain to support large populations. The second law of thermodynamics ensures that every metabolic transaction dissipates some energy as heat, making the loss irreversible and the flow strictly one-way.
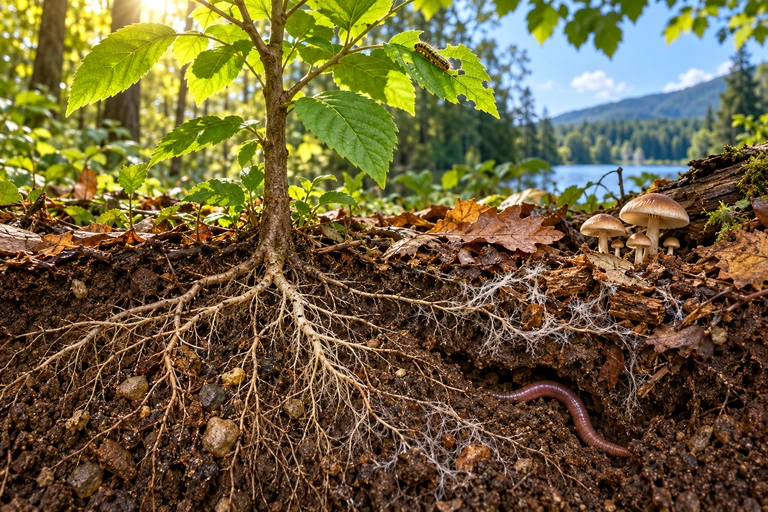
A forest-floor scene with leaves, consumer, litter, fungi and roots accompanies separate energy-flow and matter-cycle diagrams.Energy enters organisms through sunlight and food, then dissipates as heat; decomposers also receive chemical energy from organic matter. Nutrient atoms can return through soil and other abiotic reservoirs as ecosystems exchange matter with their surroundings.
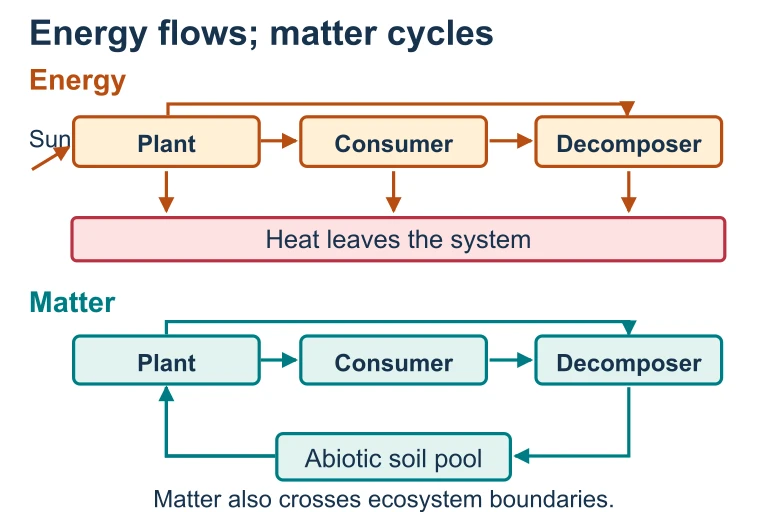
Separate energy and matter pathways. Energy enters organisms through sunlight and food, then dissipates as heat; decomposers also receive chemical energy from organic matter. Nutrient atoms can return through soil and other abiotic reservoirs as ecosystems exchange matter with their surroundings.Energy enters organisms through sunlight and food, then dissipates as heat; decomposers also receive chemical energy from organic matter. Nutrient atoms can return through soil and other abiotic reservoirs as ecosystems exchange matter with their surroundings.

SECTION 4

Mathematical Framework — Productivity & Efficiency

Ecosystem ecology relies on several quantitative relationships that the AP exam expects you to apply in calculations and data analysis. The two most important concepts are productivity and ecological efficiency, both of which can be expressed with simple equations. Mastering these equations allows you to move from qualitative descriptions of 'energy flows through ecosystems' to precise predictions about how much energy is available at any trophic level.

NET PRIMARY PRODUCTIVITY

NPP=GPP−RNPP = GPP − R

Where NPP = net primary productivity (energy available to consumers), GPP = gross primary productivity (total energy fixed by photosynthesis), and R = energy lost to cellular respiration by the producers. Units are typically kcal/m²/yr or g C/m²/yr.

ECOLOGICAL EFFICIENCY (TROPHIC TRANSFER EFFICIENCY)

Efficiency=(Energyattrophicleveln+1÷Energyattrophicleveln)×100Efficiency = (Energy at trophic level n+1 ÷ Energy at trophic level n) × 100%

Typically approximately 10% for most ecosystems, though values range from 5% to 20%. The remaining 80−95% is lost primarily as metabolic heat through cellular respiration.

ENERGY AVAILABLE AT TROPHIC LEVEL n

En=E1×(efficiency)n−1Eₙ = E₁ × (efficiency)ⁿ⁻¹

Where Eₙ = energy at the nth trophic level, E₁ = energy at the producer level (NPP), and efficiency is expressed as a decimal (e.g., 0.10). This formula allows you to calculate energy at any trophic level from the base of the food chain.

💡

AP Exam Tip

FRQ calculation questions often provide GPP and respiration values and ask you to compute NPP, or they provide energy at one trophic level and ask how much is available two or three levels up. Always show your work, include units, and state the 10% rule explicitly when applicable — these are all potential rubric points.

SECTION 5

Net Primary Productivity Across Biomes

Not all ecosystems produce energy at the same rate. Net primary productivity varies enormously across terrestrial and aquatic biomes, driven largely by differences in sunlight availability, temperature, water, and nutrient supply. Understanding these patterns is essential for AP Environmental Science because they explain why tropical rainforests support more trophic levels than deserts, and why estuaries are ecologically disproportionate to their small geographic area. The following diagram and table compare NPP values for major biomes.

Net Primary Productivity by Biome (g C/m²/yr)g C/m²/yr0500100015002000Tropical Rainforest1900Estuary / Wetland1800Temperate Forest1200Savanna900Boreal Forest800Temperate Grassland600Coral Reef500Open Ocean125Desert90
Horizontal bar chart comparing NPP across nine biomes. Tropical rainforests and estuaries/wetlands lead in per-area productivity due to abundant sunlight, water, and nutrients. The open ocean, despite its enormous total area, has very low NPP per unit area due to nutrient limitation.

Several patterns merit attention. First, warm, wet biomes with long growing seasons dominate the productivity rankings because photosynthesis requires both light and water. Second, aquatic systems vary wildly — estuaries are among the most productive ecosystems on Earth because nutrient-rich freshwater mixes with saltwater, while the open ocean, though vast, is a nutrient-poor 'biological desert' on a per-area basis. Third, the open ocean's low per-area NPP is offset by its immense surface area, making it the single largest contributor to global net primary productivity when total production is calculated. This distinction between per-area productivity and total productivity is a common AP exam pitfall.

SECTION 6

Worked Example — Energy Budget Calculation

The following worked example mirrors the style of calculation-based FRQ items on the AP Environmental Science exam. It integrates the NPP equation with trophic transfer efficiency to determine how much energy is available to a top predator.

How Much Energy Reaches an Apex Predator?

  1. 1

    Step 1 — Identify Given Values

    A grassland ecosystem has a GPP of 8,500 kcal/m²/yr. The producers use 3,200 kcal/m²/yr for cellular respiration. Assume a trophic transfer efficiency of 10% at each level. We want to find the energy available to secondary consumers (trophic level 3).
  2. 2

    Step 2 — Calculate NPP

    Apply the NPP formula: NPP = GPP − R = 8,500 − 3,200
    NPP = 5,300 kcal/m²/yr
  3. 3

    Step 3 — Determine Energy at Primary Consumer Level

    Primary consumers (trophic level 2) receive 10% of the producer energy: E₂ = 5,300 × 0.10
    E₂ = 530 kcal/m²/yr
  4. 4

    Step 4 — Determine Energy at Secondary Consumer Level

    Secondary consumers (trophic level 3) receive 10% of primary consumer energy: E₃ = 530 × 0.10
    E₃ = 53 kcal/m²/yr
  5. 5

    Step 5 — Verify with General Formula

    Using the general formula: Eₙ = E₁ × (efficiency)ⁿ⁻¹ = 5,300 × (0.10)² = 5,300 × 0.01
    E₃ = 53 kcal/m²/yr ✓ (confirmed)
⚠

Common Mistake Alert

Students frequently use GPP instead of NPP as the starting energy for trophic calculations. Remember: consumers eat the plant biomass that remains after producers respire, so the energy available to the food web is NPP, not GPP. Using GPP will produce inflated answers and cost you rubric points.

SECTION 7

Food Chains vs. Food Webs — Strengths & Limitations

Ecosystem models range in complexity from simple food chains (linear sequences of who eats whom) to intricate food webs (networks of overlapping feeding relationships). Both models have pedagogical and analytical value, but they differ in the accuracy with which they represent real ecosystems. Understanding the strengths and limitations of each is important for AP exam FRQs that ask you to construct or critique ecological models.

FeatureFood ChainFood Web
StructureSingle linear pathwayMultiple interconnected pathways
RealismSimplified; most organisms eat more than one speciesMore accurate representation of feeding relationships
Energy CalculationsStraightforward; apply 10% rule sequentiallyComplex; energy splits among multiple consumers
Resilience InsightRemoving one link collapses the chainAlternative pathways may compensate for species loss
AP Exam UseCommon in calculation-based FRQs (clear trophic levels)Common in qualitative FRQs (predict cascading effects)

Comparison of food chain and food web models

✦

KEY TAKEAWAY

A food chain is like a single supply line delivering parts to a factory — if any link breaks, production halts. A food web is like a supply network with multiple vendors for each component — if one vendor fails, others can partially compensate. This redundancy makes complex food webs more resilient to disturbance, which is why biodiversity generally confers ecosystem stability.

SECTION 8

Connecting Ecosystems to Biogeochemical Cycles & Human Impacts

The principles of ecosystem ecology introduced in this lesson provide the foundation for two major threads that run through the remainder of the AP Environmental Science course: biogeochemical cycling and anthropogenic disruption. While this lesson has focused on energy flow, the matter-cycling dimension of ecosystems — carbon, nitrogen, phosphorus, and water cycles — uses the same trophic framework. Human activities alter both flows: burning fossil fuels injects stored carbon into the atmosphere (disrupting the carbon cycle), while fertilizer runoff delivers excess nitrogen and phosphorus to aquatic ecosystems (causing eutrophication that restructures food webs).

ConceptIntroductory Level (This Lesson)Advanced Level (Later Units)
EnergyUnidirectional flow; 10% ruleThermodynamic constraints on food production; EROI of energy resources
MatterNutrients cycle between biotic and abiotic compartmentsFull biogeochemical cycles (C, N, P, H₂O); residence times; human perturbations
Trophic StructureProducers → consumers → decomposersTrophic cascades; keystone species; bioaccumulation and biomagnification
Human ImpactGeneral recognition that humans alter ecosystemsClimate change, eutrophication, deforestation, species extinction, sustainability strategies

Progression from introductory to advanced ecosystem concepts

As you progress through the AP Environmental Science course, you will see the ecosystem concept applied to increasingly complex scenarios — from trophic cascades (where removal of a top predator triggers changes through multiple trophic levels) to biomagnification (where toxins concentrate as they move up the food chain). Each of these advanced topics rests on the energy-flow and matter-cycling foundations established here. Keeping a clear mental model of trophic structure will make those later topics far more intuitive.

SECTION 9

Practice Problems

Question 1: CONCEPTUAL

Which of the following best explains why apex predators typically exist in small populations compared to organisms at lower trophic levels?
  • A. Apex predators have higher rates of cellular respiration than producers.
  • B. Only about 10% of energy is transferred between successive trophic levels, so very little energy remains to support top predators.
  • C. Apex predators are unable to obtain nutrients from decomposers.
  • D. Apex predators recycle a greater proportion of matter to the abiotic environment than herbivores do.
Show answer (B)
B is correct. The 10% rule of ecological efficiency means that approximately 90% of energy is lost as heat at each trophic transfer. By the time energy reaches the apex predator level (typically trophic level 4 or 5), only a tiny fraction of the original NPP remains, which limits the biomass and population size that can be supported. Choice A is incorrect because while apex predators do respire, their respiration rate alone does not explain their small populations — the limiting factor is the small amount of energy reaching their trophic level. Choice C is incorrect because the inability to obtain nutrients from decomposers is irrelevant to population size constraints. Choice D is incorrect because matter recycling rates do not determine population sizes at different trophic levels; energy availability does.

Question 2: BASIC CALCULATION

A lake ecosystem has a GPP of 12,000 kcal/m²/yr and producers use 4,800 kcal/m²/yr for respiration. Assuming 10% trophic transfer efficiency, how much energy is available to primary consumers?
  • A. 480 kcal/m²/yr
  • B. 720 kcal/m²/yr
  • C. 1,200 kcal/m²/yr
  • D. 7,200 kcal/m²/yr
Show answer (B)
B is correct. First, calculate NPP: NPP = GPP − R = 12,000 − 4,800 = 7,200 kcal/m²/yr. Then apply 10% efficiency to find energy at the primary consumer level: 7,200 × 0.10 = 720 kcal/m²/yr. Choice A (480) is wrong because it applies 10% to the respiration value rather than to NPP. Choice C (1,200) results from incorrectly applying 10% to GPP instead of NPP. Choice D (7,200) confuses NPP itself with the energy available to primary consumers — NPP is the energy available to the entire food web, not to primary consumers specifically.

Question 3: INTERMEDIATE

In a marine ecosystem, phytoplankton produce 20,000 kcal/m²/yr of NPP. Zooplankton feed on phytoplankton, small fish feed on zooplankton, and tuna feed on small fish. Assuming a trophic transfer efficiency of 10%, how much energy is available to tuna?
  • A. 2 kcal/m²/yr
  • B. 20 kcal/m²/yr
  • C. 200 kcal/m²/yr
  • D. 2,000 kcal/m²/yr
Show answer (B)
B is correct. Tuna occupy trophic level 4 (producers = TL1, zooplankton = TL2, small fish = TL3, tuna = TL4). Using Eₙ = E₁ × (0.10)ⁿ⁻¹: E₄ = 20,000 × (0.10)³ = 20,000 × 0.001 = 20 kcal/m²/yr. Choice A (2 kcal) incorrectly applies four transfers instead of three (there are only three energy transfers between four trophic levels). Choice C (200 kcal) only accounts for two transfers, placing tuna at TL3. Choice D (2,000 kcal) accounts for only one transfer, placing tuna at TL2.

Question 4: APPLIED

4 pts
A team of researchers is studying a grassland ecosystem that has experienced a decline in net primary productivity over the past decade. Design an investigation to determine whether the decline in NPP is caused by decreased precipitation or by increased herbivory pressure from a growing population of grasshoppers. (a) State a testable hypothesis for this investigation. (b) Describe the experimental design, including treatments, controls, and the variable to be measured. (c) Identify one potential confounding variable and explain how you would control for it. (d) Describe what data would support the hypothesis that herbivory, rather than precipitation, is responsible for the NPP decline.
Show answer
Rubric (4 points): Point 1 — Testable Hypothesis (1 pt): If the decline in NPP is primarily driven by increased herbivory from grasshoppers, then excluding grasshoppers from experimental plots will result in significantly higher NPP compared to unprotected control plots, even under ambient (natural) precipitation conditions. Point 2 — Experimental Design (1 pt): Establish paired plots across the grassland. Treatment plots are enclosed in fine-mesh exclosures that prevent grasshopper access while allowing rainfall through. Control plots remain open to ambient herbivory. Both treatments receive only natural precipitation. Measure aboveground plant biomass (as a proxy for NPP) at the end of each growing season across multiple replicate plots. An additional treatment group with supplemental irrigation but no exclosure could distinguish between the two hypothesized causes. Point 3 — Confounding Variable (1 pt): Soil nutrient availability could confound results if exclosure plots happen to be placed on more fertile soil. Control for this by randomly assigning plot locations across the study area and collecting baseline soil nutrient samples to verify comparability, or by using a paired design where each exclosure plot has an adjacent open control plot. Point 4 — Supporting Data (1 pt): If herbivory is the primary driver, then exclosure plots should show significantly greater NPP (biomass production) than open control plots, while plots receiving supplemental water but exposed to herbivory should show little or no improvement. A statistically significant difference in biomass between exclosure and control plots (e.g., via t-test, p < 0.05), combined with no significant effect of irrigation alone, would support the herbivory hypothesis.

Question 5: CRITICAL THINKING

4 pts
The table below shows data from two ecosystems. Ecosystem A: GPP = 15,000 kcal/m²/yr, R (producers) = 7,500 kcal/m²/yr, Number of trophic levels = 4, Transfer efficiency = 15% Ecosystem B: GPP = 9,000 kcal/m²/yr, R (producers) = 2,700 kcal/m²/yr, Number of trophic levels = 5, Transfer efficiency = 10% (a) Calculate the NPP for each ecosystem. Show your work. (b) Calculate the energy available at the highest trophic level for each ecosystem. Show your work. (c) Based on your calculations, explain which ecosystem supports more energy at its top trophic level and identify the factor most responsible for this difference. (d) A researcher proposes that Ecosystem B could support a fifth trophic level because it has higher NPP. Evaluate this claim by comparing the energy available at the highest trophic level in each ecosystem.
Show answer
Rubric (4 points): Point 1 — NPP Calculation (1 pt): Ecosystem A: NPP = 15,000 − 7,500 = 7,500 kcal/m²/yr. Ecosystem B: NPP = 9,000 − 2,700 = 6,300 kcal/m²/yr. Point 2 — Energy at Highest Trophic Level (1 pt): Ecosystem A (TL4): Eₙ = 7,500 × (0.15)³ = 7,500 × 0.003375 = 25.3 kcal/m²/yr. Ecosystem B (TL5): Eₙ = 6,300 × (0.10)⁴ = 6,300 × 0.0001 = 0.63 kcal/m²/yr. Point 3 — Comparison and Explanation (1 pt): Ecosystem A supports far more energy at its top trophic level (25.3 vs. 0.63 kcal/m²/yr). Although Ecosystem A has higher NPP and a higher transfer efficiency (15% vs. 10%), the most impactful factor is the number of trophic levels: each additional level causes an exponential decline in available energy. Having five trophic levels with 10% efficiency requires raising 0.10 to the fourth power, yielding a 10,000-fold reduction from the base. Point 4 — Evaluating the Researcher's Claim (1 pt): The researcher's claim is incorrect on two counts. First, Ecosystem A actually has the higher NPP (7,500 vs. 6,300 kcal/m²/yr). Second, even if Ecosystem B did have higher NPP, the addition of a fifth trophic level at 10% efficiency reduces available energy to just 0.63 kcal/m²/yr — far less than the 25.3 kcal/m²/yr available at Ecosystem A's top trophic level. The exponential energy loss per trophic transfer, not just initial NPP, determines whether additional trophic levels can be sustained.

SUMMARY

Lesson Summary

Summary

An ecosystem is a functional unit comprising biotic organisms and their abiotic environment, governed by two fundamental processes: unidirectional energy flow and cyclical nutrient recycling. Energy enters as sunlight, is fixed by producers into gross primary productivity (GPP), and is reduced to net primary productivity (NPP = GPP − R) after producer respiration. The 10% rule of ecological efficiency dictates that only approximately 10% of energy transfers between successive trophic levels, with the remaining 90% lost as metabolic heat — an irreversible consequence of the second law of thermodynamics.

These constraints explain key ecological patterns: apex predators are rare because so little energy reaches upper trophic levels, tropical rainforests and estuaries are the most productive biomes due to abundant sunlight, warmth, water, and nutrients, and food webs confer greater ecosystem resilience than simple food chains. For the AP exam, remember the key equation Eₙ = E₁ × (efficiency)ⁿ⁻¹, always use NPP (not GPP) as the starting energy for trophic calculations, and show all work with units in FRQ responses.

Varsity Tutors • AP Environmental Science • Introduction to Ecosystems