

AP Environmental Science • Atmospheric Pollution

Introduction to Air Pollution

Understanding the sources, categories, and consequences of pollutants that degrade Earth's atmosphere.

A sprouting plant framed by Earth and recycling symbols.
Inside this lesson 9 sections 5 questions 8 figures

SECTION 1

Historical Context & Motivation

Air pollution is not a modern invention — wood-burning fires in enclosed Neolithic dwellings left soot deposits on human lung tissue thousands of years ago. However, the systematic degradation of atmospheric quality accelerated dramatically with the onset of industrialization in the eighteenth and nineteenth centuries. Coal combustion powered factories and locomotives, but it also released massive quantities of sulfur dioxide (SO2) and particulate matter into urban air. As cities grew denser, episodes of lethal smog forced governments to confront the public health dimensions of polluted air, ultimately giving rise to modern environmental regulation.

1306 • First Recorded Air-Quality Law

King Edward I of England banned the burning of sea-coal in London due to its noxious smoke, marking one of the earliest legislative attempts to regulate air quality.

1952 • Great Smog of London

A temperature inversion trapped coal smoke over London for five days, killing an estimated 4,000–12,000 people and prompting the UK's Clean Air Act of 1956.

1970 • U.S. Clean Air Act

The United States enacted comprehensive federal legislation empowering the newly created EPA to set National Ambient Air Quality Standards (NAAQS) for six criteria pollutants.

1987 • Montreal Protocol

International agreement phased out chlorofluorocarbons (CFCs) and other ozone-depleting substances, widely regarded as the most successful environmental treaty in history.

2015 • Paris Agreement

Nearly 200 nations committed to limiting global warming, linking greenhouse gas emissions — themselves air pollutants — to international climate policy.

These milestones illustrate a recurring pattern: catastrophic pollution events drive public awareness, which in turn generates political will for regulation. The central question this lesson addresses is straightforward yet essential — what substances pollute the atmosphere, where do they come from, and how do scientists classify and measure them? Answering these questions provides the conceptual foundation for every subsequent topic in atmospheric pollution, from acid deposition to stratospheric ozone depletion.

SECTION 2

Core Principles & Definitions

An air pollutant is any substance in the atmosphere at concentrations high enough to harm living organisms, damage materials, or impair visibility. Not every trace gas qualifies — CO2 is a natural component of air at ~420 ppm, but the rapid anthropogenic increase above pre-industrial baselines makes it a pollutant in the regulatory and climatic sense. Air pollutants are categorized along several axes: their origin (natural vs. anthropogenic), their chemical formation pathway (primary vs. secondary), and their spatial scale (local, regional, or global).

1

Primary Pollutants

Emitted directly from a source into the atmosphere. Examples include CO, SO2, NOx, particulate matter, and volatile organic compounds (VOCs).
2

Secondary Pollutants

Formed in the atmosphere through chemical reactions among primary pollutants and natural atmospheric components. Tropospheric ozone (O3) and photochemical smog are key examples.
3

Criteria Pollutants

Six pollutants regulated under the U.S. Clean Air Act for which the EPA sets NAAQS: CO, Pb, NO2, O3, PM, and SO2.
4

Point vs. Nonpoint Sources

Point sources are identifiable, discrete emitters such as smokestacks. Nonpoint (fugitive) sources are diffuse — vehicle exhaust spread across a highway network, or dust from agricultural fields.
5

Indoor vs. Outdoor Pollution

Indoor air pollution (e.g., radon, carbon monoxide from stoves, VOCs from solvents) can be more immediately hazardous than outdoor air due to poor ventilation and prolonged exposure.

SECTION 3

Visual Explanation — Sources & Pathways

Primary & Secondary Air Pollutant PathwaysFactory(Point Source)Vehicles(Nonpoint)PRIMARY POLLUTANTSSO₂, NOₓ, CO, PM, VOCs(emitted directly)UVCHEMICAL REACTIONSNOₓ + VOCs + sunlight →SECONDARY POLLUTANTSO₃, H₂SO₄, HNO₃, smog(formed in atmosphere)ENVIRONMENTAL IMPACTSAcid deposition · Smog · Respiratory harmOzone damage · Reduced visibility
This diagram traces pollutant pathways from emission sources (factory as a point source, vehicles as a nonpoint source) through primary pollutant release (violet box) and atmospheric chemical reactions (amber box) to the formation of secondary pollutants (pink box) and their resulting environmental impacts (red box). Dashed lines indicate that primary pollutants can also directly cause harm.

The diagram above encapsulates the fundamental architecture of atmospheric pollution. Primary pollutants enter the atmosphere directly from identifiable sources — a coal-fired power plant's smokestack (point source) or the collective exhaust of thousands of vehicles across a metropolitan highway network (nonpoint source). Once airborne, some of these species undergo photochemical and oxidative reactions driven by solar ultraviolet radiation, producing secondary pollutants such as tropospheric ozone (O3), sulfuric acid (H2SO4), and nitric acid (HNO3). The red box at bottom right reminds us that both primary and secondary pollutants contribute to a spectrum of environmental and health effects — from reduced visibility and corroded infrastructure to respiratory disease and ecosystem acidification.

SECTION 4

How Air Pollutants Form & Behave

Photochemical Smog Formation

The formation of photochemical smog — the brown haze characteristic of cities like Los Angeles and Beijing — follows a well-documented sequence driven by nitrogen oxides and volatile organic compounds in the presence of sunlight. During morning rush hour, vehicle engines combust fuel at high temperatures, producing nitric oxide (NO), which is rapidly oxidized to nitrogen dioxide (NO2). Solar UV radiation then photolyzes NO2, releasing atomic oxygen that combines with O2 to form tropospheric ozone. Simultaneously, VOCs from fuel evaporation and industrial processes participate in radical-chain reactions that sustain ozone accumulation throughout the afternoon.

NO₂ PHOTOLYSIS

NO2+UV→NO+ONO₂ + UV → NO + O

Ultraviolet radiation splits nitrogen dioxide into nitric oxide and a reactive oxygen atom.

OZONE FORMATION

O+O2→O3O + O₂ → O₃

The freed oxygen atom combines with molecular oxygen to form tropospheric ozone — a harmful secondary pollutant at ground level.

Acid Deposition Chemistry

Sulfur dioxide and nitrogen oxides emitted from coal-fired power plants and smelters undergo atmospheric oxidation to form sulfuric and nitric acids. These acids dissolve in cloud droplets, falling as acid deposition (wet or dry). Normal rain has a pH of about 5.6 due to dissolved CO2; acid rain can drop below pH 4.2, stressing aquatic ecosystems and leaching essential nutrients from soils.

SULFURIC ACID FORMATION

2SO2+O2+2H2O→2H2SO42 SO₂ + O₂ + 2 H₂O → 2 H₂SO₄

Simplified net reaction: sulfur dioxide is oxidized and hydrated in the atmosphere to form sulfuric acid, the principal component of acid rain.

Temperature Inversions & Pollutant Trapping

Under normal atmospheric conditions, air temperature decreases with altitude and warm polluted air rises, dispersing contaminants. A temperature inversion occurs when a layer of warm air sits above cooler surface air, acting as a lid that prevents vertical mixing. Pollutants accumulate near ground level, and concentrations can spike to dangerous levels — precisely the mechanism behind the 1952 London Smog disaster. Inversions are especially common in valleys (topographic trapping) and coastal cities where marine layers create stable stratification.

SECTION 5

The Six Criteria Pollutants

Under the Clean Air Act, the U.S. EPA established National Ambient Air Quality Standards (NAAQS) for six criteria pollutants — so named because their regulation is based on health-effects criteria documents. These six pollutants are the backbone of air-quality monitoring worldwide, and virtually every AP Environmental Science exam includes questions about their sources, effects, and regulatory status.

The Six EPA Criteria PollutantsCO — Carbon MonoxidePrimary pollutantSource: Incomplete combustion(vehicles, wood stoves)Effect: Binds hemoglobin →reduces O₂ transportPb — LeadPrimary pollutantSource: Smelters, leaded fuels(now largely phased out)Effect: Neurotoxin; impairsbrain development in childrenNO₂ — Nitrogen DioxidePrimary pollutantSource: Vehicle & power-plantcombustion at high tempsEffect: Respiratory irritant;precursor to O₃ & acid rainO₃ — Tropospheric OzoneSecondary pollutantSource: NOₓ + VOCs + sunlightEffect: Damages lung tissue,harms crops, degrades rubberPeak levels in afternoonPM — Particulate MatterPrimary & secondarySource: Combustion, dust,chemical reactions (PM₂.₅ & PM₁₀)Effect: Penetrates lungs;cardiovascular & respiratory diseaseSO₂ — Sulfur DioxidePrimary pollutantSource: Coal combustion,ore smelting, volcanoesEffect: Respiratory irritant;major acid rain precursorMnemonic: "CO Pb NO₂ O₃ PM SO₂" → Think of the phrase"Cows Pull Noses Off Pretty Slowly"Primary pollutants: CO, Pb, NO₂, SO₂ (and some PM)Secondary pollutant: O₃ (and some PM)Both primary & secondary: PM (emitted directly and formed from gas-to-particle conversion)
The six EPA criteria pollutants are displayed as cards color-coded by type: each card lists the pollutant's classification (primary or secondary), major sources, and health/environmental effects. Note that particulate matter is unique in being both primary and secondary, and that tropospheric ozone is the only purely secondary criteria pollutant.
ℹ
AP Exam Tip

SECTION 6

Worked Example — Calculating AQI-Related Concentrations

The Air Quality Index (AQI) translates measured pollutant concentrations into a unitless number from 0 to 500 that communicates health risk. While the full AQI calculation uses breakpoint tables, the underlying linear interpolation formula is tested conceptually and quantitatively on the AP exam.

AQI LINEAR INTERPOLATION

AQI=[(Ihigh−Ilow)/(Chigh−Clow)]×(C−Clow)+IlowAQI = [(I_high − I_low) / (C_high − C_low)] × (C − C_low) + I_low

Where C = observed concentration, Clow and Chigh are the breakpoint concentrations bounding C, and Ilow and Ihigh are the corresponding AQI breakpoints.

Worked example

  1. 1

    Step 1 — Identify the Observed Concentration

    A monitoring station records a 24-hour average PM2.5 concentration of 45.0 µg/m³. We need to find the corresponding AQI value.
  2. 2

    Step 2 — Look Up Breakpoints

    From the EPA breakpoint table for PM2.5: the concentration 45.0 µg/m³ falls in the "Unhealthy for Sensitive Groups" range. Clow = 35.5, Chigh = 55.4, Ilow = 101, Ihigh = 150.
  3. 3

    Step 3 — Substitute into the Formula

    AQI = [(150 − 101) / (55.4 − 35.5)] × (45.0 − 35.5) + 101 = [49 / 19.9] × 9.5 + 101
  4. 4

    Step 4 — Calculate

    AQI = 2.4623 × 9.5 + 101 = 23.4 + 101 = 124.4, which rounds to AQI ≈ 124.
    AQI ≈ 124 — "Unhealthy for Sensitive Groups"
  5. 5

    Step 5 — Interpret

    An AQI of 124 means sensitive individuals — children, elderly, and those with asthma — should reduce prolonged outdoor exertion. The general population is not yet at significant risk, but air quality is clearly degraded.

SECTION 7

Impacts, Control Strategies & Limitations

Mitigating air pollution requires a portfolio of technological, regulatory, and behavioral strategies. No single approach is universally effective; each has characteristic strengths and trade-offs. The table below compares major control technologies that frequently appear on the AP exam.

Control TechnologyTarget Pollutant(s)MechanismLimitations
Catalytic ConverterCO, NOₓ, VOCsPlatinum/palladium catalysts oxidize CO and hydrocarbons to CO₂ and H₂O; reduce NOₓ to N₂Requires unleaded fuel; does not address PM or CO₂
Electrostatic PrecipitatorParticulate matterElectrically charges particles, which are then attracted to collection platesHigh energy cost; ineffective for gaseous pollutants; collected ash may be hazardous
Scrubber (Wet)SO₂, some PMSprays alkaline solution (e.g., CaCO₃ slurry) through flue gas; SO₂ reacts to form CaSO₄Produces sludge waste; high water use; energy-intensive
Baghouse FilterParticulate matterFabric bags capture PM as flue gas passes through, like a giant vacuum cleanerBags must be replaced; limited to dry, low-temperature gases
Cap-and-TradeSO₂ (Acid Rain Program)Government sets emission cap; firms buy/sell allowances, creating market incentive to reduceDoes not guarantee local air quality; can create pollution hotspots near low-income communities

Key emission control strategies and their trade-offs
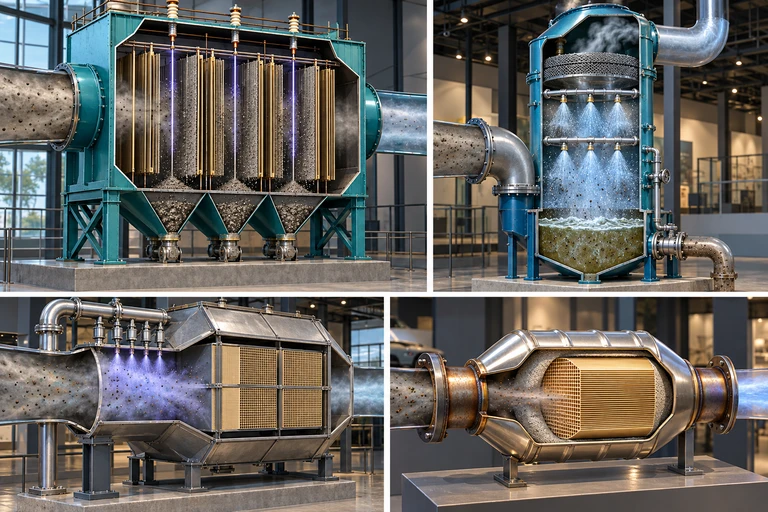
Four industrial cutaways show particle-collection plates,a spray scrubber,a catalyst reactor and a vehicle honeycomb converter.Electrostatic collection transfers particles to collected ash. Alkaline scrubbing transfers sulfur species into a managed liquid or solid waste stream. Different pollutants require different removal mechanisms.
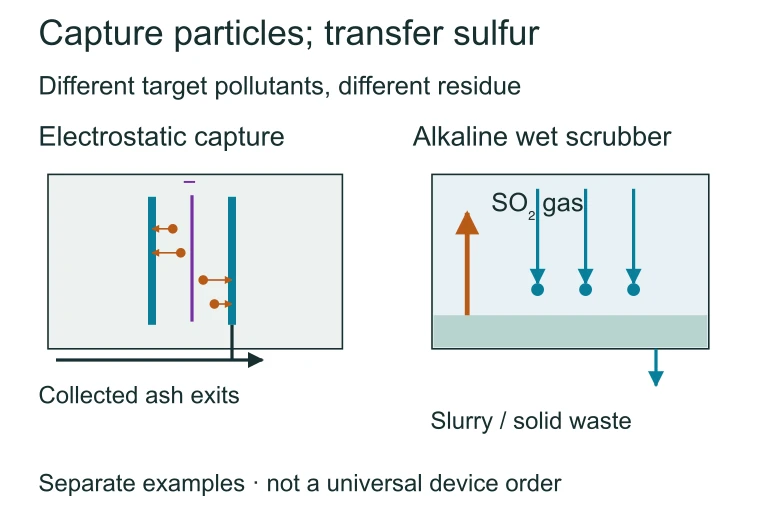
Control devices remove different pollutants through distinct mechanisms. Electrostatic collection transfers particles to collected ash. Alkaline scrubbing transfers sulfur species into a managed liquid or solid waste stream. Different pollutants require different removal mechanisms.Electrostatic collection transfers particles to collected ash. Alkaline scrubbing transfers sulfur species into a managed liquid or solid waste stream. Different pollutants require different removal mechanisms.
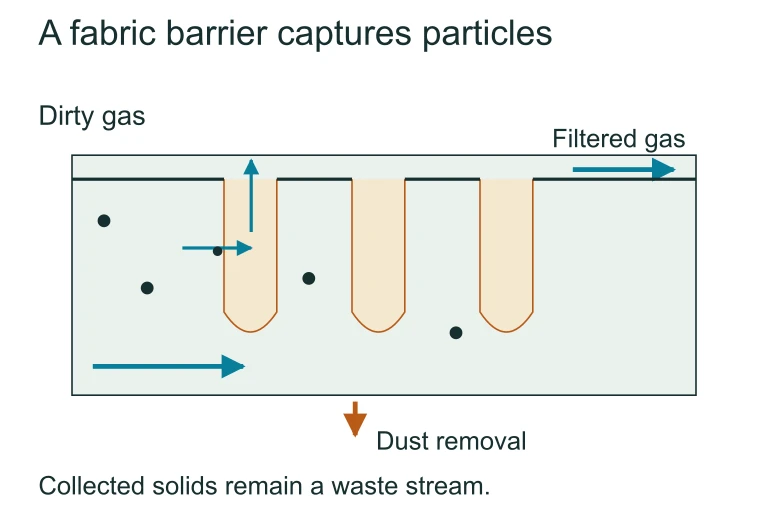
Fabric filtration. Fabric filtration captures particles in a dust layer while cleaned gas passes through. Collected solids leave as a separate waste stream.Fabric filtration captures particles in a dust layer while cleaned gas passes through. Collected solids leave as a separate waste stream.
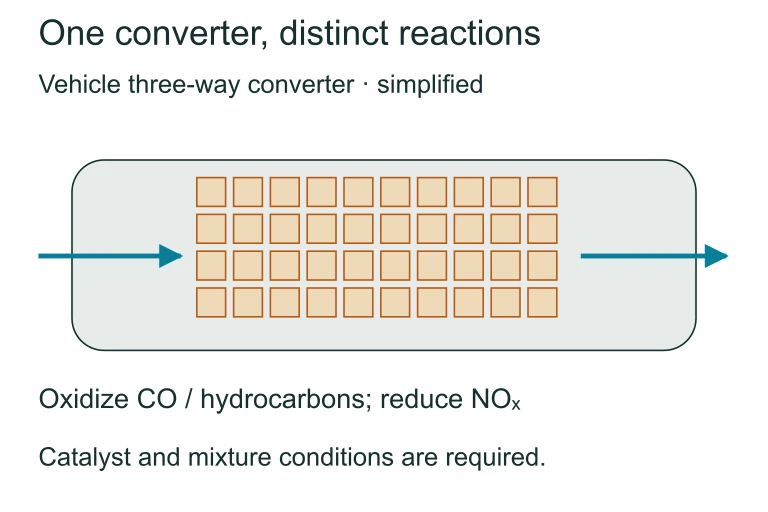
Vehicle catalyst honeycomb. A vehicle catalytic converter promotes oxidation of carbon monoxide and hydrocarbons and reduction of nitrogen oxides. These reactions target different pollutants through different catalytic pathways.A vehicle catalytic converter promotes oxidation of carbon monoxide and hydrocarbons and reduction of nitrogen oxides. These reactions target different pollutants through different catalytic pathways.

SECTION 8

Connecting Local Pollution to Global Atmospheric Issues

The pollutants introduced in this lesson sit at the foundation of several broader atmospheric topics you will encounter later in the AP Environmental Science curriculum. Understanding how local emissions scale to regional and global problems is essential for mastering the exam's integrative free-response questions.

Local / Regional ConceptGlobal Extension
SO₂ and NOₓ emissions → acid depositionTransboundary acid rain (e.g., U.S. emissions affecting Canadian lakes); international air-quality treaties
Tropospheric ozone formation from NOₓ + VOCsStratospheric ozone depletion from CFCs — different process, same molecule, different altitude
CO₂ as a combustion byproductGreenhouse effect and anthropogenic climate change; Paris Agreement emissions targets
PM₂.₅ from biomass burningGlobal aerosol loading; dimming effect that partially offsets greenhouse warming
Indoor air pollution (radon, CO, PM from cook stoves)Leading environmental health risk in developing nations; ~3.2 million premature deaths/year (WHO)

How introductory pollution concepts connect to advanced atmospheric topics

As you progress through units on climate change, ozone depletion, and environmental policy, you will revisit the same chemical species — SO2, NOx, CO2, O3, PM — but analyzed at increasingly larger spatial and temporal scales. The conceptual vocabulary you have built here (primary vs. secondary, point vs. nonpoint, criteria pollutants, temperature inversions, AQI) forms the scaffold upon which those advanced topics rest.

SECTION 9

Practice Problems

Question 1: CONCEPTUAL

Tropospheric ozone is classified as a secondary pollutant because it:
  • A. is emitted directly from vehicle tailpipes during combustion
  • B. forms in the atmosphere through reactions among NOₓ, VOCs, and sunlight
  • C. exists naturally in the stratosphere and drifts down to the troposphere
  • D. is released from industrial scrubbers as a byproduct of SO₂ removal
Show answer (B)
B is correct. By definition, a secondary pollutant is not emitted directly but forms through atmospheric chemical reactions. Tropospheric O₃ results from photochemical reactions among nitrogen oxides and volatile organic compounds driven by UV radiation. A is wrong because ozone is not emitted from tailpipes — NOₓ and VOCs are, and they are primary pollutants. C is wrong because stratospheric ozone does not significantly migrate to ground level under normal conditions; tropospheric ozone is produced in situ. D is wrong because scrubbers target SO₂, not ozone, and they do not produce O₃ as a byproduct.

Question 2: BASIC CALCULATION

A coal-fired power plant burns coal containing 2.5% sulfur by mass. If the plant burns 1,000 metric tons of coal per day, how many metric tons of SO₂ are released daily? (Assume all sulfur is converted to SO₂. Atomic masses: S = 32, O = 16.)
  • A. 25 metric tons
  • B. 50 metric tons
  • C. 64 metric tons
  • D. 100 metric tons
Show answer (B)
B is correct. Sulfur in coal = 2.5% × 1,000 = 25 metric tons of S. Each mole of S (32 g) produces one mole of SO₂ (64 g), so the mass ratio is 64/32 = 2. Therefore, SO₂ produced = 25 × 2 = 50 metric tons. A (25 tons) is the mass of sulfur alone, ignoring the added oxygen. C (64 tons) incorrectly multiplies 25 by the molar mass of SO₂ divided by some other factor. D (100 tons) appears to mistakenly double the correct answer or confuse the sulfur percentage.

Question 3: INTERMEDIATE

A city experiences its highest ozone levels at 3:00 PM on sunny summer days, but ozone concentrations drop sharply after sunset. Which of the following best explains this pattern?
  • A. Factories shut down at night, eliminating the direct source of ozone emissions
  • B. Ozone formation requires UV-driven photolysis of NO₂, which ceases when sunlight is absent; NO then scavenges remaining O₃
  • C. Temperature inversions only form at night, trapping ozone near the surface during morning hours
  • D. Wind patterns shift at night, dispersing ozone to rural areas where it is undetectable
Show answer (B)
B is correct. Tropospheric ozone production depends on UV-driven photolysis of NO₂ to release atomic oxygen, which then combines with O₂ to form O₃. Without sunlight, this reaction halts, and accumulated NO (which is still being emitted) reacts with existing O₃ (NO + O₃ → NO₂ + O₂), depleting ozone overnight. A is wrong because ozone is a secondary pollutant — it is not directly emitted from factories. C is wrong because inversions trap all pollutants, not selectively ozone, and the described pattern is about daytime peaks, not morning. D is wrong because while dispersion occurs, the primary driver of the diurnal cycle is the dependence on photochemistry, not wind.

Question 4: APPLIED

A regional environmental agency is designing a study to evaluate whether installing wet scrubbers at three coal-fired power plants in a river valley has reduced acid deposition in nearby lakes over five years. (a) State a testable hypothesis for this investigation. (b) Identify an appropriate dependent variable and explain how it would be measured. (c) Describe two variables that should be controlled or accounted for to strengthen the study's validity. (d) Explain one limitation of using lake chemistry data to attribute changes specifically to the scrubber installations.
Show answer
(a) Hypothesis: If wet scrubbers are installed at the three coal-fired power plants, then the average pH of downstream lakes will increase significantly over the five-year study period compared to pre-installation baseline measurements. (b) Dependent variable: lake water pH, measured quarterly using a calibrated digital pH meter at a standardized depth (e.g., 1 m below surface) at the same sampling locations. Alternatively, sulfate ion concentration (SO₄²⁻) measured via ion chromatography would directly track the pollutant of interest. (c) Controlled variable 1: Total precipitation volume and seasonal distribution, because acid deposition is partly a function of rainfall amount and not just pollutant concentration. Controlled variable 2: Emissions from other sources in the airshed (e.g., vehicle traffic, other industrial facilities) must be monitored to ensure observed changes are attributable to the scrubbers specifically. (d) Limitation: Lake chemistry integrates multiple inputs — agricultural runoff, natural weathering, biological activity — making it difficult to attribute pH changes solely to scrubber installation. Other emission reductions occurring simultaneously (e.g., broader regulatory compliance, plant closures) could confound the results, and there may be a multi-year lag between atmospheric SO₂ reductions and measurable lake chemistry responses due to soil buffering dynamics.

Question 5: CRITICAL THINKING

The table below shows annual SO₂ emissions and average lake pH for a region over four years. Year 1: SO₂ = 80,000 tons, Lake pH = 4.5 Year 2: SO₂ = 60,000 tons, Lake pH = 4.6 Year 3: SO₂ = 40,000 tons, Lake pH = 4.9 Year 4: SO₂ = 20,000 tons, Lake pH = 5.3 (a) Calculate the total percent reduction in SO₂ emissions from Year 1 to Year 4. (b) Describe the trend between SO₂ emissions and lake pH. (c) The regional goal is to raise lake pH to 5.6 (normal rain pH). Based on the observed trend, estimate the SO₂ emission level needed, and state one assumption you are making. (d) Explain why achieving a lake pH of 5.6 may require emission reductions beyond what the linear trend suggests.
Show answer
(a) Percent reduction = (80,000 − 20,000) / 80,000 × 100 = 75%. SO₂ emissions declined by 75% over the four-year period.(b) There is an inverse relationship: as SO₂ emissions decrease, lake pH increases (the water becomes less acidic). Each 20,000-ton reduction in emissions is associated with a measurable increase in pH, though the increments are not perfectly uniform (0.1, 0.3, 0.4).(c) From Year 4, pH needs to increase from 5.3 to 5.6, a difference of 0.3. Over the last interval (Year 3 to Year 4), a 20,000-ton reduction raised pH by 0.4. Assuming a roughly linear relationship continues, an additional reduction of approximately 15,000 tons (reducing emissions to about 5,000 tons) might achieve a pH of 5.6. Key assumption: the linear relationship between emission reductions and pH increase continues to hold at low emission levels.(d) The pH response to emission reductions is unlikely to remain linear for several reasons. First, legacy sulfate stored in soils and lake sediments can continue leaching into waterways even after atmospheric inputs decline, creating a lag effect that keeps water acidic. Second, natural buffering capacity varies among ecosystems — once soil carbonates are depleted, even small acid inputs can maintain low pH, so recovery may stall. Third, other acid sources such as nitrogen oxides (which form nitric acid) and natural organic acids contribute to lake acidity independently of SO₂, meaning that eliminating SO₂ alone may not be sufficient to reach the target pH. Finally, pH is measured on a logarithmic scale, so each unit increase requires a tenfold reduction in hydrogen ion concentration, making higher pH targets disproportionately harder to achieve. For all of these reasons, reaching a lake pH of 5.6 may require emission reductions well beyond what a simple linear extrapolation of the data would suggest.

Varsity Tutors • AP Environmental Science • Introduction to Air Pollution