

SECTION 1
Historical Context & Motivation
For most of agricultural history, farmers relied on manual labor, crop rotation, and simple cultural practices to manage pests. The advent of synthetic chemical pesticides in the mid-twentieth century—particularly DDT and organophosphates—promised to eliminate pest damage entirely, ushering in an era of heavy chemical dependence. However, within two decades, researchers observed alarming consequences: pesticide-resistant pest populations, decimation of beneficial insect species, bioaccumulation in food webs, and widespread contamination of soil and water resources. These failures demonstrated that chemical-only strategies were ecologically unsustainable and often economically self-defeating, as farmers entered a pesticide treadmill—needing ever-greater quantities of increasingly potent chemicals to achieve the same results.
1939 • DDT's Insecticidal Properties Discovered
1962 • Silent Spring Published
1972 • DDT Banned in the United States
1972 • IPM Concept Formalized
1996 • Food Quality Protection Act
The central question that IPM addresses is deceptively simple: How can we suppress pest populations below economically damaging levels without destabilizing the broader ecosystem? Answering this question requires integrating knowledge from ecology, economics, agronomy, and toxicology into a coherent decision-making framework—precisely what IPM provides.
SECTION 2
Core Principles & Definitions
Integrated Pest Management (IPM) is a systematic, ecologically based approach to pest control that combines multiple strategies—biological, cultural, mechanical, and chemical—to keep pest populations below an economic injury level (EIL) while minimizing risks to human health and the environment. Rather than eliminating pests entirely, IPM accepts that low-level pest populations are normal components of agroecosystems and focuses management decisions on whether intervention is economically justified. The decision to act hinges on the concept of the economic threshold (ET)—the pest density at which control measures should be initiated to prevent the population from reaching the EIL.
Biological Control
Cultural Control
Mechanical / Physical Control
Chemical Control (Last Resort)
Monitoring & Scouting
SECTION 3
The IPM Decision Pyramid
Notice that the pyramid's width at each tier is proportional to how frequently that category of control should be employed in a well-designed IPM program. Cultural and preventive measures—such as crop rotation, resistant cultivars, and habitat management for beneficial insects—operate continuously throughout the growing season with minimal additional cost once implemented. Mechanical controls like trapping and tillage require more labor input and are typically used in response to monitoring data. Biological controls, including the augmentative release of natural enemies, demand ecological expertise and careful timing. Chemical controls sit at the narrow apex because they carry the greatest environmental externalities and are reserved for situations where pest populations have crossed the economic threshold despite the use of all lower-tier approaches.
SECTION 4
Economic Thresholds & Decision-Making
The quantitative backbone of IPM rests on two interrelated concepts. The Economic Injury Level (EIL) is the lowest pest population density that will cause crop damage equal in value to the cost of control measures. Below the EIL, the economic loss from pest damage is less than the cost of intervention, making treatment irrational from a cost-benefit standpoint. The Economic Threshold (ET), sometimes called the action threshold, is set below the EIL to provide a safety margin—it is the pest density at which control should be initiated so that the population does not exceed the EIL before the treatment takes effect.
ECONOMIC INJURY LEVEL
Where C = cost of management per unit area, V = market value per unit of crop, I = crop injury per pest unit, D = damage per unit injury (yield loss proportion), and K = efficacy of the control measure (proportion of pests killed, 0 to 1).
This formula reveals that the EIL is dynamic—it shifts with commodity prices, input costs, pest biology, and treatment efficacy. When crop market value (V) rises, the EIL decreases because even small amounts of damage translate into significant economic loss, justifying earlier intervention. Conversely, when control costs (C) increase, the EIL rises because the treatment must prevent greater damage to be worthwhile. A highly effective pesticide (K close to 1) lowers the EIL, while a less effective biological control agent (K of 0.5) raises it, meaning the farmer can tolerate a higher pest density before deploying that particular method.
COST-BENEFIT RULE
The ET is typically set at 75–80% of the EIL. If monitoring reveals that pest density exceeds this threshold, the farmer initiates the least disruptive effective control method.
SECTION 5
Detailed Breakdown of Control Strategies
| Control Type | Examples | Advantages | Limitations |
|---|---|---|---|
| Biological | Ladybugs for aphids; Bt for caterpillars; parasitoid wasps; sterile male technique | Species-specific; self-sustaining if established; no chemical residues | Slow to establish; may not work for all pests; nonnative biocontrol agents can become invasive |
| Cultural | Crop rotation; intercropping; planting date adjustment; resistant cultivars; sanitation | Low cost; preventive; builds long-term soil and ecosystem health | Requires planning and knowledge; effects are gradual; may reduce short-term yield flexibility |
| Mechanical | Traps; row covers; hand-picking; tillage; mulching | No chemical residues; immediate effect; simple technology | Labor-intensive; not scalable for large operations; tillage may increase erosion |
| Chemical | Selective insecticides; pheromone-baited traps; insect growth regulators | Fast-acting; effective at high pest densities; wide availability | Resistance evolution; nontarget mortality; water contamination; pesticide treadmill |
Comparison of IPM control strategies
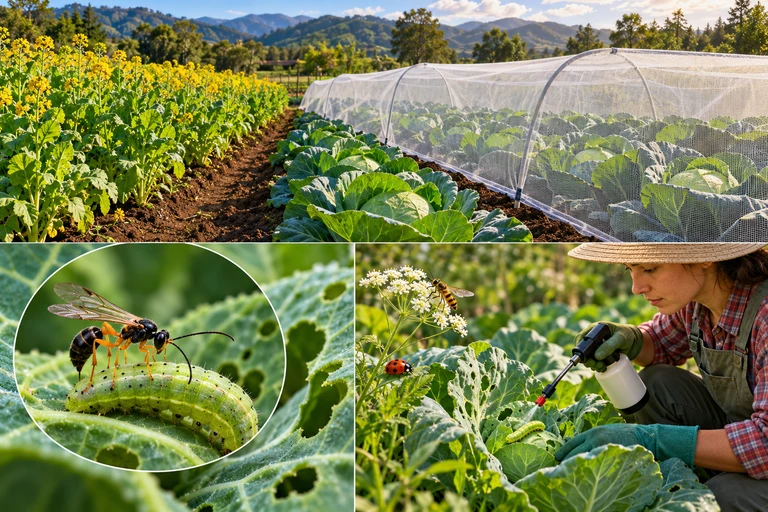 Pest controls can interrupt host availability, exclude pests physically, use natural enemies, or apply a directed treatment. Effective choices depend on the pest, host, timing and non-target effects.
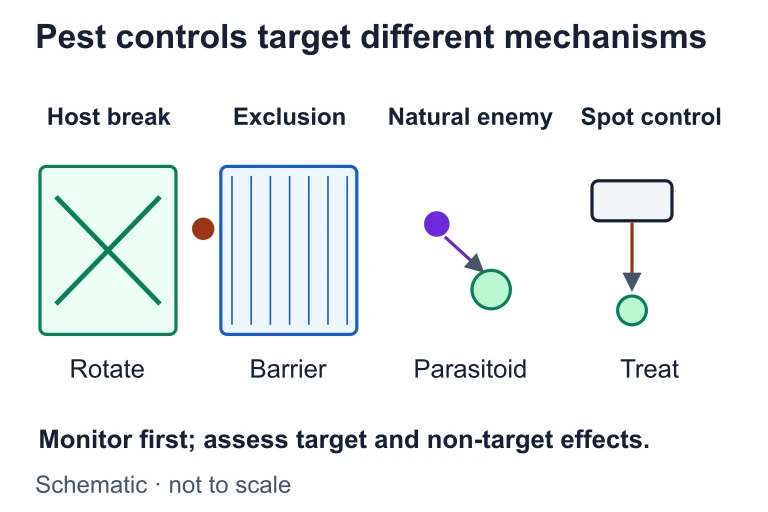 Pest controls can interrupt host availability, exclude pests physically, use natural enemies, or apply a directed treatment. Effective choices depend on the pest, host, timing and non-target effects.
SECTION 6
Worked Example: Calculating the EIL
Consider a soybean farmer facing a bean leaf beetle outbreak. The following data are available: the cost of insecticide application is $12 per acre; soybeans are valued at $10 per bushel; each beetle per plant causes 0.05 bushels per acre of yield loss; damage per unit injury is 1.0 (complete translation of injury to loss); and the insecticide kills 90% of beetles (K = 0.90). Determine the Economic Injury Level.
Worked example
- 1
Step 1 — Identify Given Values
C = $12/acre, V = $10/bushel, I = 0.05 bushels per acre lost per beetle per plant, D = 1.0, K = 0.90. - 2
Step 2 — Write the EIL Formula
EIL = C / (V × I × D × K) - 3
Step 3 — Substitute Values
EIL = 12 / (10 × 0.05 × 1.0 × 0.90) = 12 / (0.45) - 4
Step 4 — Calculate
EIL = 26.67 beetles per plant. This means that the pest population must reach approximately 26.7 beetles per plant before the economic damage equals the cost of treatment.EIL ≈ 26.7 beetles per plant - 5
Step 5 — Determine the Economic Threshold
Setting the ET at approximately 75–80% of the EIL: ET ≈ 0.75 × 26.7 ≈ 20 beetles per plant. The farmer should initiate control measures when scouting reveals approximately 20 beetles per plant to prevent the population from exceeding the EIL.ET ≈ 20 beetles per plant
SECTION 7
IPM vs. Conventional Pest Management
| Criterion | IPM Approach | Conventional Chemical Approach |
|---|---|---|
| Goal | Maintain pest populations below economic threshold | Eliminate pests as completely as possible |
| Pesticide use | Minimal; targeted; last resort | Routine; calendar-based; broad-spectrum |
| Pest resistance risk | Low—multiple selection pressures slow resistance | High—strong directional selection for resistance alleles |
| Impact on beneficial species | Preserved; natural enemies enhance control | Often killed; reduces natural pest regulation |
| Long-term cost | Generally lower due to reduced chemical inputs | Escalates as resistance builds (pesticide treadmill) |
| Knowledge requirement | High—requires ecological understanding and monitoring | Lower—follow product application schedules |
| Environmental externalities | Minimal water/soil contamination; supports biodiversity | Runoff, bioaccumulation, eutrophication risk, pollinator decline |
IPM vs. Conventional Pest Management Comparison
SECTION 8
Connections to Broader Environmental Topics
IPM does not exist in a vacuum; it intersects with virtually every major theme in AP Environmental Science. Understanding these connections strengthens your ability to address cross-cutting FRQ prompts that link pest management to ecosystem services, pollution, biodiversity, and sustainability.
| APES Topic | Connection to IPM |
|---|---|
| Biodiversity & Ecosystem Services | IPM preserves pollinator and predator populations, maintaining natural pest regulation and crop pollination—ecosystem services valued at billions of dollars annually. |
| Water Pollution & Eutrophication | Reducing pesticide runoff decreases contamination of aquatic ecosystems. Some pesticides degrade into nutrients that contribute to algal blooms. |
| Bioaccumulation & Biomagnification | DDT's concentration through trophic levels (e.g., eggshell thinning in raptors) is a classic example of why IPM minimizes persistent chemical use. |
| Genetic Engineering & GMOs | Bt crops (genetically modified to express Bacillus thuringiensis toxins) represent a form of biological control embedded in the plant. Refuge strategies to delay pest resistance are an IPM-aligned practice. |
| Sustainable Agriculture | IPM is a cornerstone of sustainable farming systems, reducing input costs, protecting soil biota, and supporting long-term productivity. |
Looking ahead, advanced agroecological research is integrating IPM with precision agriculture technologies such as drone-based remote sensing, machine learning pest identification algorithms, and variable-rate spraying systems that apply chemicals only to detected hotspots. These innovations promise to further reduce pesticide inputs while maintaining or improving crop yields—a trajectory that aligns with the broader global push toward meeting the UN Sustainable Development Goals for food security and environmental protection.
SECTION 9
Practice Problems
Question 1: CONCEPTUAL
- A. The pest population density at which crop damage begins to occur
- B. The pest population density at which control action should be initiated to prevent reaching the economic injury level
- C. The maximum amount of pesticide that can legally be applied per acre per year
- D. The minimum population of natural enemies needed to suppress a pest outbreak
Show answer (B)
Question 2: BASIC CALCULATION
- A. 62.5 aphids per stem
- B. 78.1 aphids per stem
- C. 50.0 aphids per stem
- D. 46.9 aphids per stem
Show answer (B)
Question 3: INTERMEDIATE
- A. Increased populations of natural pest predators in the field
- B. Reduced development of pesticide resistance in the target pest
- C. Complete eradication of all pest species from the field
- D. Decreased pesticide contamination of nearby waterways
Show answer (C)
Question 4: APPLIED
Show answer
Question 5: CRITICAL THINKING