

SECTION 1
Historical Context & Motivation
The recognition of indoor air pollution as a significant environmental health hazard is a relatively modern development, even though human exposure to indoor combustion products has been a reality since prehistoric campfires. For most of history, poorly ventilated cooking and heating fires produced smoke that caused respiratory disease in households across the globe, yet the concept of "indoor air quality" did not emerge as a formal field of study until the late twentieth century. The shift toward energy-efficient, tightly sealed buildings in the 1970s—prompted by the oil crisis—dramatically reduced natural ventilation and inadvertently concentrated pollutants indoors. The U.S. Environmental Protection Agency (EPA) now estimates that indoor air can be two to five times more polluted than outdoor air, a finding that underscores why this topic is central to the AP Environmental Science curriculum on atmospheric pollution.
1950s–60s • Asbestos & Radon Awareness
1970s • Energy Crisis & Sick Buildings
1986 • EPA Radon Report
2000s–Present • VOCs, Formaldehyde & Green Building
Given that the average person spends roughly 90% of their time indoors, the central question driving this topic is both practical and urgent: What pollutants accumulate in indoor environments, how do they affect human health and ecosystems, and what strategies can effectively reduce exposure? Answering these questions requires understanding pollutant sources, chemical behavior in enclosed spaces, and the regulatory and engineering frameworks designed to protect public health.
SECTION 2
Core Principles & Key Pollutants
Indoor air pollution arises from the interplay of pollutant sources, building ventilation rates, and the chemical and physical transformations that occur within enclosed spaces. Unlike outdoor pollution, which disperses through atmospheric mixing, indoor pollutants become concentrated in relatively small volumes of air, often at levels that exceed ambient outdoor concentrations. The primary categories of indoor air pollutants include combustion byproducts, biological agents, volatile organic compounds, radioactive gases, and particulate matter from a variety of sources. Each category is characterized by distinct sources, exposure pathways, and health endpoints, and the AP exam expects students to identify and compare them with precision.
Radon (²²²Rn)
Carbon Monoxide (CO)
Volatile Organic Compounds (VOCs)
Asbestos & Lead
Biological Pollutants
SECTION 3
Sources of Indoor Air Pollutants — Visual Overview
As shown in the diagram, indoor air pollutants originate from diverse sources that can be grouped by their physical and chemical nature. Combustion byproducts (CO, NO2, PM2.5) arise from gas stoves, furnaces, fireplaces, and environmental tobacco smoke (ETS). Chemical off-gassing releases VOCs such as formaldehyde from pressed-wood products, benzene from stored solvents, and toluene from paints. Geologic sources contribute radon-222 through foundation cracks, while legacy building materials such as asbestos insulation and lead-based paint release hazardous particulates when disturbed. Finally, biological pollutants proliferate in damp conditions, linking indoor air quality to moisture management and HVAC system maintenance.
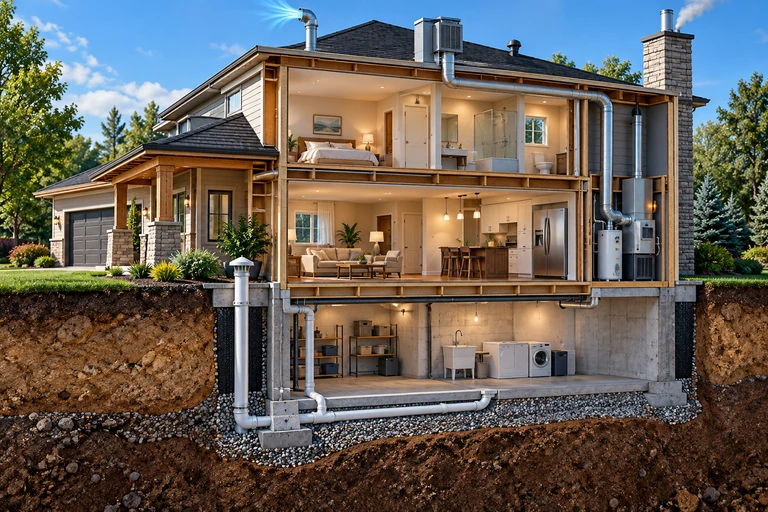 Source removal, appropriate ventilation and pollutant-specific treatment address different indoor exposure pathways. Matching the intervention to the pollutant and its entry route improves control.
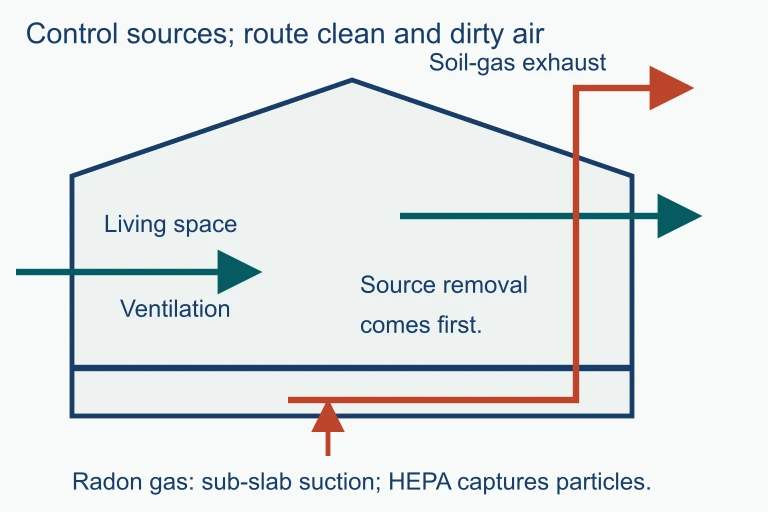 Source removal, appropriate ventilation and pollutant-specific treatment address different indoor exposure pathways. Matching the intervention to the pollutant and its entry route improves control.
SECTION 4
How Indoor Pollutants Accumulate & Affect Health
Indoor pollutant concentrations depend on a straightforward mass-balance principle: the rate at which pollutants are emitted into a space versus the rate at which they are removed through ventilation, filtration, or chemical reaction. When buildings are sealed tightly for energy efficiency, the air exchange rate (measured in air changes per hour, or ACH) drops, causing pollutant concentrations to rise. This relationship can be expressed using a steady-state concentration model.
STEADY-STATE INDOOR CONCENTRATION
Where C = pollutant concentration (mg/m³), E = emission rate (mg/hr), V = room volume (m³), and ACH = air changes per hour (hr⁻¹). This simplified model assumes the room is well-mixed and the outdoor concentration is negligible.
This equation reveals that indoor concentration is inversely proportional to both room volume and ventilation rate. Doubling the air exchange rate halves the steady-state concentration—a principle that explains why improving ventilation is one of the most effective strategies for reducing indoor pollution. For radon specifically, the EPA has established an action level of 4 picocuries per liter (pCi/L), above which mitigation (typically sub-slab depressurization) is recommended.
Health Effect Pathways
The health effects of indoor air pollutants vary from acute to chronic and are influenced by the duration, intensity, and route of exposure. Carbon monoxide produces acute effects—headache, dizziness, and in severe cases, death—by binding to hemoglobin and forming carboxyhemoglobin (COHb), which starves tissues of oxygen. Radon exposure operates on a chronic timescale: its alpha-emitting decay products (polonium-218 and polonium-214) lodge in lung tissue, irradiating cells and increasing lung cancer risk over years of exposure. Formaldehyde irritates mucous membranes at low concentrations and is classified as a known human carcinogen by the International Agency for Research on Cancer (IARC). Asbestos fibers are most dangerous when friable (crumbly); once inhaled, their needle-like structure penetrates alveolar tissue, causing asbestosis (scarring) or mesothelioma (a malignant tumor of the pleural lining) with a latency period of 20–50 years.
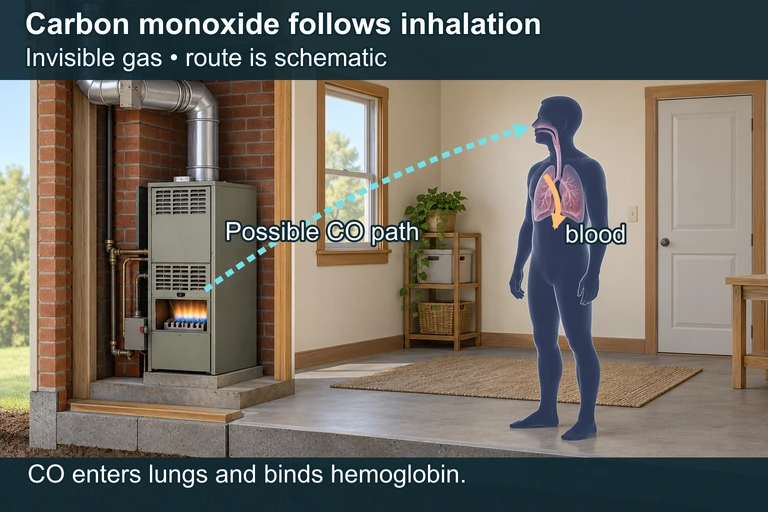 Invisible carbon monoxide can reach the breathing zone and interfere with oxygen transport after inhalation. The pathway is schematic and gives no clinical dose threshold.
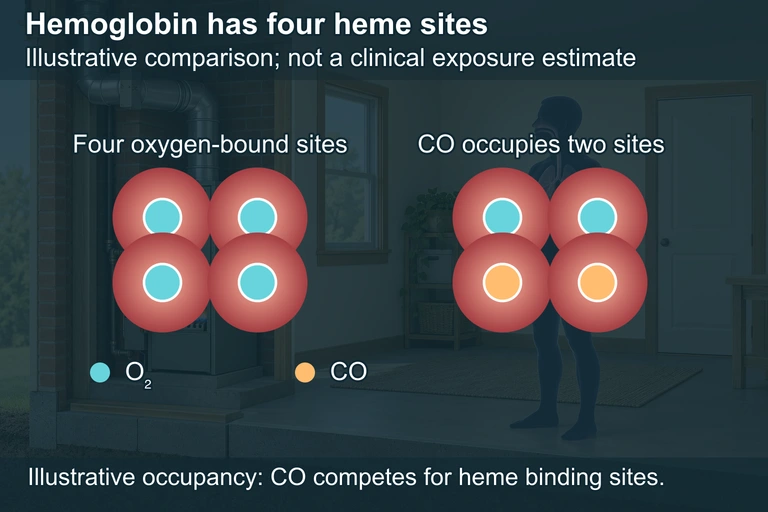 Schematic occupancy only: CO competes with oxygen and also impairs oxygen unloading. No clinical concentration or threshold is shown.
RADON DECAY
Radon-222 undergoes alpha decay to produce polonium-218. The short half-life means radon and its progeny build up quickly in poorly ventilated spaces, and remediation rapidly reduces concentrations once ventilation improves.
SECTION 5
Classification of Indoor Air Pollutants
For AP Environmental Science, it is essential to organize indoor pollutants into clear categories based on their origin, chemical nature, and health effects. The table below provides a comprehensive classification that integrates the pollutants discussed in previous sections and adds additional detail on developing-world concerns such as biomass combustion, which is responsible for millions of premature deaths annually according to the World Health Organization.
| Category | Key Pollutants | Primary Sources | Health Effects |
|---|---|---|---|
| Combustion Products | CO, NO2, PM2.5, SO2 | Gas stoves, fireplaces, wood stoves, tobacco smoke, kerosene heaters | Hypoxia (CO), respiratory irritation, COPD, lung cancer (ETS) |
| Volatile Organic Compounds | Formaldehyde (CH₂O), benzene, toluene, xylene | Pressed-wood products, paints, solvents, adhesives, new carpeting | Eye/throat irritation, headaches; formaldehyde and benzene are known carcinogens |
| Radioactive Gas | Radon-222 (²²²Rn) | Natural uranium decay in soil/bedrock; enters via foundation cracks | Lung cancer (alpha radiation damages bronchial epithelium) |
| Particulate / Fibrous | Asbestos fibers, lead dust | Insulation, pipe wrapping, pre-1978 paint, older plumbing | Asbestosis, mesothelioma; lead poisoning (neurological damage in children) |
| Biological Agents | Mold spores, dust mites, pet dander, bacteria, pollen | Damp environments, HVAC systems, pets, carpets | Asthma, allergic rhinitis, hypersensitivity pneumonitis |
Classification of major indoor air pollutants by category, source, and health effect
SECTION 6
Worked Example: Estimating Indoor Pollutant Concentration
The following example demonstrates how to apply the steady-state concentration model to estimate formaldehyde levels in a room, a type of calculation that could appear on the AP Environmental Science exam in a free-response question requiring quantitative analysis.
Worked example
- 1
Step 1 — Identify Given Values
A newly carpeted office has the following characteristics: room dimensions = 10 m × 8 m × 3 m, formaldehyde emission rate from carpet and pressed-wood furniture = 1.2 mg/hr, and air exchange rate (ACH) = 0.5 hr⁻¹. We need to find the steady-state formaldehyde concentration.E = 1.2 mg/hr, V = 240 m³, ACH = 0.5 hr⁻¹ - 2
Step 2 — Apply the Steady-State Model
Using the equation C = E / (V × ACH), we substitute the given values: C = 1.2 mg/hr ÷ (240 m³ × 0.5 hr⁻¹).C = 1.2 / 120 = 0.01 mg/m³ - 3
Step 3 — Convert Units and Interpret
The result is 0.01 mg/m³, which equals 10 µg/m³ or approximately 8 ppb (parts per billion) at standard conditions. The WHO guideline for indoor formaldehyde is 100 µg/m³ (0.1 mg/m³) as a 30-minute average. Our calculated value is well below this threshold.C = 10 µg/m³ — below the WHO guideline of 100 µg/m³ - 4
Step 4 — Explore a Scenario: Reduced Ventilation
Now suppose the ACH drops to 0.1 hr⁻¹ (a poorly ventilated building). Recalculating: C = 1.2 / (240 × 0.1) = 1.2 / 24 = 0.05 mg/m³ = 50 µg/m³. This is five times higher than before and approaches half the WHO guideline, illustrating how reduced ventilation dramatically increases pollutant concentrations.C at ACH = 0.1 → 50 µg/m³ (5× increase from reducing ventilation by 80%)
SECTION 7
Mitigation Strategies: Strengths & Limitations
Indoor air quality can be improved through three broad strategies: source control (eliminating or reducing the pollutant at its origin), ventilation improvement (increasing the rate at which outdoor air replaces indoor air), and air cleaning (using filtration or chemical processes to remove contaminants). The EPA considers source control the most effective and cost-efficient approach, but real-world solutions typically combine all three.
| Strategy | Strengths | Limitations |
|---|---|---|
| Source Control | Most cost-effective; eliminates pollutant entirely (e.g., banning indoor smoking, using low-VOC paint, asbestos encapsulation) | Not possible for all sources (radon from geology); may require expensive building material replacement |
| Ventilation | Dilutes all indoor pollutants simultaneously; reduces humidity and biological agent growth | Increases energy costs; may introduce outdoor pollutants (ozone, PM) in urban areas; less effective in extreme climates |
| Air Cleaning / Filtration | HEPA filters remove 99.97% of particles ≥ 0.3 µm; activated carbon adsorbs VOCs; radon sub-slab depressurization is highly effective | Ongoing maintenance costs; filters must be replaced regularly; not effective for all pollutant types (e.g., CO requires separate detectors) |
| Regulation & Education | Addresses systemic issues (asbestos bans, lead paint regulations, building codes requiring ventilation standards) | Enforcement varies; developing nations often lack infrastructure; existing buildings may be grandfathered under old codes |
Comparison of indoor air quality improvement strategies
SECTION 8
Indoor vs. Outdoor Air Pollution & Global Perspectives
Although indoor and outdoor air pollution are often treated as separate topics in environmental science, they are deeply interconnected. Outdoor pollutants (ozone, PM2.5, NO2) infiltrate buildings through ventilation systems and openings, while indoor emissions can escape outdoors. The AP exam may test your ability to compare regulatory frameworks, pollutant types, and geographic disparities between these two domains.
| Dimension | Indoor Air Pollution | Outdoor Air Pollution |
|---|---|---|
| Primary Regulation | No comprehensive federal law in the U.S.; EPA provides guidelines, not enforceable standards (except for radon action levels) | Clean Air Act (1970); NAAQS set enforceable limits for six criteria pollutants |
| Key Pollutants | Radon, CO, formaldehyde, asbestos, lead dust, ETS, mold, VOCs | O₃, PM₂.₅, PM₁₀, SO₂, NO₂, CO, Pb (criteria pollutants) |
| Global Burden | ~3.2 million deaths/yr (WHO, 2020), primarily in developing nations from biomass cookstove smoke | ~4.2 million deaths/yr (WHO, 2020), primarily in industrialized and rapidly urbanizing regions |
| Disproportionate Impact | Women and children in developing nations (biomass cooking); low-income urban residents in older housing (lead, asbestos) | Communities near highways, industrial zones, and power plants; environmental justice communities |
Comparison of indoor versus outdoor air pollution on key dimensions
SECTION 9
Practice Problems
Question 1: CONCEPTUAL
- A. Radon-222 — off-gassing from pressed-wood furniture
- B. Carbon monoxide — natural radioactive decay of uranium in bedrock
- C. Formaldehyde — pressed-wood products and adhesives
- D. Asbestos — incomplete combustion of natural gas in stoves
Show answer (C)
Question 2: BASIC CALCULATION
- A. 0.002 mg/m³
- B. 0.01 mg/m³
- C. 0.02 mg/m³
- D. 0.20 mg/m³
Show answer (C)
Question 3: INTERMEDIATE
- A. No action needed because radon is only harmful above 10 pCi/L
- B. Install a sub-slab depressurization system because the reading exceeds the EPA action level of 4 pCi/L
- C. Seal the basement with asbestos-containing insulation to block radon entry
- D. Increase indoor humidity above 60% to bind radon particles to water droplets
Show answer (B)
Question 4: APPLIED
4 ptsShow answer
Question 5: CRITICAL THINKING
4 pts