

SECTION 1
Historical Context & Motivation
The idea that atmospheric gases could trap heat near Earth's surface dates to the early nineteenth century, when scientists first recognized that certain molecules absorb and re-emit infrared radiation. The natural greenhouse effect keeps Earth's mean surface temperature approximately 33 °C warmer than it would otherwise be, making the planet habitable. However, since the Industrial Revolution, human activities—primarily the combustion of fossil fuels, deforestation, and industrial agriculture—have dramatically increased the atmospheric concentrations of key greenhouse gases, intensifying this natural process and driving global climate change.
1824 • Fourier's Greenhouse Concept
1896 • Arrhenius Quantifies CO₂ Warming
1958 • Keeling Curve Begins
1988 • IPCC Established
2024 • CO₂ Exceeds 425 ppm
These milestones frame the central question of modern environmental science: how have human activities altered the composition of the atmosphere, and what are the consequences of this alteration for Earth's climate system? Understanding the sources, magnitudes, and relative impacts of individual greenhouse gases is essential for both the AP exam and for evaluating policy responses to climate change.
SECTION 2
Core Principles & Definitions
To analyze increases in greenhouse gases rigorously, you need a firm grasp of several foundational concepts: the mechanism by which greenhouse gases trap heat, the distinction between natural and anthropogenic sources, the concept of radiative forcing, and the role of global warming potential (GWP) in comparing different gases.
Greenhouse Effect Mechanism
Radiative Forcing
Global Warming Potential (GWP)
Anthropogenic vs. Natural Sources
Carbon Sinks & Residence Time
SECTION 3
The Enhanced Greenhouse Effect
The diagram illustrates the critical distinction between the natural greenhouse effect and its anthropogenic enhancement. Under pre-industrial conditions, a balance existed between incoming solar energy and outgoing infrared radiation. As human activities release additional CO2, CH4, N2O, and synthetic fluorinated gases, more infrared radiation is intercepted before it can escape to space, producing a positive radiative forcing that warms the climate system.
SECTION 4
Quantifying Greenhouse Gas Impacts
Environmental scientists use several quantitative tools to compare and aggregate the warming effects of different greenhouse gases. The two most important for the AP exam are Global Warming Potential (GWP) and the conversion to CO₂ equivalents (CO₂e). These allow policy-makers and scientists to express the impact of a mixture of gases as a single number.
CO₂ EQUIVALENT EMISSIONS
CO₂e = mass in CO₂-equivalent units (metric tons); mass of gas = emitted mass of the specific greenhouse gas (metric tons); GWP100 = 100-year global warming potential relative to CO₂ (dimensionless).
RADIATIVE FORCING FROM CO₂
ΔF = change in radiative forcing; C = current atmospheric CO₂ concentration (ppm); C₀ = pre-industrial CO₂ concentration (~280 ppm). The logarithmic relationship means each doubling of CO₂ produces roughly the same additional forcing (~3.7 W/m²).
| Greenhouse Gas | Pre-Industrial (ppm/ppb) | Current Level (approx.) | GWP₁₀₀ | Primary Anthropogenic Source |
|---|---|---|---|---|
| CO₂ | 280 ppm | ~425 ppm | 1 | Fossil fuel combustion, deforestation |
| CH₄ | ~722 ppb | ~1925 ppb | 28 | Livestock, rice paddies, landfills, natural gas leaks |
| N₂O | ~270 ppb | ~336 ppb | 265 | Agricultural fertilizers, combustion, industrial processes |
| CFCs / HFCs | 0 (synthetic) | varies (ppt range) | 1,000–23,000 | Refrigerants, aerosols, industrial solvents |
Major greenhouse gases: pre-industrial vs. current concentrations and GWP values
SECTION 5
Sources, Sinks, and the Carbon Cycle
Greenhouse gas concentrations reflect a dynamic balance between sources (processes that release gases into the atmosphere) and sinks (processes that remove them). When anthropogenic sources exceed the capacity of natural sinks, concentrations rise. Approximately 50% of the CO₂ emitted by humans is absorbed by oceans and terrestrial ecosystems, but the remainder accumulates in the atmosphere. Understanding this imbalance is central to predicting future concentrations and designing mitigation strategies.
- Carbon sinks: Oceans absorb ~25% of annual CO₂ emissions (causing ocean acidification); terrestrial vegetation and soils absorb ~25%; the remaining ~50% accumulates in the atmosphere.
- Positive feedbacks: Warming thaws permafrost, releasing stored CH₄ and CO₂; reduced ice cover lowers albedo, increasing absorption of solar energy; warmer oceans hold less dissolved CO₂.
- Negative feedbacks: Increased CO₂ may stimulate plant growth (CO₂ fertilization effect), temporarily enhancing carbon uptake—though this effect has limits and may be offset by drought and heat stress.
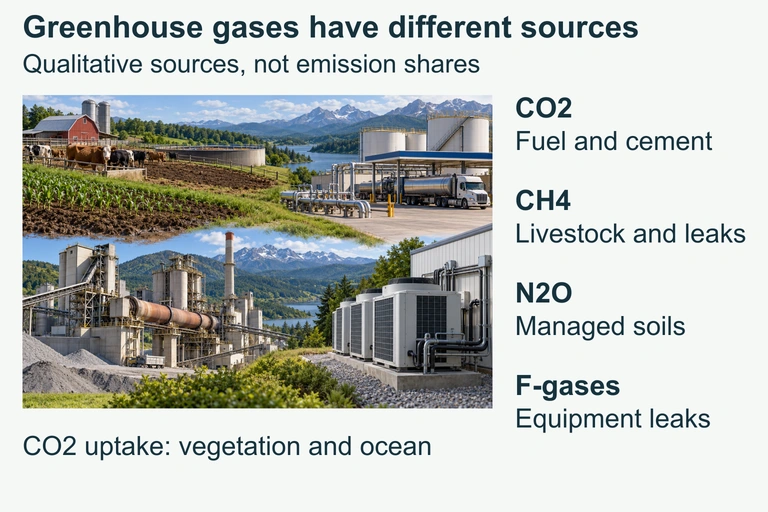 Different activities release different greenhouse gases through distinct processes. The window sizes show no quantitative emission shares.
SECTION 6
Worked Example: Calculating CO₂ Equivalents
A dairy farm emits 120 metric tons of CH₄ and 5 metric tons of N₂O per year from enteric fermentation and manure management. Calculate the farm's total annual greenhouse gas emissions in CO₂ equivalents using 100-year GWP values (CH₄ = 28; N₂O = 265).
Worked example
- 1
Step 1 — Identify Given Values
CH₄ emissions = 120 metric tons/year, GWPCH₄ = 28. N₂O emissions = 5 metric tons/year, GWPN₂O = 265. - 2
Step 2 — Convert CH₄ to CO₂e
CO₂e from CH₄ = 120 metric tons × 28 =3,360 metric tons CO₂e - 3
Step 3 — Convert N₂O to CO₂e
CO₂e from N₂O = 5 metric tons × 265 =1,325 metric tons CO₂e - 4
Step 4 — Sum Total CO₂e
Total CO₂e = 3,360 + 1,325 =4,685 metric tons CO₂e per year - 5
Step 5 — Interpret
Although the farm emits far less N₂O by mass, N₂O contributes roughly 28% of the total CO₂e (1,325 / 4,685 ≈ 0.28) because of its very high GWP. This demonstrates why per-molecule potency matters alongside total mass when assessing greenhouse gas impacts.
SECTION 7
Mitigation Strategies: Strengths & Limitations
Reducing greenhouse gas emissions requires a portfolio of strategies, each with distinct advantages and challenges. The AP exam frequently asks students to evaluate the trade-offs of mitigation approaches in the context of environmental, economic, and social factors.
| Strategy | Strengths | Limitations |
|---|---|---|
| Transition to renewables (solar, wind) | Zero direct emissions; declining costs; reduces air pollution co-benefits | Intermittency; land and material requirements; energy storage challenges |
| Carbon capture & storage (CCS) | Can retrofit existing fossil fuel plants; removes CO₂ at point source | High cost; energy penalty (~25% efficiency loss); long-term storage risks |
| Reforestation / afforestation | Enhances carbon sinks; supports biodiversity; low-tech | Slow carbon uptake; land competition with agriculture; fire/drought vulnerability |
| Methane reduction (livestock, landfills) | CH₄ has short residence time so benefits appear quickly; captures energy from biogas | Difficult to monitor diffuse sources; diet changes face cultural resistance |
| Cap-and-trade / carbon tax | Market-based; incentivizes innovation; revenue can fund green investment | Political opposition; carbon leakage to unregulated regions; equity concerns |
Comparison of major greenhouse gas mitigation strategies
SECTION 8
Climate Feedbacks & Future Projections
Understanding increases in greenhouse gases requires looking beyond current concentrations to the feedback mechanisms that can amplify or dampen warming. The interplay between emissions, feedbacks, and Earth's climate sensitivity determines how much warming we can expect under different emission pathways.
| Feedback | Type | Mechanism |
|---|---|---|
| Ice-albedo feedback | Positive | Warming melts reflective ice → darker surface absorbs more solar radiation → more warming |
| Water vapor feedback | Positive | Warmer air holds more water vapor (a potent GHG) → increased trapping of IR → more warming |
| Permafrost thaw | Positive | Warming thaws frozen organic matter → microbes decompose it, releasing CO₂ and CH₄ → more warming |
| Cloud feedback | Mixed / Uncertain | Low clouds reflect sunlight (cooling); high clouds trap IR (warming). Net effect depends on type and altitude. |
| Plant growth (CO₂ fertilization) | Negative (limited) | Elevated CO₂ may increase photosynthesis and carbon uptake, partially offsetting emissions—limited by nutrients, water, and heat stress. |
Key climate feedbacks relevant to greenhouse gas increases
For the AP exam, understand that climate feedbacks can create tipping points—thresholds beyond which changes become self-reinforcing and largely irreversible on human timescales. Examples include the collapse of the West Antarctic Ice Sheet and dieback of the Amazon rainforest. These concepts connect greenhouse gas increases to broader topics in global change, biodiversity loss, and environmental policy.
SECTION 9
Practice Problems
Question 1: CONCEPTUAL
- A. CO₂ absorbs a wider range of infrared wavelengths than any other greenhouse gas.
- B. CO₂ is emitted in much larger quantities and has a very long atmospheric residence time, so its cumulative radiative forcing exceeds that of other gases.
- C. CO₂ is the only greenhouse gas produced by fossil fuel combustion.
- D. CO₂ triggers positive feedbacks, while CH₄ and N₂O do not.
Show answer (B)
Question 2: BASIC CALCULATION
- A. 78 metric tons CO₂e
- B. 1,400 metric tons CO₂e
- C. 14,000 metric tons CO₂e
- D. 1.79 metric tons CO₂e
Show answer (B)
Question 3: INTERMEDIATE
- A. 1.1 W/m²
- B. 2.2 W/m²
- C. 3.7 W/m²
- D. 5.35 W/m²
Show answer (B)
Question 4: APPLIED
Show answer
Question 5: CRITICAL THINKING