

SECTION 1
Historical Context & Motivation
For most of human history, people lived in small agrarian settlements dispersed across the landscape. The rise of urbanization—the concentration of populations into dense, built-up areas—began to accelerate during the Industrial Revolution, when factories drew laborers from farms into cities. By 2008, the United Nations reported that more than half of the global population lived in urban areas for the first time, and projections suggest that figure will reach 68 percent by 2050. Understanding urbanization matters to environmental science because this demographic shift drives habitat conversion, alters biogeochemical cycles, increases energy demand, and amplifies both pollution and vulnerability to natural hazards.
1800 • Pre-Industrial Baseline
1900 • Industrial Expansion
1950 • Post-War Suburbanization
2008 • Urban Majority Milestone
2050 • Projected Urban Future
This historical trajectory raises a core question for AP Environmental Science: How does converting natural and agricultural land into impervious, energy-intensive urban environments alter the flow of water, nutrients, energy, and biodiversity across landscapes? The sections that follow address this question by examining the ecological, hydrological, atmospheric, and social dimensions of urbanization.
SECTION 2
Core Principles & Definitions
Several foundational concepts underpin the environmental analysis of urbanization. Together they explain why cities—despite occupying only about 3 percent of Earth's land surface—exert disproportionate influence on global environmental systems.
Impervious Surfaces
Urban Heat Island (UHI)
Urban Sprawl
Stormwater Runoff & Non-Point Source Pollution
Ecological Footprint
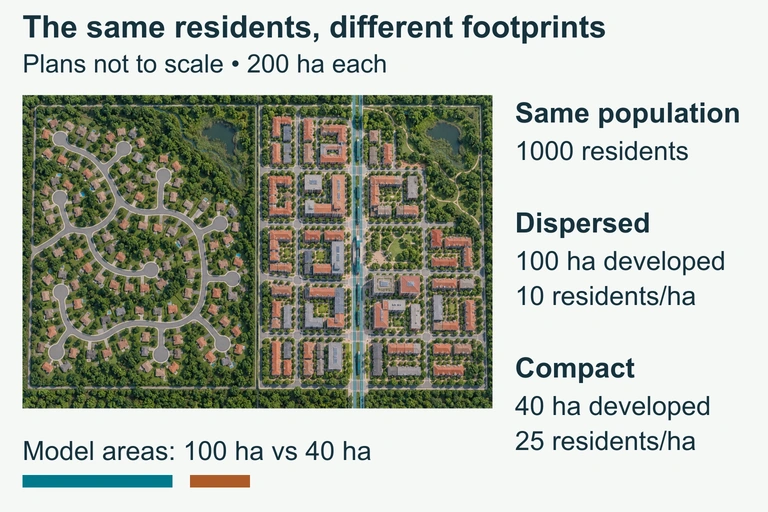 The same number of residents can occupy different developed footprints and travel networks. The hypothetical plan compares equal study areas without assigning universal travel emissions.
SECTION 3
Visual Explanation — Urban Water Cycle vs. Natural Water Cycle
In a natural watershed, roughly half of incoming precipitation infiltrates into the soil, recharging aquifers and sustaining baseflow in streams. Vegetation returns a significant fraction to the atmosphere through evapotranspiration, and only about 10 percent becomes surface runoff. Urbanization reverses this ratio: impervious cover can push runoff to 55 percent or higher while slashing infiltration to 15 percent. The consequences ripple through the system—lower water tables, higher peak discharge during storms, degraded stream channels, and elevated concentrations of urban pollutants such as petroleum hydrocarbons, heavy metals, and thermal pollution in receiving waters.
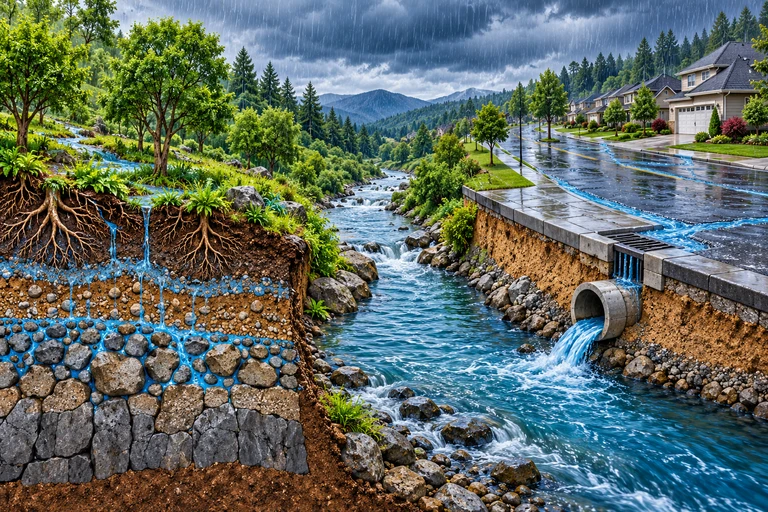 Impervious cover can change both runoff timing and volume. Storm conditions, soils and drainage control the response; infiltrated water may enter storage, evapotranspiration or later streamflow.
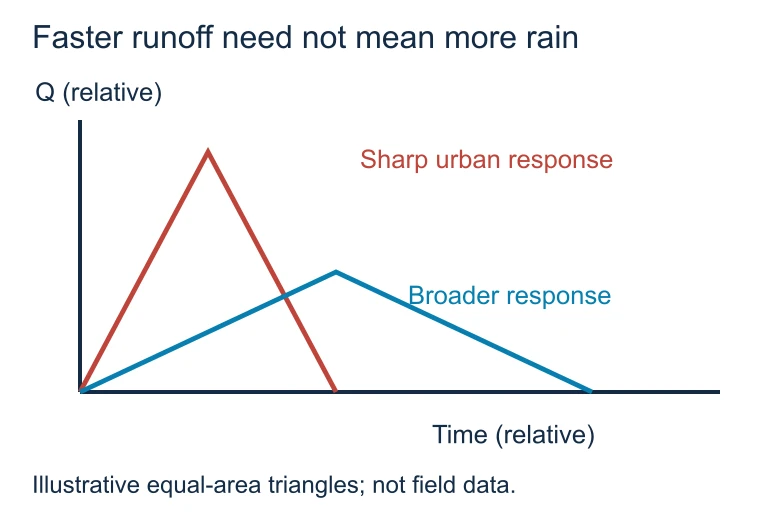 Impervious cover can change both runoff timing and volume. Storm conditions, soils and drainage control the response; infiltrated water may enter storage, evapotranspiration or later streamflow.
SECTION 4
How Urbanization Alters Environmental Systems
Hydrological Impacts
The conversion of permeable soil to impervious surface fundamentally restructures the local water budget. Engineers quantify this through the runoff coefficient (C), which represents the fraction of precipitation that becomes direct runoff. In the Rational Method—a standard tool for estimating peak discharge—peak runoff (Q) is computed as shown below.
RATIONAL METHOD
Q = peak discharge (ft³/s or m³/s); C = runoff coefficient (dimensionless, 0–1); i = rainfall intensity (in/hr or mm/hr); A = drainage area. As impervious cover increases, C rises, directly increasing Q for any given storm.
Atmospheric & Thermal Impacts
Urban surfaces—asphalt, concrete, dark rooftops—have low albedo (reflectivity) and high thermal mass, meaning they absorb solar radiation during the day and re-radiate it as heat at night. Combined with anthropogenic waste heat from vehicles, industry, and air conditioning, this produces the urban heat island effect. The UHI intensity (ΔT) can be approximated by comparing urban and rural temperature readings, and it is influenced by city size, building density, vegetation cover, and regional climate.
UHI INTENSITY
ΔT_UHI = urban heat island intensity (°C); T_urban = temperature measured in the city center; T_rural = temperature measured in surrounding rural area. Typical values range from 1–3 °C (annual average) to 5–12 °C on calm, clear summer nights.
Ecological & Biodiversity Impacts
Urbanization fragments habitats into isolated patches, reducing species diversity and disrupting migration corridors. Habitat fragmentation increases edge effects—altered microclimates, greater exposure to predators and invasive species—and reduces the effective area available to interior-dwelling species. The theory of island biogeography applies: smaller, more isolated habitat patches support fewer species. Meanwhile, cities tend to favor generalist, disturbance-tolerant species (pigeons, rats, coyotes) while displacing specialists, leading to biotic homogenization.
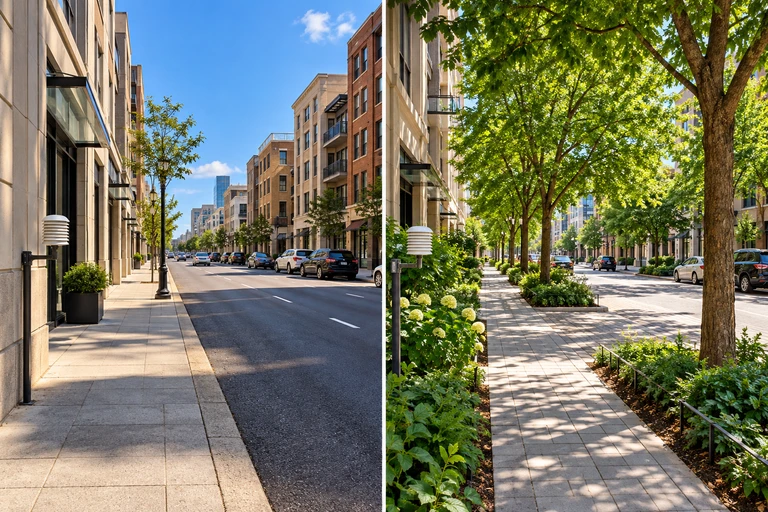 Dark paving can absorb and store solar energy, while vegetation provides shade and evapotranspiration when water is available. Air temperature, surface temperature and thermal comfort measure different aspects of heat exposure.
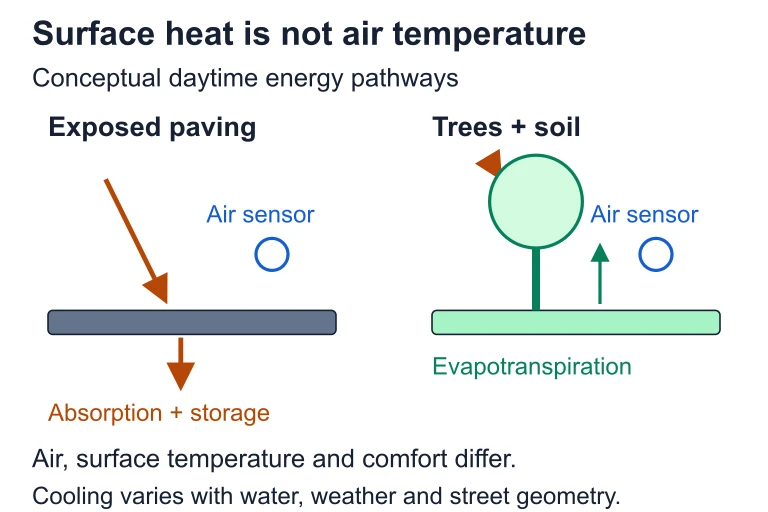 Dark paving can absorb and store solar energy, while vegetation provides shade and evapotranspiration when water is available. Air temperature, surface temperature and thermal comfort measure different aspects of heat exposure.
SECTION 5
Urban Sprawl vs. Smart Growth Strategies
| Characteristic | Urban Sprawl | Smart Growth |
|---|---|---|
| Density | Low; single-family homes | High; mixed-use, multi-story |
| Transportation | Car-dependent; highways | Transit, walking, cycling |
| Land conversion | High; continuous expansion | Minimal; urban growth boundaries |
| Impervious cover | 35–50% across large area | 20–30% with green infrastructure |
| Per-capita CO₂ emissions | Higher (longer commutes, larger homes) | Lower (shared walls, transit, walkability) |
| Habitat impact | Severe fragmentation | Concentrated footprint; preserves surrounding land |
Comparison of sprawl and smart growth development patterns
Smart growth strategies include transit-oriented development, which clusters housing and commercial uses around public transit hubs; urban growth boundaries (UGBs), which legally restrict development beyond a defined perimeter (as practiced in Portland, Oregon); and green infrastructure—bioswales, rain gardens, permeable pavement, and urban tree canopy—that mimics natural hydrological processes within the built environment. These approaches can simultaneously reduce stormwater runoff, lower UHI intensity, cut transportation emissions, and preserve habitat connectivity.
SECTION 6
Worked Example — Calculating Runoff Change from Urbanization
A 200-hectare watershed currently has 10% impervious cover (C = 0.3). A proposed development would increase impervious cover to 60% (C = 0.65). During a design storm with rainfall intensity i = 40 mm/hr, calculate the peak discharge before and after development and the percent increase in runoff.
Worked example
- 1
Step 1 — Convert area to compatible units
A = 200 ha = 2.0 × 10⁶ m². For the Rational Method in metric, Q (m³/s) = C × i × A ÷ 360, where i is in mm/hr and A is in hectares. - 2
Step 2 — Calculate pre-development peak discharge
Q_pre = (C_pre × i × A) ÷ 360 = (0.3 × 40 × 200) ÷ 360Q_pre ≈ 6.67 m³/s - 3
Step 3 — Calculate post-development peak discharge
Q_post = (C_post × i × A) ÷ 360 = (0.65 × 40 × 200) ÷ 360Q_post ≈ 14.44 m³/s - 4
Step 4 — Calculate percent increase
% increase = ((Q_post − Q_pre) ÷ Q_pre) × 100 = ((14.44 − 6.67) ÷ 6.67) × 100% increase ≈ 116.5% - 5
Step 5 — Interpret the result
Urbanizing this watershed more than doubles peak discharge, substantially increasing flood risk, stream channel erosion, and pollutant transport to downstream water bodies. This illustrates why stormwater management infrastructure—detention ponds, permeable pavement, bioswales—is essential in development planning.
SECTION 7
Mitigation Strategies — Strengths & Limitations
| Strategy | Strengths | Limitations |
|---|---|---|
| Green roofs | Reduce UHI, absorb stormwater, insulate buildings, extend roof lifespan | High upfront cost, structural load requirements, maintenance needed |
| Permeable pavement | Allows infiltration, reduces runoff, recharges groundwater | Clogs without maintenance; not suitable for high-traffic roads |
| Urban tree canopy | Shading reduces UHI 2–8 °C locally; sequesters CO₂; intercepts rainfall | Years to mature; requires space, water, and maintenance; can conflict with underground utilities |
| Transit-oriented development | Reduces per-capita emissions, limits sprawl, supports mixed-use walkability | Requires large infrastructure investment; may raise property values and displace low-income residents (gentrification) |
| Urban growth boundaries | Preserves surrounding farmland and habitat; encourages infill development | Can inflate land prices inside boundary; politically difficult to maintain as population grows |
Mitigation strategies for urbanization impacts
SECTION 8
Connections to Broader Environmental Science
Urbanization intersects with nearly every major topic in AP Environmental Science, from climate change and energy to biodiversity and human health. The following table highlights how urbanization concepts connect to other units you will encounter on the exam.
| APES Topic Area | Connection to Urbanization |
|---|---|
| Energy Resources & Consumption | Cities account for ~75% of global energy use and CO₂ emissions. Building efficiency, mass transit, and district heating reduce per-capita demand. |
| Global Climate Change | UHI amplifies heat stress; urban CO₂ and black carbon contribute to radiative forcing. Cities are also disproportionately vulnerable to sea-level rise and extreme weather. |
| Biodiversity & Ecosystem Services | Habitat fragmentation and biotic homogenization reduce biodiversity. Urban parks and wildlife corridors are critical for maintaining connectivity. |
| Water Pollution & Treatment | Stormwater runoff carries non-point source pollutants; combined sewer overflows release untreated sewage during heavy rain events. |
| Human Health & Environmental Justice | UHI disproportionately harms low-income communities lacking green space and air conditioning. Urban air pollution (PM₂.₅, ozone) causes respiratory and cardiovascular disease. |
As global urbanization accelerates, especially in Africa and South Asia, the choices made about urban form, energy infrastructure, and green space in the next few decades will significantly shape cumulative greenhouse gas trajectories, water resource availability, and species conservation outcomes worldwide. The AP exam frequently tests your ability to trace these cross-topic linkages, so practice identifying how urbanization impacts cascade through environmental systems.
SECTION 9
Practice Problems
Question 1: CONCEPTUAL
- A. Urban areas receive more total precipitation than surrounding rural areas due to the urban heat island effect.
- B. Impervious surfaces reduce infiltration and increase the volume and speed of stormwater runoff reaching streams.
- C. Urban vegetation absorbs less water than rural vegetation because it is exposed to higher levels of air pollution.
- D. Urban groundwater pumping raises the water table, causing streams to overflow more easily.
Show answer (B)
Question 2: BASIC CALCULATION
- A. 0.52 m³/s
- B. 1.04 m³/s
- C. 3.75 m³/s
- D. 10.42 m³/s
Show answer (B)
Question 3: INTERMEDIATE
- A. 31.2 °C
- B. 32.0 °C
- C. 32.4 °C
- D. 33.2 °C
Show answer (C)
Question 4: APPLIED
Show answer
Question 5: CRITICAL THINKING