

SECTION 1
Historical Context & Motivation
For most of human history, the oceans seemed inexhaustible. Coastal communities harvested fish for millennia without appreciably reducing stocks, largely because pre-industrial gear—hook-and-line, small nets, hand-thrown harpoons—could not extract biomass faster than populations reproduced. The advent of industrial fishing in the mid-twentieth century changed this equation entirely. Steam- and diesel-powered trawlers, sonar fish-finders, monofilament nylon nets, and onboard refrigeration allowed fleets to harvest fish at rates that overwhelmed the reproductive capacity of target species. By the late twentieth century, evidence mounted that many of the world's most productive fisheries were in steep decline, prompting ecologists and policymakers to investigate the cascading consequences of overfishing—the extraction of aquatic organisms at rates exceeding their ability to replenish.
1950s • Post-War Industrial Expansion
1992 • Northwest Atlantic Cod Collapse
2003 • Myers & Worm Study
2006 • Worm et al. Biodiversity–Productivity Link
2015–Present • SDG 14 & Global Reforms
These episodes raise a central question in environmental science: what happens—ecologically, economically, and socially—when harvest rates exceed the maximum sustainable yield (MSY) of a fishery? Understanding the impacts of overfishing requires integrating population ecology, trophic dynamics, economics, and policy analysis—skills that are essential for the AP Environmental Science exam.
SECTION 2
Core Principles & Definitions
Before analyzing impacts, it is important to establish the ecological and management concepts that frame the overfishing problem. The following foundational ideas connect population biology to fisheries science and recur throughout the AP exam.
Maximum Sustainable Yield (MSY)
Bycatch
Trophic Cascade
Fishery Collapse
Tragedy of the Commons
SECTION 3
Visual Explanation — Logistic Growth & Overharvest
The diagram above captures the central tension in fisheries management. When a population sits near K/2, the number of new individuals added per unit time (recruitment) is maximized because there are enough adults to reproduce but sufficient resources to support offspring survival. Harvesting at or below this recruitment rate constitutes sustainable fishing. When fleets extract biomass faster than the stock can replace it, however, population size drops below K/2. Per-capita growth may still be positive, but the total number of recruits is now smaller because fewer adults remain to spawn. If harvest pressure continues unabated, the population enters a downward spiral—known as recruitment overfishing—that can lead to commercial extinction, where the stock is too depleted to support any economically viable catch.
SECTION 4
Mathematical Framework — Logistic Growth & MSY
The quantitative foundation of fisheries ecology rests on the logistic growth model and the concept of maximum sustainable yield derived from it. While the AP exam does not require calculus-based derivations, you should understand how to apply these equations and interpret the parameters.
LOGISTIC GROWTH EQUATION
N = population size; r = intrinsic rate of increase; K = carrying capacity; dN/dt = change in population per unit time.
At low N, the term (1 − N/K) is close to 1, so growth approximates exponential. As N approaches K, the term shrinks toward zero and growth slows. The population growth rate dN/dt is maximized when N = K/2, which yields the MSY.
MAXIMUM SUSTAINABLE YIELD
This is derived by substituting N = K/2 into the logistic equation. It represents the maximum number of individuals that can be harvested per unit time without depleting the stock.
POPULATION WITH HARVEST
H = harvest rate (individuals removed per unit time). When H > MSY, the population will decline over time. When H ≤ MSY and N ≈ K/2, the stock can sustain itself.
SECTION 5
Ecological Impacts of Overfishing
The consequences of overfishing extend far beyond the decline of individual species. Removing large quantities of biomass—especially from upper trophic levels—reshapes community structure, disrupts nutrient cycling, and can push marine ecosystems past tipping points from which recovery is exceedingly slow.
Key Ecological Consequences
Trophic cascades are among the most dramatic ecological consequences of overfishing. When apex predators such as sharks, tuna, or grouper are removed, their prey (mesopredators like small fish and rays) proliferate. These expanding mesopredator populations then overconsume herbivorous species such as parrotfish and sea urchins, leading to unchecked algal growth on coral reefs—a process known as a phase shift from coral-dominated to algae-dominated reefs.
Loss of biodiversity is another critical outcome. Bycatch from industrial trawling and longlining kills millions of non-target organisms annually, including endangered sea turtles, seabirds, and marine mammals. Bottom trawling physically destroys benthic habitats—coral, sponges, and sea-floor sediment structures—that serve as nursery grounds for many species.
Fishing down the food web describes the progressive shift in commercial catches from high-trophic-level predators to lower-trophic-level species (e.g., from cod and swordfish to sardines and jellyfish). This trend, documented by Daniel Pauly using the mean trophic level of global catches, signals the systematic depletion of upper trophic levels and a simplification of marine food webs.
Genetic and evolutionary effects can emerge when fishing selectively removes the largest and oldest individuals from a population. This artificial selection pressure can drive populations toward earlier sexual maturation, smaller body size, and lower fecundity—changes that reduce the stock's long-term productivity and resilience.
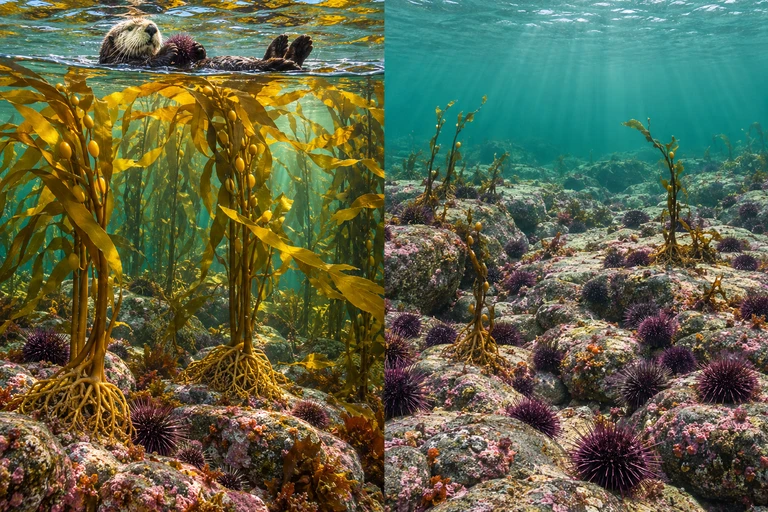 In this kelp–urchin–otter food web, otter feeding can limit urchin grazing and indirectly favor kelp. Other environmental conditions and interactions also influence kelp-forest outcomes.
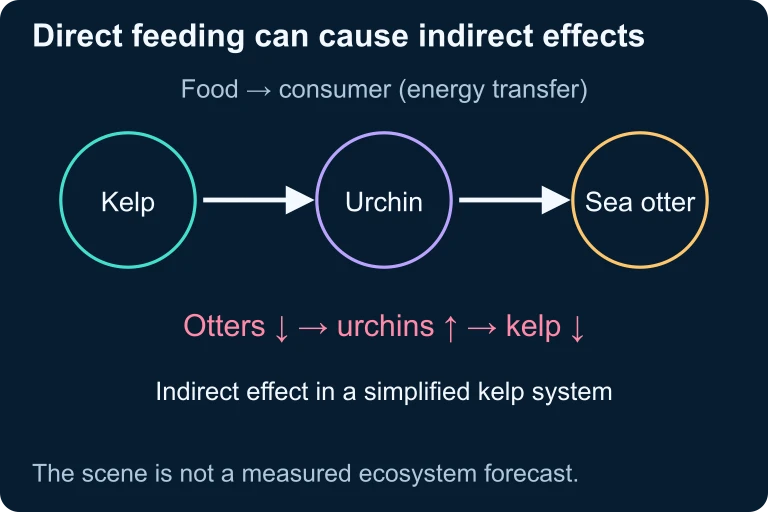 In this kelp–urchin–otter food web, otter feeding can limit urchin grazing and indirectly favor kelp. Other environmental conditions and interactions also influence kelp-forest outcomes.
SECTION 6
Worked Example — Calculating MSY & Evaluating Sustainability
Worked example
- 1
Step 1 — Identify Given Values
A population of Atlantic bluefin tuna has a carrying capacity of K = 800,000 individuals and an intrinsic growth rate of r = 0.10 per year. Current annual harvest is H = 25,000 fish. - 2
Step 2 — Calculate Maximum Sustainable Yield
Apply the MSY formula: MSY = (r × K) / 4 = (0.10 × 800,000) / 4 = 80,000 / 4MSY = 20,000 individuals per year - 3
Step 3 — Compare Harvest to MSY
The current harvest (H = 25,000) exceeds the MSY (20,000) by 5,000 individuals per year. This means more fish are being removed than the population can replace.H > MSY → This fishery is being overfished. - 4
Step 4 — Determine Sustainable Reduction
To achieve sustainability, the harvest must be reduced by at least 25,000 − 20,000 = 5,000 individuals per year. A precautionary approach would set H below MSY to allow the stock to rebuild toward K/2 = 400,000 individuals.Minimum reduction: 5,000 fewer fish per year
SECTION 7
Mitigation Strategies — Strengths & Limitations
A range of policy and management tools have been developed to combat overfishing. Each strategy addresses different aspects of the problem—biological, economic, or governance-related—but none is a silver bullet. Understanding the trade-offs among approaches is essential for the AP exam's 'Propose a Solution' FRQ.
| Strategy | Strengths | Limitations |
|---|---|---|
| Catch quotas / TAC | Directly limits harvest to MSY; science-based when enforced. | Difficult to enforce on the open ocean; may encourage illegal, unreported, and unregulated (IUU) fishing. |
| Marine Protected Areas (MPAs) | Provide refugia for spawning; protect habitat; allow spillover of adults into fished zones. | May displace fishing effort to adjacent areas; require monitoring; effectiveness depends on size and enforcement. |
| Individual Transferable Quotas (ITQs) | Market-based incentive aligns fisher self-interest with conservation; reduces race-to-fish behavior. | Can concentrate quota ownership among wealthy operations; initial allocation may be inequitable. |
| Gear restrictions / TEDs / BRDs | Turtle excluder devices and bycatch reduction devices significantly reduce non-target mortality. | May reduce short-term catch efficiency; compliance varies; does not directly limit total harvest. |
| Aquaculture | Reduces pressure on wild stocks; can be highly efficient for herbivorous species. | Carnivorous fish farms require wild-caught fishmeal; risk of disease, genetic pollution, and nutrient loading. |
| Consumer certification (MSC label) | Market-driven incentive; educates consumers; rewards sustainable fisheries financially. | Limited reach in developing nations; certification costs can exclude small-scale fishers. |
Comparison of major overfishing mitigation strategies
 A size-selective grid can guide a large animal toward an escape opening while smaller target catch passes toward the codend. Performance depends on species, gear and operating conditions.
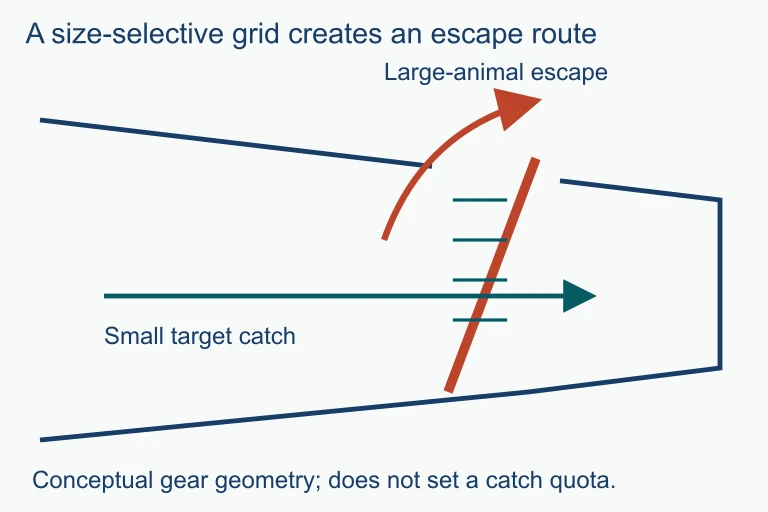 A size-selective grid can guide a large animal toward an escape opening while smaller target catch passes toward the codend. Performance depends on species, gear and operating conditions.
SECTION 8
Connections to Global Issues & Advanced Topics
Overfishing does not occur in isolation. It intersects with climate change, ocean acidification, pollution, and global food security in ways that amplify overall ecological degradation. Understanding these connections positions you to tackle multi-factor AP FRQs and to see overfishing within the broader framework of environmental sustainability.
| Connection | How It Interacts with Overfishing |
|---|---|
| Climate Change | Warming oceans shift species ranges poleward, disrupt spawning timing, and reduce dissolved oxygen—compounding stress on already depleted stocks. |
| Ocean Acidification | Increased CO₂ absorption lowers pH, threatening shell-forming organisms (mollusks, corals) that serve as habitat and food sources for commercial species. |
| Nutrient Pollution (Eutrophication) | Agricultural runoff creates hypoxic dead zones that shrink available habitat, concentrating fish and making them more vulnerable to overexploitation. |
| Global Food Security | Over 3 billion people depend on fish for at least 20% of animal protein. Stock collapse disproportionately harms developing nations with limited alternative protein sources. |
| Tragedy of the Commons & International Law | High-seas fisheries beyond national jurisdictions (EEZs) remain poorly regulated, illustrating the governance challenge of managing shared resources without enforceable property rights. |
Overfishing and its connections to broader environmental issues
Looking ahead, advanced fisheries science increasingly employs ecosystem-based fisheries management (EBFM), which considers multi-species interactions, habitat health, and climate projections rather than managing single species in isolation. EBFM represents a shift from the reductionist MSY approach toward a more holistic understanding of marine systems—a perspective that aligns with the integrated thinking the AP exam rewards.
SECTION 9
Practice Problems
Question 1: CONCEPTUAL
- A. Removal of apex predators leads to a decrease in mesopredator populations, which increases herbivore populations and reduces primary producer biomass.
- B. Removal of apex predators leads to an increase in mesopredator populations, which decreases herbivore populations and increases primary producer biomass.
- C. Removal of apex predators leads to an increase in herbivore populations, which overgrazes primary producers and causes algal blooms.
- D. Removal of apex predators causes primary producers to decline, which reduces herbivore populations through bottom-up control.
Show answer (B)
Question 2: BASIC CALCULATION
- A. 5,000 fish per year
- B. 10,000 fish per year
- C. 20,000 fish per year
- D. 40,000 fish per year
Show answer (B)
Question 3: INTERMEDIATE
- A. Bioaccumulation of persistent organic pollutants in upper trophic levels
- B. Fishing down the food web due to depletion of higher trophic level species
- C. Eutrophication increasing the productivity of primary producers
- D. Successful implementation of marine protected areas restoring herbivore populations
Show answer (B)
Question 4: APPLIED
Show answer
Question 5: CRITICAL THINKING