

SECTION 1
Historical Context & Motivation
Humans have captured the kinetic energy of flowing water for millennia, from ancient grain mills along the Nile to medieval waterwheels powering European forges. The modern era of hydroelectric power began in the late nineteenth century when engineers coupled water turbines with electric generators, converting the gravitational potential energy of elevated water into a reliable and scalable source of electricity. As industrialization accelerated demand for power, governments invested in massive dam projects that reshaped rivers and entire watersheds. Today, hydroelectric generation accounts for roughly 15–16 % of global electricity production and remains the single largest source of renewable energy worldwide, supplying over 4,300 TWh per year.
1882 • First Hydroelectric Plant
1936 • Hoover Dam Completed
1984 • Itaipú Dam Operational
2006 • Three Gorges Dam Completed
2020s • Pumped-Storage Renaissance
The history of hydropower raises a core question in environmental science: Can we exploit the energy of the hydrological cycle to meet growing electricity demand without inflicting unacceptable ecological, social, and geomorphic costs? The sections that follow unpack the physics, environmental trade-offs, and policy implications you need to master for the AP Environmental Science exam.
SECTION 2
Core Principles & Definitions
At its most fundamental level, hydroelectric generation converts the gravitational potential energy of water stored at elevation into kinetic energy as it flows downhill, and then into electrical energy via a turbine-generator set. The amount of energy available depends on two variables: the hydraulic head (the vertical distance water falls) and the flow rate (the volume of water passing per unit time). Greater head and greater discharge both translate into higher power output. The overall efficiency of modern hydro turbines typically ranges from 85–95 %, making hydropower the most efficient large-scale electricity generation technology available.
Hydraulic Head (h)
Flow Rate (Q)
Turbine-Generator Efficiency (η)
Impoundment vs. Run-of-River
Pumped-Storage Hydroelectricity
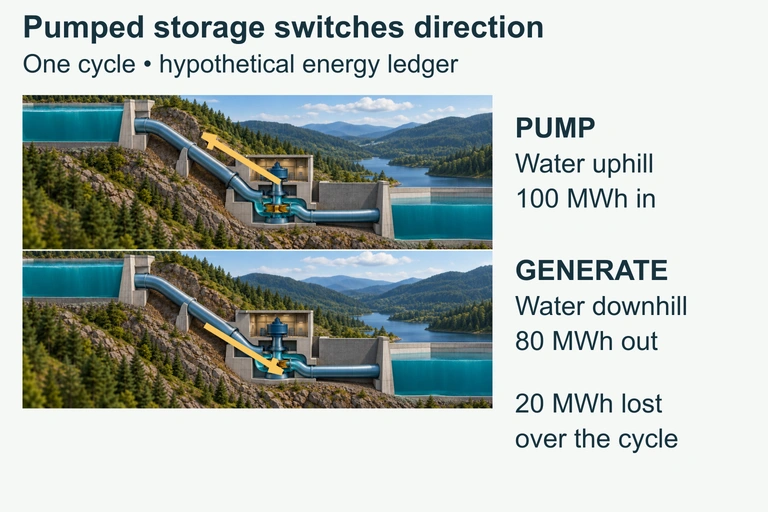 Pumped storage consumes electricity while moving water uphill and returns part of that energy during downhill generation. The hypothetical cycle returns 80 MWh from 100 MWh of input.
KEY TAKEAWAY
SECTION 3
Visual Explanation — Inside a Hydroelectric Dam
The diagram above illustrates the energy conversion chain that defines every conventional hydroelectric facility. Gravitational potential energy in the reservoir is first converted to kinetic energy as water accelerates down the penstock, then to rotational mechanical energy as the high-pressure jet or flow spins the turbine runner, and finally to electrical energy in the coupled generator. Efficiency losses occur at each stage—primarily from friction in the penstock, turbulence at the turbine blades, and resistive heating in the generator windings—but because there is no thermodynamic combustion step, hydropower bypasses the Carnot efficiency limit that constrains fossil-fuel and nuclear plants. This fundamental advantage explains why modern hydro turbines routinely achieve overall efficiencies above 90 %, compared with 33–45 % for thermal power plants.
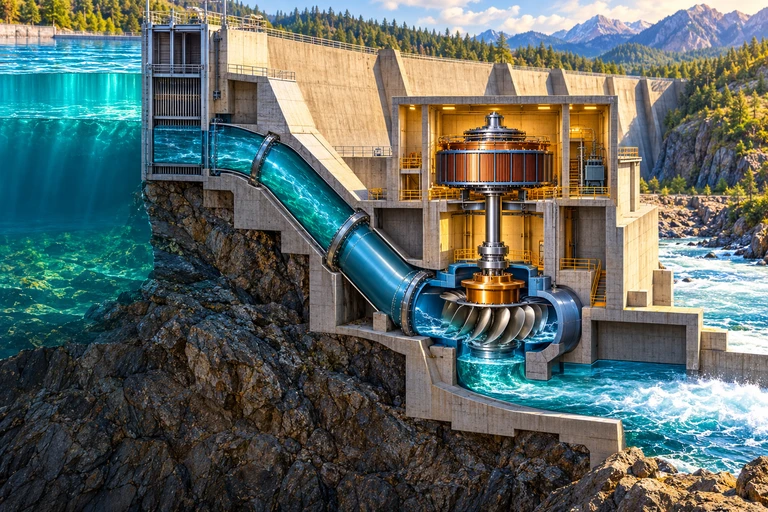 At 80 m of net head, a flow of 25 m³/s produces 17.64 MW with 90% conversion efficiency. Annual energy additionally depends on how long the plant operates and its capacity factor.
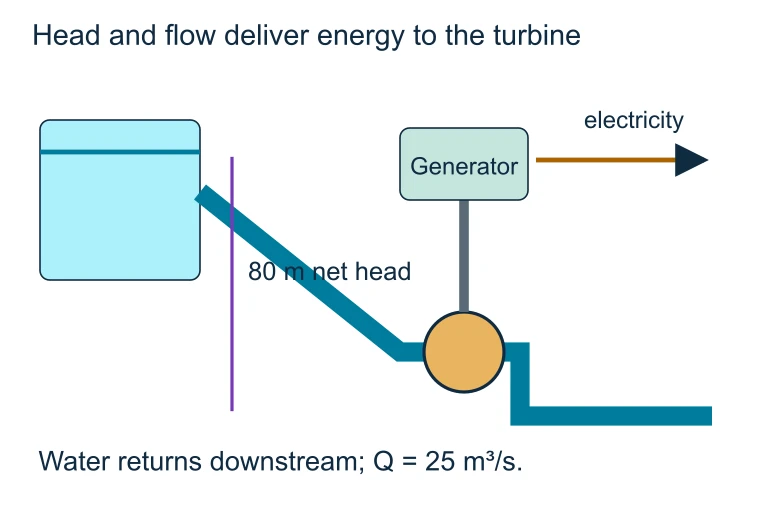 At 80 m of net head, a flow of 25 m³/s produces 17.64 MW with 90% conversion efficiency. Annual energy additionally depends on how long the plant operates and its capacity factor.
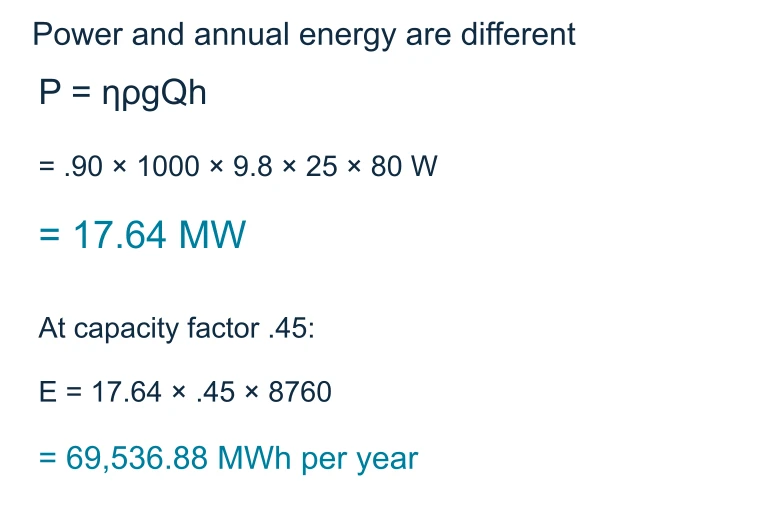 Hydraulic power depends on water density, gravity, discharge and net head. With 25 m³/s, 80 m net head and 90% efficiency, electrical output is 17.64 MW.
SECTION 4
Mathematical Framework
The power output of a hydroelectric facility can be derived from first principles. Consider a mass m of water falling through a vertical height h. The gravitational potential energy released is E = mgh. Expressing mass in terms of density (ρ) and volumetric flow rate (Q = volume/time), and factoring in the turbine-generator efficiency η, we arrive at the core hydropower equation.
HYDROELECTRIC POWER OUTPUT
where P = power output (watts, W); ρ = density of water (≈ 1,000 kg/m³); g = gravitational acceleration (9.8 m/s²); h = hydraulic head (m); Q = volumetric flow rate (m³/s); η = overall efficiency (dimensionless, 0–1).
GRAVITATIONAL POTENTIAL ENERGY
This is the foundational energy equation: E (joules) equals the mass of water (kg) times gravitational acceleration (9.8 m/s²) times the vertical drop (m). Power is simply the rate at which this energy is converted: P = E/t.
ANNUAL ENERGY GENERATION
where Eannual = energy produced per year (Wh); P = rated (nameplate) capacity (W); CF = capacity factor (typically 0.30–0.60 for hydro, depending on water availability); and 8,760 h = hours in a standard year.
AP Exam Tip
SECTION 5
Types of Hydroelectric Systems & Environmental Impacts
Hydroelectric installations vary widely in scale and design, and each type presents a distinct set of environmental trade-offs. The AP Environmental Science exam expects you to distinguish among impoundment dams, run-of-river systems, and pumped-storage facilities, and to articulate both the ecological benefits and costs of each.
A recurring theme on the AP exam is the ecological impact of large impoundment dams. When a river is dammed, its natural sediment transport regime is disrupted: sediment that would normally replenish downstream floodplains and deltas settles behind the dam, starving coastal zones of nutrients and accelerating erosion. The reservoir itself can become a source of methane (CH4) when submerged vegetation decomposes anaerobically, particularly in tropical regions—a finding that complicates the notion that hydropower is entirely "carbon-free." Dams also block upstream migration of anadromous fish species such as salmon, fragmenting aquatic habitats and reducing biodiversity. Fish ladders and bypass channels offer partial mitigation, but their effectiveness varies by species and site. Finally, the flooding of the reservoir footprint can displace human communities and inundate culturally significant lands, an environmental justice concern that merits careful attention.
 A reservoir can trap sediment while a dam interrupts fish migration. A fish bypass addresses connectivity for particular species and conditions; it does not restore sediment continuity.
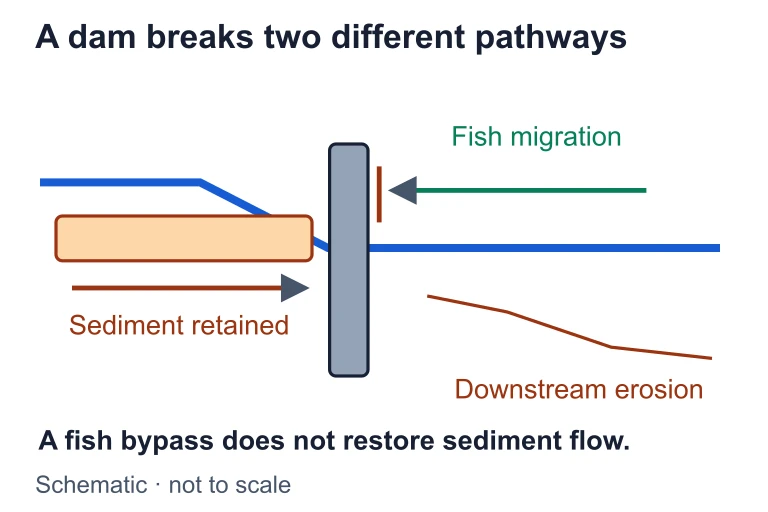 A reservoir can trap sediment while a dam interrupts fish migration. A fish bypass addresses connectivity for particular species and conditions; it does not restore sediment continuity.
SECTION 6
Worked Example
Calculating Hydroelectric Power Output and Annual Energy
- 1
Step 1 — Identify Given Values
A proposed dam has a hydraulic head of h = 80 m and a flow rate of Q = 25 m³/s. The turbine-generator efficiency is η = 0.90. The density of water is ρ = 1,000 kg/m³ and g = 9.8 m/s². The dam's capacity factor is 0.45. - 2
Step 2 — Apply the Hydropower Equation
P = ρ × g × h × Q × η = 1,000 × 9.8 × 80 × 25 × 0.90 - 3
Step 3 — Compute Intermediate Product
First, ρ × g = 1,000 × 9.8 = 9,800 N/m³. Then 9,800 × 80 = 784,000 N/m². Multiply by Q: 784,000 × 25 = 19,600,000 W. Finally, apply efficiency: 19,600,000 × 0.90 = 17,640,000 W.P = 17,640,000 W = 17.64 MW - 4
Step 4 — Calculate Annual Energy Generation
Eannual = P × CF × 8,760 h = 17.64 MW × 0.45 × 8,760 h = 17.64 × 3,942 = 69,537 MWh ≈ 69,500 MWh/year.E ≈ 69,500 MWh per year (69.5 GWh/yr) - 5
Step 5 — Interpret the Result
At an average U.S. household consumption of roughly 10,500 kWh per year, this facility could supply approximately 69,500,000 kWh ÷ 10,500 kWh/household ≈ 6,619 households. Note that the capacity factor of 0.45 accounts for seasonal variation in river flow and scheduled maintenance; the dam does not operate at full nameplate capacity year-round.≈ 6,600 households served
SECTION 7
Strengths, Limitations & Comparisons
| Criterion | Strengths | Limitations |
|---|---|---|
| Carbon Emissions | No direct combustion CO₂; lifecycle emissions are 4–14 g CO₂-eq/kWh for temperate reservoirs | Tropical reservoirs can emit significant CH₄ from decomposing flooded biomass, sometimes approaching natural gas plant levels |
| Reliability & Dispatchability | Impoundment dams are fully dispatchable; output can ramp up in seconds to meet peak demand | Drought, climate change, and upstream water diversion can reduce reservoir levels and power output for months or years |
| Efficiency | 85–95 % turbine efficiency—highest of any large-scale electricity technology | Pumped-storage round-trip efficiency is lower at 70–85 %, meaning energy is lost with each cycle |
| Ecological Impact | Reservoirs can provide recreational areas, fisheries, and stabilized downstream flows | Habitat fragmentation, blocked fish migration, altered thermal and sediment regimes, riparian ecosystem loss |
| Social / Economic | Dams provide flood control, irrigation, and cheap baseload electricity; infrastructure lasts 50–100+ years | Community displacement, loss of culturally significant sites, high upfront capital cost, dam failure risk |
Comprehensive comparison of hydroelectric power strengths and limitations
KEY TAKEAWAY
SECTION 8
Connections to Broader Energy & Environmental Topics
Hydroelectric power does not exist in isolation on the AP Environmental Science exam; it connects to multiple units, including global climate change, biodiversity, water resources, and energy policy. Understanding these linkages strengthens your ability to craft integrative free-response answers.
| APES Topic Connection | Key Linkage to Hydropower |
|---|---|
| Global Climate Change | Hydropower displaces fossil-fuel generation, reducing CO₂ emissions; however, changing precipitation patterns under climate change alter river flows and dam reliability. Tropical reservoir CH₄ must be included in lifecycle analyses. |
| Biodiversity & Ecosystems | Dams fragment river corridors, block anadromous fish migration (salmon, shad), and alter thermal and hydrological regimes. Dam removal is an emerging restoration strategy (e.g., Elwha River, WA). |
| Freshwater Resources | Reservoirs serve dual purposes—power generation and water supply—but evaporation from large surface areas reduces net water availability, a critical concern in arid regions (e.g., Lake Mead, Colorado River). |
| Environmental Policy & Economics | Dam relicensing under FERC, environmental impact assessments, cost-benefit analysis of dam removal vs. retrofit, and subsidies for renewable portfolio standards all intersect with hydropower decision-making. |
| Other Renewables (Solar, Wind) | Pumped-storage hydropower is the dominant form of grid-scale energy storage, enabling integration of intermittent solar and wind. Hybrid hydro-solar projects are expanding in mountainous regions. |
How hydroelectric power connects to other AP Environmental Science topics
Looking forward, the global hydropower landscape is shifting. Many prime dam sites in North America and Europe are already developed, limiting growth potential, while large new projects in South America, Africa, and Southeast Asia raise significant environmental justice and biodiversity concerns. At the same time, the expansion of variable renewable generation from solar and wind is driving a renaissance in pumped-storage hydroelectricity, positioning hydropower less as a primary energy source and more as a critical storage and grid-balancing technology for the energy transition. Dam removal is simultaneously gaining traction as a river restoration strategy, reflecting a broader societal re-evaluation of the true costs and benefits of impoundment.
SECTION 9
Practice Problems
Question 1: CONCEPTUAL
- A. Tropical dams use less efficient turbine designs due to higher water temperatures.
- B. Decomposition of flooded organic matter in warm tropical reservoirs produces significant methane emissions.
- C. Tropical rivers have lower hydraulic heads, requiring more concrete and producing higher embodied-carbon emissions.
- D. Higher evaporation rates in the tropics require supplemental fossil-fuel-powered pumping to maintain reservoir levels.
Show answer (B)
Question 2: BASIC CALCULATION
- A. 0.49 MW
- B. 0.83 MW
- C. 0.98 MW
- D. 8.30 MW
Show answer (B)
Question 3: INTERMEDIATE
- A. 4 times
- B. 5 times
- C. 7 times
- D. 10 times
Show answer (C)
Question 4: APPLIED
4 ptsShow answer
Question 5: CRITICAL THINKING
4 ptsShow answer
SUMMARY
Lesson Summary
Summary
Hydroelectric power converts the gravitational potential energy of elevated water into electricity via turbine-generator sets. Its output is governed by the equation P = ρghQη, where the two most influential variables are hydraulic head and flow rate. Three primary system types exist: impoundment dams (large reservoirs, dispatchable power), run-of-river systems (minimal storage, variable output), and pumped-storage facilities (grid-scale energy storage).
Hydropower offers exceptional turbine efficiency (85–95 %) and low lifecycle carbon emissions in temperate regions, but carries significant ecological costs including habitat fragmentation, blocked fish migration, sediment trapping, reservoir methane emissions (especially in the tropics), and community displacement. On the AP exam, demonstrate nuanced cost-benefit analysis: evaluate hydro not as an unqualified good or bad, but as a technology whose net impact depends on site-specific ecological, social, and climatic factors.