

SECTION 1
Historical Context & Motivation
For most of recorded history, wetlands and mangroves were viewed as wastelands—mosquito-ridden swamps to be drained or filled for agriculture, urbanization, and port construction. In the United States alone, the contiguous 48 states lost over 50% of their original wetland area between the 1780s and 1980s, amounting to roughly 45 million hectares destroyed. Globally, mangrove forests declined by an estimated 35% in the last several decades of the twentieth century, driven by aquaculture expansion, coastal development, and timber harvest. Only in the latter half of the twentieth century did ecologists and policymakers begin to recognize the extraordinary ecosystem services these habitats provide—from flood mitigation and water filtration to carbon sequestration and biodiversity support.
1849 • Swamp Land Acts (U.S.)
1971 • Ramsar Convention
1972 • U.S. Clean Water Act
1992 • Rio Earth Summit
2015 • Paris Agreement & Blue Carbon
The central question driving this topic is deceptively simple: What happens when human activity degrades or destroys the ecosystems that regulate flooding, filter pollutants, store carbon, and harbor biodiversity? Answering it requires understanding the specific mechanisms of wetland and mangrove loss, the cascading ecological consequences, and the policy tools available for conservation and restoration.
SECTION 2
Core Principles & Definitions
Before examining specific human impacts, it is essential to establish the ecological foundations of wetlands and mangroves and the services they deliver. Wetlands are transitional areas where the presence of water—either at the surface or within the root zone—controls soil development and the types of organisms that live there. Mangroves are a specialized subset: salt-tolerant trees and shrubs that colonize tropical and subtropical intertidal zones. Both ecosystems exhibit disproportionately high primary productivity relative to their area, making their loss especially consequential.
Ecosystem Services
Hydric Soils & Anaerobic Conditions
Blue Carbon
Ecotone & Biodiversity
Coastal Buffer Function
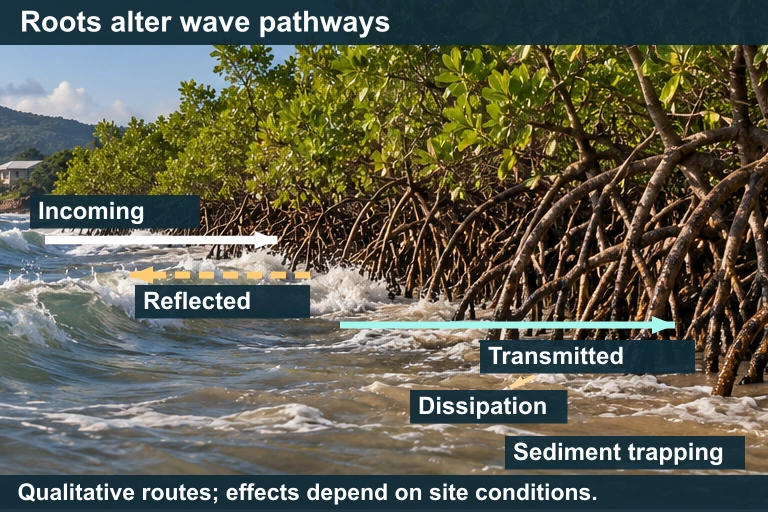 Mangrove roots and stems alter wave pathways and can trap sediment. Their protective effect depends on vegetation, water depth, waves and shoreline conditions.
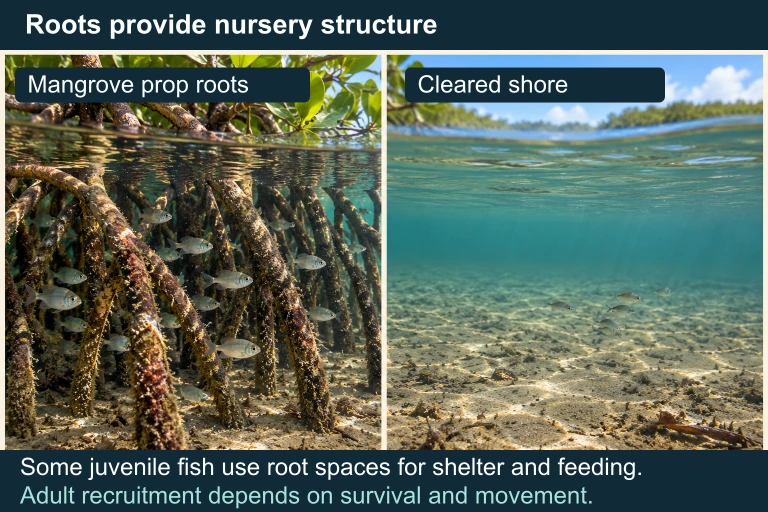 Mangrove roots can provide nursery structure for some juvenile fish; recruitment depends on survival, movement and other conditions.
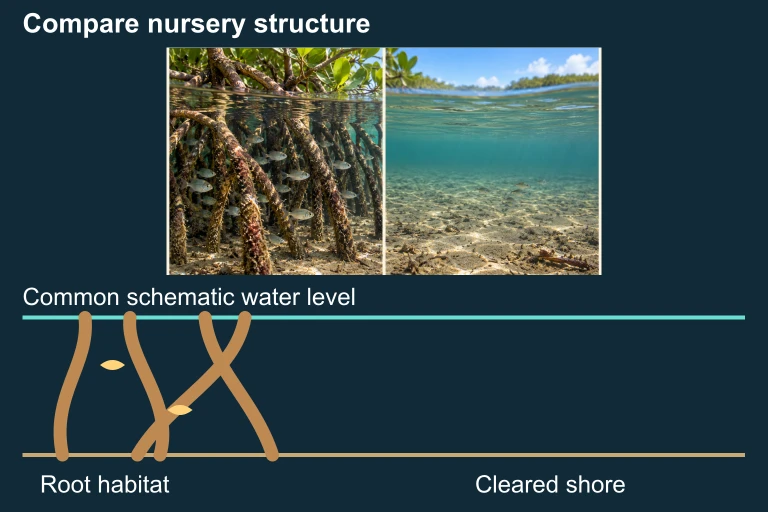 Roots provide structural refuge; benefits to recruitment depend on survival, movement and other conditions.
KEY TAKEAWAY
SECTION 3
Visual Explanation — Drivers & Consequences of Wetland Loss
The diagram above underscores a critical systems-level insight: human impacts on wetlands and mangroves do not operate in isolation. Urban development and agricultural drainage physically remove wetland area, while nutrient pollution degrades remaining wetlands from within through eutrophication and algal blooms. Dams reduce sediment supply to downstream wetlands and deltas, starving mangrove systems of the material they need to build and maintain land surfaces against rising seas. Aquaculture—particularly shrimp farming in Southeast Asia—has been the single largest driver of mangrove deforestation, converting dense mangrove forests into shallow ponds that often become unproductive within a decade due to disease and soil salinization.
SECTION 4
Mechanisms of Impact — How Human Activities Degrade Wetlands
Physical Destruction: Dredge, Fill, and Drainage
The most direct mechanism of wetland loss is physical removal. Dredging excavates bottom sediments for navigation channels, while filling deposits material to raise land surfaces for construction. Drainage involves ditching, tiling, or pumping to lower the water table, converting wetland soils into arable land. In the U.S., Section 404 of the Clean Water Act regulates dredge-and-fill activities, requiring permits and often mandating compensatory mitigation, yet cumulative losses from permitted and illegal fill remain significant. Once hydric soils are drained, oxidation of stored organic matter accelerates, releasing CO₂ and causing land subsidence—a problem visible across the Mississippi River Delta and the Florida Everglades.
Chemical Degradation: Nutrient Loading and Toxins
Even when wetlands remain physically intact, nonpoint-source pollution from agricultural and urban runoff can degrade their ecological function. Excess nitrogen and phosphorus fuel eutrophication—the overstimulation of algal and plant growth that depletes dissolved oxygen when biomass decomposes. Pesticides, heavy metals, and endocrine-disrupting compounds accumulate in wetland sediments and bioaccumulate through food webs, affecting amphibians, fish, and wading birds. Mercury methylation, a process enhanced in anaerobic wetland sediments, converts inorganic mercury to highly toxic methylmercury, which biomagnifies to dangerous concentrations in top predators.
Hydrological Alteration
Dams, levees, and water diversions fundamentally alter the hydroperiod—the seasonal pattern of water-level fluctuation—that defines wetland character. When upstream dams trap sediment, downstream deltas and coastal wetlands erode because they no longer receive the material needed to offset natural compaction and sea-level rise. The Louisiana coast loses approximately 45 square kilometers of wetland per year, partly due to levees that channel Mississippi River sediment directly into the deep Gulf rather than allowing it to nourish adjacent marshes. In mangrove systems, altered freshwater inputs change salinity gradients, shifting species composition and sometimes converting mangrove forests to hypersaline mudflats.
Climate Change Interactions
Sea-level rise threatens coastal wetlands and mangroves by increasing inundation depth and duration beyond the tolerance range of rooted vegetation. Whether a mangrove forest can migrate landward depends on whether suitable upland habitat exists and is not blocked by coastal development—a phenomenon termed coastal squeeze. Simultaneously, warming waters expand the latitudinal range of mangroves poleward, but this expansion rarely compensates for losses in tropical regions. Increased hurricane intensity can cause massive mangrove die-off events, as seen after Typhoon Haiyan in the Philippines (2013), and weakened forests recover more slowly when stressors like pollution and sedimentation deficit are present.
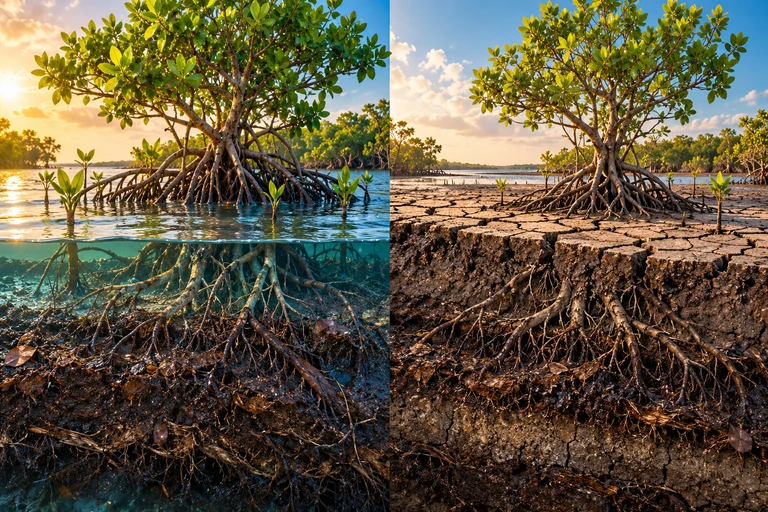 Drainage can increase oxygen access to wetland soils, accelerating aerobic carbon loss and contributing to subsidence. In the carbon-stock example, oxidation of 114,000 tonnes of carbon produces 418,000 tonnes of CO₂ over 20 years.
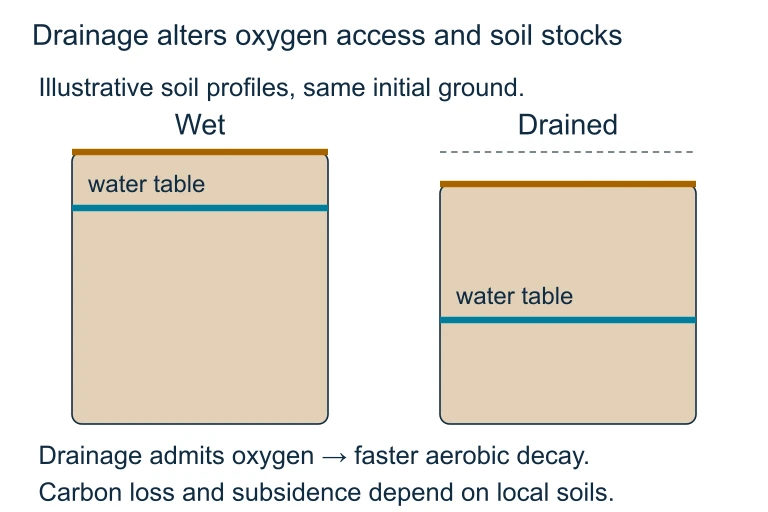 Drainage can increase oxygen access to wetland soils, accelerating aerobic carbon loss and contributing to subsidence. In the carbon-stock example, oxidation of 114,000 tonnes of carbon produces 418,000 tonnes of CO₂ over 20 years.
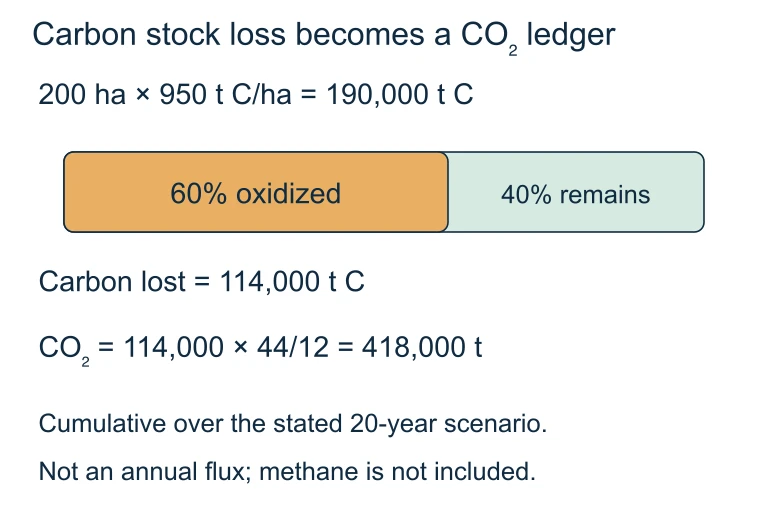 Oxidation of 114,000 tonnes of carbon corresponds to 418,000 tonnes of CO₂ using the mass ratio 44/12. The stated example distributes this loss over 20 years.
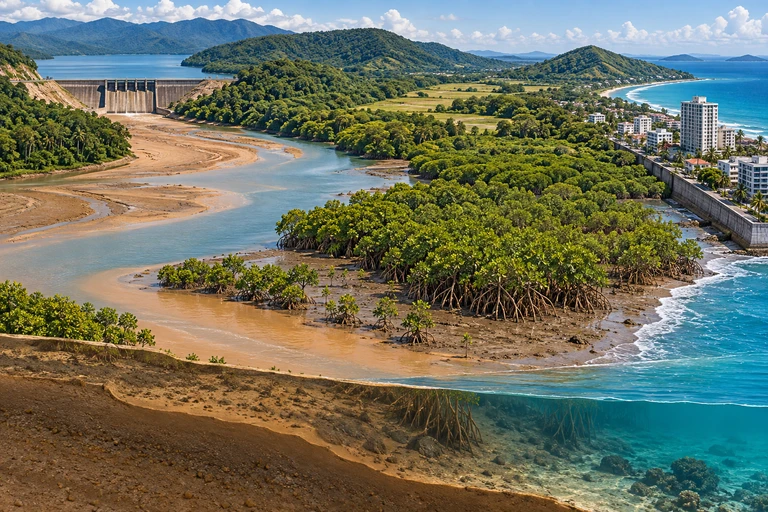 Coastal wetland persistence depends on sediment accretion, compaction, subsidence and relative sea-level change. An open migration corridor provides an option that a built barrier can block, but access alone does not ensure persistence.
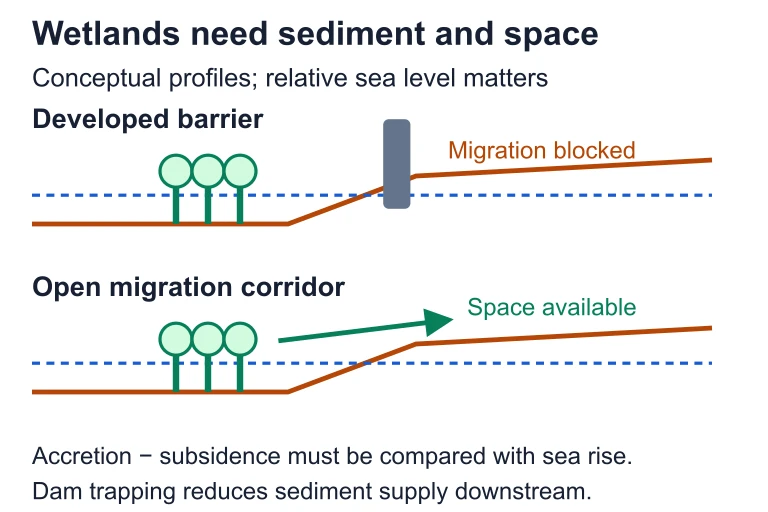 Coastal wetland persistence depends on sediment accretion, compaction, subsidence and relative sea-level change. An open migration corridor provides an option that a built barrier can block, but access alone does not ensure persistence.
SECTION 5
Types of Wetlands and Their Vulnerability
As the diagram illustrates, vulnerability varies by wetland type but also by geographic context. Peatlands (bogs and fens) store roughly one-third of all soil carbon worldwide despite covering only about 3% of the land surface. When drained for agriculture or peat extraction—common in Indonesia, Ireland, and Russia—decomposition of millennia-old organic deposits produces enormous CO₂ emissions. Indonesian peatland fires during dry El Niño years have released CO₂ rivaling the annual fossil-fuel emissions of entire European nations. Mangroves face analogous pressure in the tropics: between 2000 and 2016, the world lost approximately 62,000 hectares of mangrove forest per year, with Indonesia, Myanmar, and Malaysia accounting for the greatest absolute losses. Conversion to shrimp ponds is particularly problematic because the ponds are often abandoned after 5–10 years due to disease, leaving degraded, acidic land that is difficult and costly to restore.
SECTION 6
Worked Example — Estimating Carbon Emissions from Mangrove Conversion
A common AP Environmental Science calculation involves estimating the environmental cost of ecosystem conversion. The following worked example demonstrates how to quantify CO₂ emissions from the conversion of mangrove forest to a shrimp aquaculture pond.
CARBON EMISSION FROM LAND-USE CHANGE
Area is in hectares (ha); carbon density is in metric tonnes of C per ha (tC/ha); fraction lost is the proportion of stored carbon released upon conversion; the factor 44/12 converts mass of carbon to mass of CO₂ (molecular weight ratio).
CO₂ Emissions from Mangrove-to-Shrimp-Pond Conversion
- 1
Step 1 — Identify Given Values
A developer proposes clearing 200 ha of mangrove forest for shrimp aquaculture. The average total ecosystem carbon stock (aboveground biomass + soil carbon to 1 m depth) is 950 tC/ha. Research indicates that approximately 60% of this carbon is released within the first 20 years after conversion. - 2
Step 2 — Calculate Total Carbon at Risk
Total carbon = Area × Carbon density = 200 ha × 950 tC/ha = 190,000 tC.190,000 tonnes C stored in the mangrove area - 3
Step 3 — Apply Fraction Lost
Carbon released = 190,000 tC × 0.60 = 114,000 tC.114,000 tonnes of carbon released over ~20 years - 4
Step 4 — Convert Carbon to CO₂
CO₂ = 114,000 tC × (44 ÷ 12) = 114,000 × 3.67 ≈ 418,000 tonnes CO₂. This is equivalent to roughly 418 kilotonnes of CO₂, comparable to the annual emissions of a small city.≈ 418,000 tonnes CO₂ released - 5
Step 5 — Interpret the Result
The 200 ha conversion would release approximately 418 kt CO₂. If we consider that an average passenger car emits roughly 4.6 tonnes CO₂ per year, this release is equivalent to the annual emissions of about 91,000 cars. This calculation underscores why mangrove deforestation carries a climate cost far out of proportion to the land area involved and why blue carbon accounting is increasingly incorporated into national climate action plans.
SECTION 7
Trade-offs — Conservation vs. Development Pressures
| Factor | Arguments for Development | Arguments for Conservation |
|---|---|---|
| Economic | Aquaculture, ports, and housing generate immediate income and employment for coastal communities. | Intact wetlands provide services valued at $15,000–$200,000/ha/yr (flood protection, fishery nurseries, water purification), often exceeding short-term development gains. |
| Food Security | Shrimp farming supports livelihoods and protein supply in developing nations. | Mangroves support wild-capture fisheries worth billions annually; their loss undermines long-term food supply for artisanal fishing communities. |
| Climate | Development pressure is driven by population growth and poverty alleviation needs. | Wetland destruction releases stored carbon; conservation and restoration qualify as nature-based climate solutions under the Paris Agreement. |
| Disaster Risk | Engineered infrastructure (seawalls, levees) can substitute for natural storm buffers. | Natural buffers are self-maintaining and often more cost-effective; after the 2004 Indian Ocean tsunami, villages shielded by intact mangroves suffered significantly less damage. |
Development vs. Conservation: Key Trade-offs
KEY TAKEAWAY
SECTION 8
Policy Tools & Advanced Restoration Concepts
| Policy / Strategy | Mechanism | Limitations |
|---|---|---|
| Section 404 (CWA) | Requires permits for dredge/fill in U.S. waters; enforced by Army Corps of Engineers and EPA. | Jurisdiction has been narrowed by court rulings (e.g., SWANCC, Rapanos); does not protect all wetlands. |
| Ramsar Convention | Designates Wetlands of International Importance; 172 contracting parties commit to wise use. | Non-binding enforcement; depends on national implementation; monitoring gaps persist. |
| Mitigation Banking | Developers who destroy wetlands purchase credits from restored/created wetlands elsewhere. | Created wetlands often fail to replicate the full suite of services; temporal and spatial mismatch. |
| Blue Carbon Credits | Mangrove conservation/restoration generates verified carbon credits sold on voluntary markets. | Measurement uncertainty; additionality questions; carbon price volatility. |
| Community-Based Management | Local stakeholders manage mangrove resources sustainably through co-management agreements. | Requires tenure security and institutional support; vulnerable to external economic pressures. |
Policy Tools for Wetland and Mangrove Protection
Looking forward, nature-based solutions represent a paradigm shift in how societies value and manage wetlands. Rather than treating wetlands as obstacles, engineers and ecologists increasingly design constructed wetlands to treat municipal and agricultural wastewater, and governments invest in managed realignment—deliberately breaching sea walls to restore tidal wetlands that buffer against storms. These strategies align ecological restoration with climate adaptation, offering what some researchers term green infrastructure as a complement or alternative to traditional gray infrastructure. The AP exam frequently tests your ability to evaluate these strategies in terms of ecological effectiveness, economic feasibility, and social equity—so be prepared to discuss both strengths and limitations of any given approach.
SECTION 9
Practice Problems
Question 1: CONCEPTUAL
- A. Mangroves absorb excess precipitation before it reaches the coast.
- B. Mangrove root systems attenuate wave energy and reduce storm surge height.
- C. Mangroves increase ocean salinity, which suppresses wave formation.
- D. Mangroves reflect sunlight, lowering sea surface temperatures and reducing storm intensity.
Show answer (B)
Question 2: BASIC CALCULATION
- A. 6,000 tonnes CO₂
- B. 22,000 tonnes CO₂
- C. 55,000 tonnes CO₂
- D. 110,000 tonnes CO₂
Show answer (B)
Question 3: INTERMEDIATE
- A. Dams increase sediment delivery, helping mangroves expand, while shrimp ponds reduce overall mangrove area.
- B. Dams reduce sediment supply, limiting mangrove capacity to keep pace with sea-level rise, while shrimp ponds directly eliminate mangrove area.
- C. Dams increase freshwater flow to mangroves, improving growth, but shrimp ponds introduce saltwater intrusion.
- D. Dams and shrimp ponds both increase nutrient delivery to mangroves, causing eutrophication.
Show answer (B)
Question 4: APPLIED
4 ptsShow answer
Question 5: CRITICAL THINKING
4 ptsShow answer
SUMMARY
Lesson Summary
Summary
Wetlands and mangroves deliver a suite of bundled ecosystem services—flood attenuation, water filtration, blue carbon sequestration, and biodiversity support—that are disproportionately valuable relative to the area these ecosystems occupy. Human impacts fall into four categories: physical destruction (dredge, fill, drainage), chemical degradation (eutrophication, toxins), hydrological alteration (dams, diversions), and climate change (sea-level rise, coastal squeeze, increased storm intensity).
Key policy tools include the Clean Water Act Section 404, the Ramsar Convention, mitigation banking, and blue carbon credits. For the AP exam, be prepared to evaluate trade-offs between development and conservation using the concept of externalities, perform carbon-emission calculations using the C-to-CO₂ conversion factor (44/12 ≈ 3.67), and design investigations that assess wetland function. Remember that nature-based solutions such as mangrove restoration and constructed wetlands are increasingly tested as real-world applications of ecological principles.