

SECTION 1
Historical Context & Motivation
Throughout Earth's history, five mass extinction events have dramatically reshaped the planet's biological communities, but none were driven by a single species. Today, scientists increasingly recognize that anthropogenic activities are accelerating species loss at rates 100 to 1,000 times the background extinction rate, prompting many researchers to designate the current era as the sixth mass extinction. The concept of human-driven biodiversity decline is not purely modern; indigenous peoples documented local extirpations for centuries, and European colonialism triggered well-documented extinctions of island fauna such as the dodo. However, the scientific framing of biodiversity loss as a global crisis coalesced only in the late twentieth century, catalyzed by mounting evidence from ecology, genetics, and remote sensing.
1872 • First National Park Established
1962 • Silent Spring Published
1973 • Endangered Species Act (ESA)
1992 • Convention on Biological Diversity
2019 • IPBES Global Assessment
This historical trajectory raises a central question for environmental science: what specific mechanisms drive human-caused biodiversity loss, and how can scientific understanding inform effective policy responses? The remainder of this lesson systematically examines the HIPPCO framework—Habitat destruction, Invasive species, Population growth, Pollution, Climate change, and Overexploitation—as the principal drivers of the current extinction crisis.
SECTION 2
Core Principles & the HIPPCO Framework
Biodiversity encompasses three nested levels: genetic diversity (variation within a species), species diversity (the number and relative abundance of species in a community), and ecosystem diversity (the variety of habitats and ecological processes across a landscape). Human activities can erode each level simultaneously. The HIPPCO acronym organizes the major anthropogenic threats, though these drivers frequently interact synergistically—for instance, habitat fragmentation can increase a population's vulnerability to invasive species and climate stress.
Habitat Destruction & Fragmentation
Invasive Species
Pollution
Climate Change
Overexploitation
KEY TAKEAWAY
SECTION 3
Visual Explanation — Drivers of Biodiversity Loss
As the diagram illustrates, the HIPPCO drivers do not operate in isolation. Synergistic interactions between drivers amplify their individual effects—deforested land is simultaneously more vulnerable to invasive colonization, nutrient runoff, and microclimate shifts. Population growth sits at the base of the framework because increasing human numbers and per-capita consumption intensify demand for agricultural land, fossil fuels, and wildlife products. Understanding these interlocking pressures is essential for the AP exam, which frequently tests students' ability to trace causal chains connecting multiple HIPPCO factors to specific biodiversity outcomes.
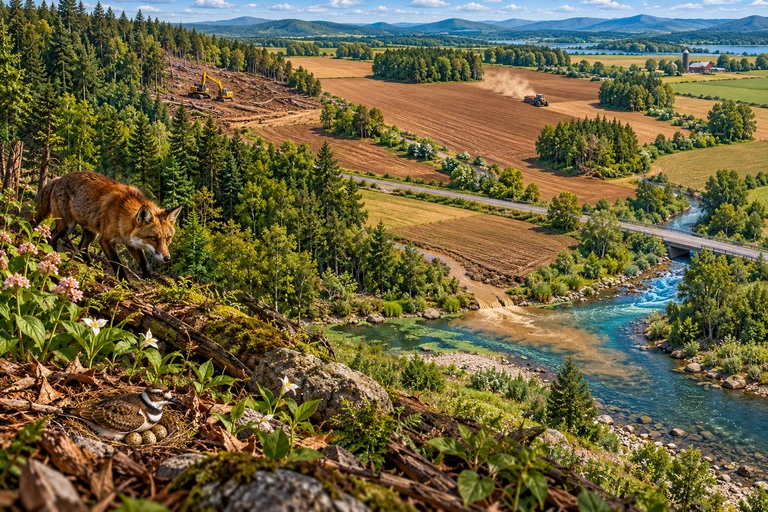 Habitat barriers can restrict movement, while pollution, climate change and other pressures affect organisms through additional mechanisms. Evidence is needed to determine whether their combined effects are additive, antagonistic or synergistic.
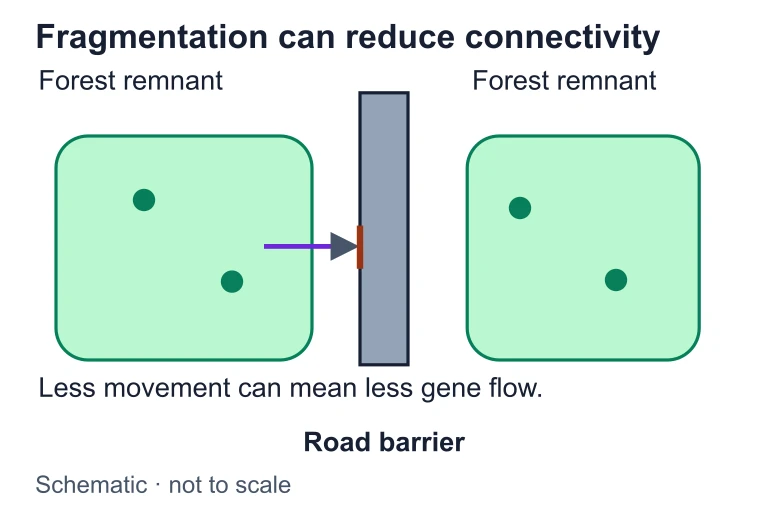 Habitat barriers can restrict movement, while pollution, climate change and other pressures affect organisms through additional mechanisms. Evidence is needed to determine whether their combined effects are additive, antagonistic or synergistic.
SECTION 4
Mechanisms of Biodiversity Loss
Habitat Fragmentation & the Species-Area Relationship
One of the most quantitatively useful tools for predicting biodiversity loss from habitat destruction is the species-area relationship, derived from island biogeography theory. This power-law relationship allows ecologists to estimate the number of species an area can support and, critically, to project how many species will be lost when habitat is reduced.
SPECIES-AREA RELATIONSHIP
Where S = number of species, c = constant specific to the taxon and region, A = area of habitat, and z = slope exponent (typically 0.15–0.35 for island-like fragments). Larger z values indicate greater sensitivity to area loss.
When habitat is reduced from an original area A₁ to a smaller area A₂, we can estimate the fraction of species remaining by comparing the two species counts:
SPECIES LOSS FROM HABITAT REDUCTION
Rearranging: fraction of species lost ≈ 1 − . If 90% of habitat is destroyed (A₂ / A₁ = 0.10) and z = 0.25, then S₂ / S₁ = ≈ 0.56, meaning roughly 44% of species are predicted to be lost.
Biomagnification of Pollutants
Pollutants like DDT and mercury enter food webs at low concentrations but magnify as they pass up trophic levels. Bioaccumulation describes the buildup of a substance within a single organism over its lifetime, while biomagnification refers to increasing concentrations at successively higher trophic levels. Top predators—bald eagles, orcas, tuna—are therefore most susceptible to reproductive failure, neurological damage, and population collapse from persistent organic pollutants (POPs) and heavy metals.
Climate-Driven Range Shifts
As global mean temperatures rise, isotherms shift poleward at approximately 6.1 km per decade in terrestrial systems. Species must track suitable climatic conditions or face local extirpation. Mobile organisms such as birds and butterflies can sometimes keep pace, but sessile species like trees and corals cannot. When a species' dispersal rate falls below the rate of climate envelope movement, a phenomenon called climate debt develops—the species persists temporarily in conditions that no longer support long-term viability, and delayed extinction follows.
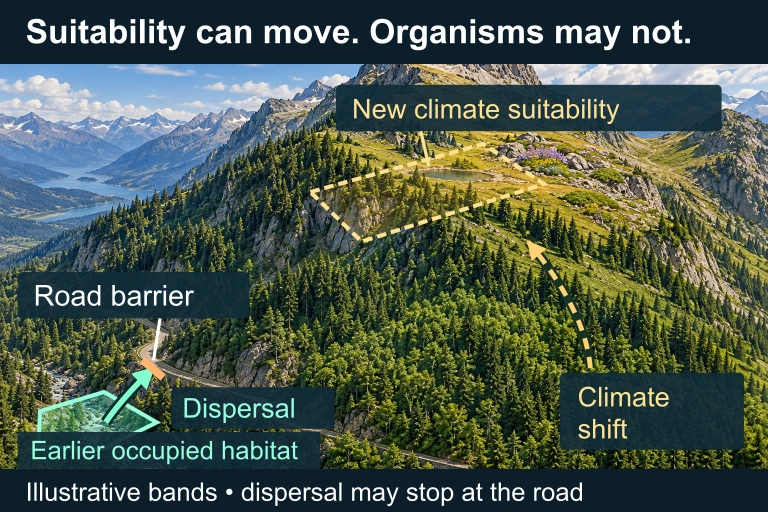 A shifting climate envelope can leave suitable habitat separated by roads or development. Adult immobility does not preclude dispersal by seeds or larvae. Colored bands and arrows are conceptual overlays, not measured species locations. The upper suitability band does not establish occupancy; the road can constrain the shown dispersal path but is not universally impermeable.
SECTION 5
Case Studies & Classification of Threats
| Case Study | Primary Driver | Mechanism & Outcome |
|---|---|---|
| Amazon Deforestation | Habitat destruction (cattle ranching, soy agriculture) | ~17% of Amazon forest lost since 1970; fragmentation reduces specialist species, increases edge-dwelling generalists; tipping-point risk of savannification. |
| Coral Reef Bleaching | Climate change + pollution (ocean acidification, warming) | Elevated SSTs expel zooxanthellae; back-to-back bleaching events on the Great Barrier Reef (2016–2017) killed ~50% of shallow-water corals. |
| Brown Tree Snake in Guam | Invasive species | Introduced post-WWII; extirpated 10 of 12 native forest bird species through predation; cascade effects on pollination and seed dispersal. |
| Atlantic Cod Collapse | Overexploitation | Decades of overfishing reduced cod biomass by >99% off Newfoundland by 1992; moratorium declared but stocks have not fully recovered after 30+ years. |
Representative case studies for major HIPPCO drivers
These case studies underscore a recurring pattern on the AP exam: test questions frequently present a scenario and ask students to identify the primary and secondary HIPPCO drivers operating, then trace their ecological consequences through food webs, nutrient cycles, or population dynamics. Successful responses integrate multiple drivers and acknowledge that synergistic effects often make combined threats more damaging than the sum of their individual impacts.
SECTION 6
Worked Example — Predicting Species Loss
A tropical forest originally covering 50,000 km² supports an estimated 2,000 bird species. Deforestation reduces the forest to 5,000 km². Using a species-area exponent of z = 0.30, estimate how many bird species are expected to survive in the remaining forest.
Species-Area Calculation
- 1
Step 1 — Identify Given Values
Original area A₁ = 50,000 km². Reduced area A₂ = 5,000 km². Original species count S₁ = 2,000. Exponent z = 0.30. - 2
Step 2 — Compute Area Ratio
A₂ / A₁ = 5,000 / 50,000 = 0.10. The habitat has been reduced to 10% of its original area.A₂ / A₁ = 0.10 - 3
Step 3 — Apply Species-Area Relationship
S₂ / S₁ = = . Using logarithms: log(0.10) = −1, so 0.30 × (−1) = −0.30, and ≈ 0.501.S₂ / S₁ ≈ 0.501 - 4
Step 4 — Calculate Surviving Species
S₂ = S₁ × 0.501 = 2,000 × 0.501 ≈ 1,002 species expected to survive.S₂ ≈ 1,002 species - 5
Step 5 — Interpret Result
Approximately 998 bird species (~50%) are predicted to be lost following a 90% reduction in forest area. This estimate assumes equilibrium conditions; actual losses may be delayed (extinction debt) or accelerated by edge effects, hunting, and invasive species.
SECTION 7
Conservation Strategies — Strengths & Limitations
Effective responses to human-driven biodiversity loss involve a portfolio of strategies, each with distinct advantages and constraints. The AP exam frequently asks students to evaluate the appropriateness of a conservation intervention for a specific scenario, so understanding trade-offs is essential.
| Strategy | Strengths | Limitations |
|---|---|---|
| Protected Areas (National Parks, Reserves) | Legally restrict development; preserve intact ecosystems; support ecotourism revenue. | Can displace indigenous communities; effectiveness depends on enforcement; may be too small or isolated to sustain viable populations. |
| Wildlife Corridors | Connect fragmented habitats; restore gene flow; allow species to track shifting climate envelopes. | Require multi-stakeholder coordination; can facilitate spread of disease or invasive species; expensive to establish. |
| Captive Breeding / Seed Banks | Preserve genetic material; allow reintroduction; serve as insurance against extinction. | Small populations lose genetic diversity; animals may lose wild behaviors; costly and cannot replace habitat protection. |
| Legislation (ESA, CITES) | Provide legal enforcement; regulate trade; mandate habitat protections. | Enforcement varies by country; listing process is slow; political opposition can weaken protections. |
| Community-Based Conservation | Empowers local stakeholders; integrates traditional ecological knowledge; reduces human-wildlife conflict. | Requires sustained funding; outcomes depend on local governance capacity; difficult to scale. |
Comparison of major conservation strategies
KEY TAKEAWAY
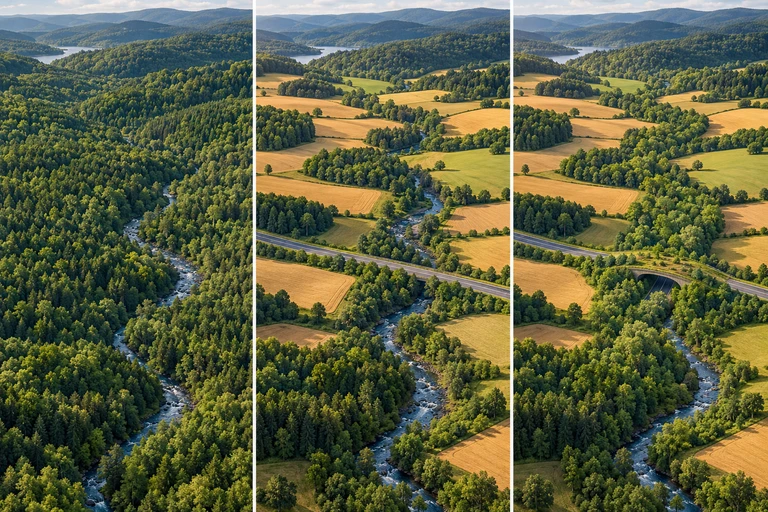 Movement between fragments does not by itself establish gene flow. Movement tracking, reproduction and parentage evidence answer different parts of the conservation question.
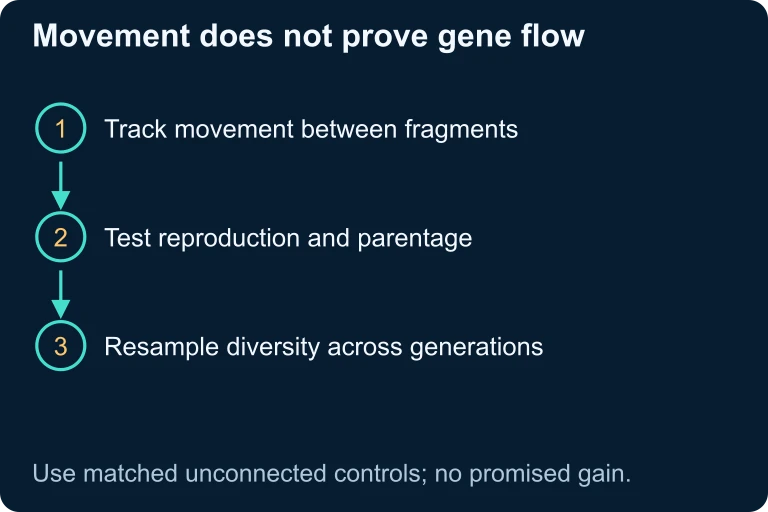 Tracking movement tests connectivity. Parentage, successful reproduction and changes in genetic composition supply additional evidence for gene flow.
SECTION 8
Connections to Ecosystem Services & Emerging Concepts
Biodiversity loss does not merely reduce species counts; it degrades the ecosystem services upon which human societies depend. These services—pollination, water purification, carbon sequestration, disease regulation, nutrient cycling—represent the functional value of biodiversity. The economic valuation of ecosystem services provides a bridge between ecological science and policy: studies estimate that global ecosystem services are worth trillions of dollars annually, and their degradation imposes real costs on agriculture, public health, and disaster resilience.
| Concept | AP APES Focus | Advanced / College Extension |
|---|---|---|
| Extinction Debt | Species may persist temporarily after habitat loss but face delayed extinction. | Modeling extinction debt uses metapopulation dynamics and stochastic simulations to predict time-to-extinction for fragmented populations. |
| Trophic Cascades | Loss of keystone predators can restructure entire food webs (e.g., wolves in Yellowstone). | Cascade strength depends on food web connectivity; interaction modification models quantify indirect effects across multiple trophic levels. |
| Biodiversity Hotspots | Regions with high endemism and ≥70% habitat loss; 36 hotspots harbor >50% of Earth's plant species. | Systematic conservation planning uses complementarity algorithms to prioritize sites that maximize species representation per dollar invested. |
| Minimum Viable Population | The smallest population size capable of persisting for a defined time frame (often 99% probability over 1,000 years). | Population viability analysis (PVA) integrates demographic, genetic, and environmental stochasticity to assess extinction risk quantitatively. |
AP-level vs. advanced extensions of key biodiversity concepts
The AP exam focuses on recognizing these concepts and applying them qualitatively, while college-level ecology courses will expect quantitative modeling. Understanding how extinction debt and trophic cascades operate prepares you for FRQ prompts that ask you to trace ecological consequences over time and across trophic levels.
SECTION 9
Practice Problems
Question 1: CONCEPTUAL
- A. Island species have higher genetic diversity, making them more susceptible to disease carried by invasives.
- B. Islands are smaller than continents, so invasive species always outcompete natives for limited space.
- C. Island species evolved without exposure to many predators and competitors, leaving them without effective defenses against introduced organisms.
- D. Island species reproduce more slowly than mainland species, giving invasive species a reproductive advantage.
Show answer (C)
Question 2: BASIC CALCULATION
- A. 125 species
- B. 354 species
- C. 500 species
- D. 250 species
Show answer (B)
Question 3: INTERMEDIATE
- A. Reduced pollinator diversity limits cross-pollination of crops, lowering fruit and seed production.
- B. Deforestation increased soil erosion, depleting nutrients available to crops.
- C. Rising atmospheric CO₂ concentrations reduced the nutritional value of crop plants.
- D. Invasive pollinator species replaced native ones but are more effective at pollinating crops.
Show answer (A)
Question 4: APPLIED
4 ptsShow answer
Question 5: CRITICAL THINKING
4 ptsShow answer
SUMMARY
Lesson Summary
Summary
Human activities are driving a sixth mass extinction through six interconnected HIPPCO drivers: habitat destruction (the single largest threat, affecting ~85% of threatened species), invasive species, population growth, pollution (with bioaccumulation and biomagnification concentrating toxins at higher trophic levels), climate change, and overexploitation. The species-area relationship (S = c × ) provides a quantitative tool for predicting species loss from habitat reduction, and concepts like extinction debt and trophic cascades explain why biodiversity impacts often unfold on delayed timelines and propagate through food webs.
Conservation responses include protected areas, wildlife corridors, legislation (ESA, CITES), captive breeding programs, and community-based conservation. No single strategy is sufficient; the most effective approaches layer multiple interventions. For the AP exam, focus on identifying HIPPCO drivers in novel scenarios, applying the species-area equation, tracing consequences through ecosystem services, and evaluating trade-offs among conservation strategies.