AP Environmental Science • Global Change

Global Climate Change

Understanding how anthropogenic greenhouse gas emissions are altering Earth's energy balance and reshaping global ecosystems.

A sprouting plant framed by Earth and recycling symbols.
Inside this lesson 10 sections 5 questions 8 figures

SECTION 1

Historical Context & Scientific Discovery

The scientific understanding of global climate change did not emerge overnight; it was built over nearly two centuries of incremental discoveries in atmospheric physics, chemistry, and geoscience. In 1824, French mathematician Joseph Fourier first proposed that Earth's atmosphere acts like the glass of a greenhouse, trapping heat that would otherwise radiate back into space. This early insight launched a line of inquiry that would eventually reveal one of the most consequential environmental challenges humanity has ever faced. The progression from Fourier's conceptual framework to the modern understanding of anthropogenic warming illustrates how converging lines of evidence—ice-core records, spectroscopic measurements, and computational climate models—can transform a hypothesis into a scientific consensus embraced by virtually every national academy of sciences on the planet.

1824 • Fourier's Greenhouse Analogy

Joseph Fourier calculates that Earth would be far colder without its atmosphere, proposing that atmospheric gases trap outgoing infrared radiation—the conceptual foundation of the greenhouse effect.

1896 • Arrhenius Quantifies CO₂ Warming

Svante Arrhenius publishes the first quantitative estimate that doubling atmospheric CO₂ would raise global temperature by roughly 5–6 °C, a remarkably prescient calculation given the tools of the era.

1958 • Keeling Curve Begins

Charles David Keeling begins continuous CO₂ measurements at Mauna Loa Observatory in Hawaii, producing an unbroken record that reveals a steady year-over-year rise superimposed on a seasonal oscillation.

1988 • IPCC Established

The United Nations creates the Intergovernmental Panel on Climate Change (IPCC) to assess the scientific basis, impacts, and policy responses to climate change through periodic assessment reports.

2015 • Paris Agreement

195 nations adopt the Paris Agreement, pledging to limit global warming to well below 2 °C above pre-industrial levels and pursuing efforts to keep it below 1.5 °C through nationally determined contributions.

This historical arc raises the central question of the lesson: how do greenhouse gases alter Earth's radiative energy balance, and what evidence links accelerating fossil-fuel combustion to the warming trends observed across land, ocean, and atmosphere? To answer these questions, we must examine the physical principles governing energy flow through the climate system, the feedback mechanisms that amplify or dampen warming, and the far-reaching ecological and societal consequences that follow from even modest shifts in global mean temperature.

SECTION 2

Core Principles of Global Climate Change

Global climate change rests on a set of well-established physical and chemical principles. At the most fundamental level, the greenhouse effect is a natural process that keeps Earth's surface approximately 33 °C warmer than it would be if the atmosphere were transparent to infrared radiation. The concern arises when human activities—primarily the combustion of fossil fuels, deforestation, and industrial agriculture—augment the concentration of greenhouse gases beyond their natural baseline, intensifying this warming in what is termed the enhanced greenhouse effect. Understanding the distinction between these two phenomena is essential for the AP Environmental Science exam.

1

The Natural Greenhouse Effect

Short-wave solar radiation passes through the atmosphere and warms Earth's surface. The surface re-emits this energy as long-wave infrared radiation, which is absorbed and re-radiated by greenhouse gases (CO₂, H₂O, CH₄, N₂O), warming the troposphere.
2

Enhanced Greenhouse Effect

Anthropogenic emissions increase greenhouse gas concentrations above pre-industrial levels (CO₂ from ~280 ppm to >420 ppm). This additional absorption of outgoing infrared radiation creates a positive radiative forcing that raises global mean temperature.
3

Positive Feedback Loops

Ice-albedo feedback: warming melts reflective ice, exposing darker land or ocean that absorbs more sunlight. Water-vapor feedback: warmer air holds more H₂O—itself a potent greenhouse gas—amplifying the initial warming signal.
4

Negative Feedback Mechanisms

Increased cloud cover from higher evaporation may reflect more incoming solar radiation (cloud-albedo effect). Chemical weathering of silicate rocks accelerates with warmth, drawing down atmospheric CO₂ over geological timescales.
5

Carbon Sources & Sinks

Sources release carbon (fossil-fuel combustion, deforestation, cement production). Sinks absorb carbon (oceans, photosynthesis, soil). When sources exceed sinks, atmospheric CO₂ rises, intensifying the enhanced greenhouse effect.

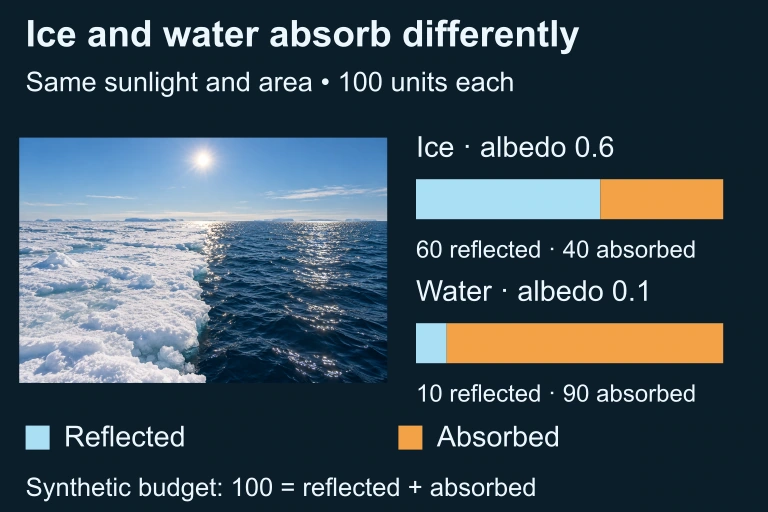
Preserved ice and open-water artwork is paired with two equal-length 100-unit budget bars: ice 60 reflected plus 40 absorbed, water 10 reflected plus 90 absorbed. A separate loop connects warming, melting, lower albedo and more solar absorption.Under equal sunlight, the selected darker-water surface absorbs more radiation than the ice surface. Additional warming can reinforce melting and further reduce albedo. The synthetic budget gives 100 incident units to equal areas: ice reflects 60 and absorbs 40, while open water reflects 10 and absorbs 90. Bar lengths encode these exact totals; the separate feedback arrows are qualitative.
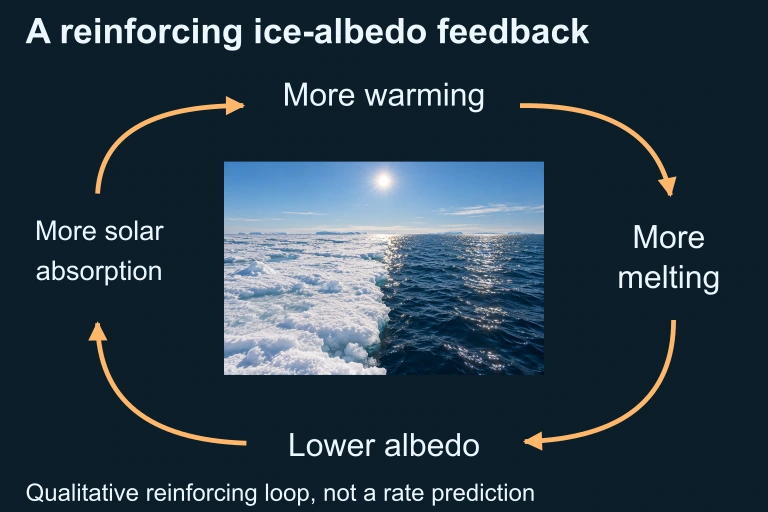
A loop links warming, ice melt, lower albedo and greater solar absorption back to warming.Ice–albedo feedback reinforces an initial warming; the arrows show relationships, not feedback magnitude.

✦

KEY TAKEAWAY

Think of Earth's atmosphere as a thermal blanket. The natural greenhouse effect is like sleeping with a single blanket on a cool night—it keeps you comfortably warm. Adding anthropogenic greenhouse gases is like piling on extra blankets: each additional layer traps more body heat, and eventually you overheat. Positive feedbacks are like the blankets making you sweat, producing moisture that traps even more heat. The key point for the AP exam is that the greenhouse effect itself is beneficial; it is the enhancement of this natural process by human activities that drives problematic warming.

SECTION 3

Earth's Energy Balance — A Visual Explanation

Earth's Radiative Energy BalanceSunEarth's SurfaceAtmosphere (CO₂, CH₄, H₂O, N₂O)Incoming solar (340 W/m²)Absorbed ~240 W/m²Reflected ~100 W/m²IR emitted ↑Re-radiated ↓Escapes to space ~240 W/m²At equilibrium:Energy in ≈ Energy out
The diagram illustrates Earth's radiative energy balance. Approximately 340 W/m² of short-wave solar radiation reaches the top of the atmosphere. About 100 W/m² is reflected by clouds, aerosols, and ice (albedo), while ~240 W/m² is absorbed by the surface and atmosphere. The surface emits infrared (IR) radiation upward, where greenhouse gases absorb and re-radiate it both toward space and back toward the surface (the greenhouse effect). At equilibrium, energy in equals energy out; adding greenhouse gases disrupts this balance, producing a net positive radiative forcing.

The visual above encapsulates the most critical idea for the AP Environmental Science exam: the climate system operates on an energy budget. Incoming short-wave radiation from the sun is either reflected or absorbed, and the absorbed energy is re-emitted as long-wave infrared radiation. Greenhouse gases in the atmosphere intercept a portion of this outgoing infrared energy and re-radiate it in all directions, including back toward the surface. This downward re-radiation is the physical basis of the greenhouse effect. When additional CO₂, CH₄, and N₂O accumulate in the atmosphere, the proportion of intercepted outgoing IR increases, creating a temporary imbalance—more energy enters the system than leaves it—which manifests as a rise in global mean surface temperature. The system eventually reaches a new, warmer equilibrium, but only after the excess energy has been distributed through the oceans, cryosphere, and biosphere.

SECTION 4

Mathematical Framework — Radiative Forcing & Temperature Change

While the AP Environmental Science exam does not require deriving climate models from first principles, a quantitative understanding of radiative forcing and its relationship to temperature change is tested through calculation-based free-response questions. Two key relationships capture the essence of the mathematics involved.

RADIATIVE FORCING FROM CO₂

ΔF=5.35×ln(C/C0)[W/m2]ΔF = 5.35 × ln(C / C₀) [W/m²]

Where ΔF is the change in radiative forcing (W/m²), C is the current CO₂ concentration (ppm), C₀ is the pre-industrial CO₂ concentration (~280 ppm), and ln is the natural logarithm. The logarithmic relationship means each successive doubling of CO₂ adds the same increment of forcing.

CLIMATE SENSITIVITY

ΔT=λ×ΔFΔT = λ × ΔF

Where ΔT is the change in global mean surface temperature (°C), λ is the climate sensitivity parameter (approximately 0.8 °C per W/m² when feedbacks are included), and ΔF is the radiative forcing. The IPCC estimates that doubling CO₂ from 280 to 560 ppm yields an equilibrium warming of roughly 2.5–4.0 °C.

GLOBAL WARMING POTENTIAL (GWP)

CO2equivalents=massofgas×GWPCO₂ equivalents = mass of gas × GWP

GWP compares the warming impact of a given mass of greenhouse gas to the same mass of CO₂ over a specified time horizon (usually 100 years). For example, CH₄ has a GWP of ~28, meaning 1 kg of methane traps as much heat as 28 kg of CO₂ over 100 years. N₂O has a GWP of ~265.

📐

WHY THE LOG MATTERS

The logarithmic nature of the CO₂–forcing relationship means that going from 280 to 560 ppm produces the same radiative forcing increase as going from 560 to 1120 ppm. In practical terms, the first increments of CO₂ added to a pristine atmosphere produce the greatest warming per molecule. This is analogous to insulation in a building: the first inch of insulation delivers the largest improvement; additional inches still help but yield diminishing returns. This concept is frequently tested on the AP exam in the context of why methane and nitrous oxide, despite their lower atmospheric concentrations, can have disproportionate warming effects relative to their abundance.

SECTION 5

Greenhouse Gases — Sources, Sinks & Global Warming Potentials

Not all greenhouse gases contribute equally to the enhanced greenhouse effect. Their relative impact depends on three factors: atmospheric concentration, atmospheric lifetime, and radiative efficiency (how effectively each molecule absorbs infrared radiation). The Global Warming Potential (GWP) metric integrates these factors to enable apples-to-apples comparisons among different gases.

Greenhouse GasFormulaPrimary Anthropogenic SourcesPrimary SinksGWP (100-yr)Atmospheric Lifetime
Carbon dioxideCO₂Fossil-fuel combustion, deforestation, cement productionPhotosynthesis, ocean absorption1 (reference)Variable (100–1000+ yrs)
MethaneCH₄Agriculture (enteric fermentation, rice paddies), landfills, natural gas leaksOxidation by OH radicals in the troposphere~28~12 years
Nitrous oxideN₂OSynthetic fertilizers, fossil-fuel combustion, industrial processesStratospheric photolysis, bacterial denitrification~265~121 years
CFCs/HFCsVariousRefrigerants, aerosols, foam-blowing agentsStratospheric photolysis (CFCs); tropospheric oxidation (HFCs)1,000–14,000+Varies (years to centuries)
Water vaporH₂ONot directly emitted at scale; concentration controlled by temperature (feedback, not forcing)Precipitation, condensationN/A~9 days

Major greenhouse gases, their sources, sinks, GWP values, and atmospheric lifetimes

100-Year Global Warming Potential (GWP) Comparison050100150200250+1CO₂28CH₄265N₂O1,300HFC-134aGWP (relative to CO₂ = 1)Note: HFC-134a bar truncated; actual GWP = 1,300
This bar chart compares the 100-year Global Warming Potentials (GWPs) of four greenhouse gases. CO₂ serves as the reference (GWP = 1). Although methane (CH₄) has a relatively short atmospheric lifetime (~12 years), it is 28 times more effective per kilogram at trapping heat over 100 years. Nitrous oxide (N₂O) and hydrofluorocarbons (HFCs) exhibit even higher GWPs, underscoring why reducing emissions of these trace gases can deliver large climate benefits per unit mass reduced.

SECTION 6

Worked Example — CO₂ Equivalents & Radiative Forcing

The following worked example walks through two calculation types commonly encountered on the AP Environmental Science exam: converting methane emissions to CO₂ equivalents, and estimating the radiative forcing from a change in atmospheric CO₂ concentration.

Calculating CO₂ Equivalents and Radiative Forcing

  1. 1

    Step 1 — Identify Given Values

    A dairy farm emits 500 metric tons of CH₄ per year. The 100-year GWP of CH₄ is 28. The current atmospheric CO₂ concentration is 420 ppm; the pre-industrial baseline (C₀) is 280 ppm.
  2. 2

    Step 2 — Convert CH₄ Emissions to CO₂ Equivalents

    Apply the GWP formula: CO₂ equivalents = mass of gas × GWP. Therefore: CO₂ eq = 500 metric tons CH₄ × 28 = 14,000 metric tons CO₂ equivalents per year. This means the farm's methane emissions have the same 100-year warming impact as emitting 14,000 metric tons of CO₂.
    14,000 metric tons CO₂eq/yr
  3. 3

    Step 3 — Calculate Radiative Forcing from CO₂ Increase

    Use the radiative forcing equation: ΔF = 5.35 × ln(C / C₀). Substituting: ΔF = 5.35 × ln(420 / 280) = 5.35 × ln(1.5).
  4. 4

    Step 4 — Evaluate the Natural Logarithm

    Using a calculator (allowed on the AP exam): ln(1.5) ≈ 0.405. Therefore: ΔF = 5.35 × 0.405 ≈ 2.17 W/m². This represents the additional radiative forcing from CO₂ alone relative to pre-industrial levels.
    ΔF ≈ 2.17 W/m²
  5. 5

    Step 5 — Estimate Temperature Change

    Using the climate sensitivity relation ΔT = λ × ΔF with λ ≈ 0.8 °C per W/m²: ΔT = 0.8 × 2.17 ≈ 1.74 °C. This aligns with observed warming trends when all greenhouse gases and aerosol effects are considered. Note that actual warming is a bit lower because of the cooling effect of aerosols and the thermal inertia of the oceans.
    ΔT ≈ 1.74 °C warming from CO₂ alone

SECTION 7

Impacts of Climate Change & Response Strategies

The consequences of global climate change extend across ecological, economic, and social systems. The AP exam expects students to evaluate both the impacts and the two broad categories of response strategies: mitigation (reducing the magnitude of future warming by cutting emissions or enhancing sinks) and adaptation (adjusting human and natural systems to minimize harm from warming already underway).

CategoryMitigation StrategiesAdaptation Strategies
EnergyTransition to renewable energy (solar, wind, geothermal); carbon capture and storage (CCS); nuclear powerClimate-resilient energy infrastructure; decentralized microgrids to withstand extreme weather
AgricultureReducing CH₄ from livestock (feed additives); minimizing N₂O from fertilizers (precision agriculture)Drought-resistant crop varieties; shifting planting seasons; improved irrigation efficiency
Land UseReforestation and afforestation to enhance carbon sinks; reducing deforestation (REDD+ programs)Wildlife corridors to facilitate species migration; managed retreat from flood-prone areas
Policy & EconomicsCarbon taxes, cap-and-trade systems, international agreements (Paris Agreement), fuel efficiency standardsCoastal sea walls and levees; updated building codes; early warning systems for extreme weather events
EcosystemsProtecting and restoring blue-carbon ecosystems (mangroves, seagrass beds, salt marshes)Assisted migration of climate-sensitive species; expanding marine protected areas

Comparison of mitigation and adaptation strategies across sectors

⚖️

MITIGATION vs. ADAPTATION

A helpful way to distinguish these two approaches: mitigation is like turning down the burner under a boiling pot to prevent the water from boiling over, while adaptation is like putting on oven mitts and using a larger pot so you can handle the boiling water more safely. Both strategies are necessary because some degree of warming is already locked in by the greenhouse gases currently in the atmosphere, but mitigation is essential to limit the severity of long-term changes. On the AP exam, be prepared to evaluate specific strategies and explain whether they represent mitigation, adaptation, or both.

A coastal community with elevated homes, wetland buffer, warning mast, solar arrays and wind turbines.Cleaner electricity and carbon storage can reduce future climate forcing. Elevated infrastructure, warnings, buffers and retreat can reduce exposure or vulnerability. Wetlands can support both responses through different mechanisms.
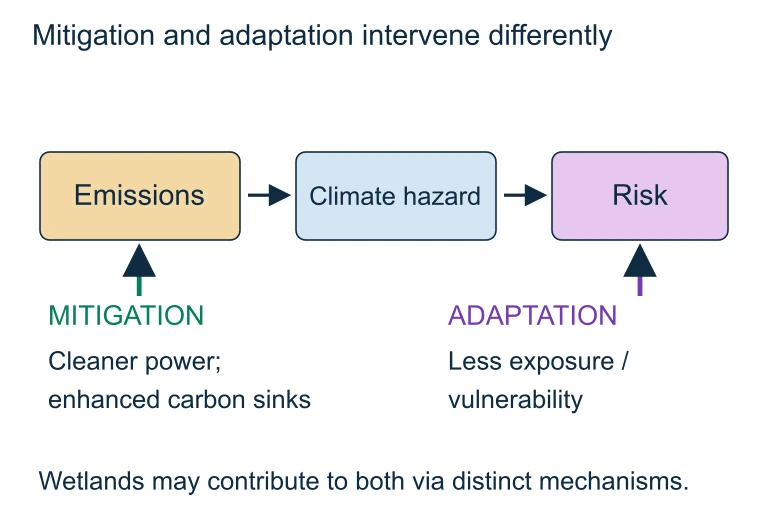
Mitigation and adaptation intervene differently. Cleaner electricity and carbon storage can reduce future climate forcing. Elevated infrastructure, warnings, buffers and retreat can reduce exposure or vulnerability. Wetlands can support both responses through different mechanisms.Cleaner electricity and carbon storage can reduce future climate forcing. Elevated infrastructure, warnings, buffers and retreat can reduce exposure or vulnerability. Wetlands can support both responses through different mechanisms.

SECTION 8

Connections to Ocean Acidification & Tipping Points

Global climate change does not operate in isolation. The same CO₂ emissions driving atmospheric warming are simultaneously altering ocean chemistry, and the combined effects may trigger irreversible tipping points in the Earth system. Understanding these interconnections is critical for the AP exam because free-response questions often require students to trace cause-and-effect chains across multiple environmental systems.

FeatureGlobal Warming (Atmosphere)Ocean Acidification
Primary driverGreenhouse gas absorption of outgoing infrared radiationDissolution of CO₂ into seawater forming carbonic acid (H₂CO₃)
Key metricGlobal mean surface temperature (°C anomaly)Ocean pH (has dropped from ~8.2 to ~8.1 since pre-industrial times)
Major biological impactHabitat shifts, species range changes, coral bleaching from thermal stressReduced calcification rates in corals, mollusks, and foraminifera
Feedback to climatePositive feedbacks (ice-albedo, water vapor, permafrost thaw releasing CH₄)Reduced ocean CO₂ uptake capacity as pH drops (weakening of ocean carbon sink)
Tipping point exampleCollapse of West Antarctic Ice Sheet → multi-meter sea-level riseDissolution of coral reef frameworks → collapse of tropical marine food webs

Atmospheric warming vs. ocean acidification — dual threats from CO₂ emissions

💡

AP Exam Tip: Tipping Points

FRQ questions may ask you to identify and explain climate tipping points. Key examples include: (1) the ice-albedo feedback triggering irreversible Arctic sea-ice loss, (2) permafrost thaw releasing vast stores of CH₄ and CO₂, and (3) dieback of the Amazon rainforest converting a major carbon sink into a carbon source. Practice constructing causal chains: initial warming → trigger mechanism → amplifying feedback → irreversible consequence.

SECTION 9

Practice Problems

Question 1: CONCEPTUAL

Which of the following best describes why the greenhouse effect is considered a natural and necessary process for life on Earth?
  • A. It prevents all ultraviolet radiation from reaching Earth's surface.
  • B. It maintains Earth's average surface temperature approximately 33 °C warmer than it would be without an atmosphere.
  • C. It absorbs incoming short-wave radiation before it reaches the troposphere.
  • D. It increases the albedo of Earth's surface, keeping polar regions frozen.
Show answer (B)
B is correct. Without the natural greenhouse effect, Earth's average surface temperature would be approximately −18 °C rather than the current ~15 °C, a difference of about 33 °C. This warming occurs because greenhouse gases absorb and re-radiate outgoing long-wave (infrared) radiation. A is incorrect because UV filtration is primarily the role of the ozone layer, not the greenhouse effect. C is incorrect because greenhouse gases primarily interact with outgoing long-wave infrared radiation, not incoming short-wave radiation. D is incorrect because the greenhouse effect warms the surface rather than increasing albedo; in fact, warming reduces ice cover and lowers albedo.

Question 2: BASIC CALCULATION

A landfill releases 200 metric tons of CH₄ per year. Using a 100-year GWP of 28 for CH₄, what is the emission rate in CO₂ equivalents?
  • A. 228 metric tons CO₂eq/yr
  • B. 2,800 metric tons CO₂eq/yr
  • C. 5,600 metric tons CO₂eq/yr
  • D. 7.14 metric tons CO₂eq/yr
Show answer (C)
C is correct. CO₂ equivalents = mass of gas × GWP = 200 metric tons × 28 = 5,600 metric tons CO₂eq/yr. A (228) is incorrect because it adds the GWP to the mass rather than multiplying. B (2,800) is incorrect because it appears to use GWP = 14 (half the correct value) or only accounts for half the mass. D (7.14) is incorrect because it divides the mass by the GWP instead of multiplying—a common error where students invert the GWP relationship.

Question 3: INTERMEDIATE

If atmospheric CO₂ rises from 280 ppm to 560 ppm (a doubling), the radiative forcing equation ΔF = 5.35 × ln(C/C₀) predicts a forcing of approximately 3.7 W/m². Using a climate sensitivity parameter of λ = 0.8 °C per W/m², what is the estimated equilibrium temperature increase?
  • A. 1.5 °C
  • B. 3.0 °C
  • C. 4.6 °C
  • D. 7.4 °C
Show answer (B)
B is correct. ΔT = λ × ΔF = 0.8 °C/(W/m²) × 3.7 W/m² ≈ 3.0 °C. This aligns with the IPCC's estimate that equilibrium climate sensitivity (the warming from a CO₂ doubling including feedbacks) is in the range of 2.5–4.0 °C. A (1.5 °C) would result from using a lower sensitivity parameter (~0.4), which does not account for positive feedbacks. C (4.6 °C) results from using λ ≈ 1.24, which overestimates sensitivity. D (7.4 °C) appears to double the forcing value before multiplying, an arithmetic error.

Question 4: APPLIED

4 pts
A research team wants to determine whether increasing atmospheric CO₂ concentrations enhance the rate of photosynthesis in soybean plants and whether this effect is reduced under water-stressed conditions. (a) Identify a testable hypothesis for this investigation. (1 point) (b) Describe the experimental design, including the independent variable, dependent variable, and at least two controlled variables. (1 point) (c) Explain how the experiment should be set up with appropriate treatment groups and replication. (1 point) (d) Describe how the results would be analyzed and what evidence would support or refute the hypothesis. (1 point)
Show answer
Rubric (4 points): (a) Hypothesis (1 point): Award 1 point for a testable hypothesis that links CO₂ concentration to photosynthetic rate with a conditional statement about water availability. Example: 'If atmospheric CO₂ concentration is increased, then soybean photosynthetic rate will increase, but this enhancement will be reduced under water-stressed conditions because stomatal closure limits CO₂ uptake regardless of ambient concentration.' (b) Experimental design (1 point): Award 1 point for correctly identifying: Independent variables: CO₂ concentration (e.g., 400 ppm ambient vs. 800 ppm elevated) and water availability (well-watered vs. drought-stressed). Dependent variable: rate of photosynthesis, measured as net CO₂ uptake (μmol CO₂/m²/s) using infrared gas analysis or as oxygen evolution rate. Controlled variables (at least two): temperature, light intensity, soil type, plant genotype, photoperiod. (c) Treatment groups and replication (1 point): Award 1 point for describing a factorial design with four treatment groups: (1) ambient CO₂ + well-watered, (2) elevated CO₂ + well-watered, (3) ambient CO₂ + water-stressed, (4) elevated CO₂ + water-stressed. Each treatment should include multiple replicates (≥10 plants per group) randomly assigned to minimize confounding variables. (d) Data analysis (1 point): Award 1 point for describing how to compare photosynthetic rates across treatments using appropriate statistical methods (e.g., two-way ANOVA to test for interaction effects). The hypothesis is supported if elevated CO₂ increases photosynthesis under well-watered conditions but the enhancement is significantly smaller under water-stressed conditions (a significant CO₂ × water interaction term). The hypothesis is refuted if elevated CO₂ equally increases photosynthesis regardless of water availability.

Question 5: CRITICAL THINKING

4 pts
A city's transportation sector emits the following greenhouse gases annually: • 800,000 metric tons of CO₂ • 2,000 metric tons of CH₄ (GWP = 28) • 500 metric tons of N₂O (GWP = 265) (a) Calculate the total annual greenhouse gas emissions from the transportation sector in CO₂ equivalents. Show your work. (1 point) (b) Identify which gas, after CO₂, contributes the most to the city's transportation-sector warming impact in CO₂ equivalents, and explain why despite its lower mass emission. (1 point) (c) The city proposes replacing 50% of its diesel bus fleet with electric buses, which is projected to reduce CO₂ emissions by 120,000 metric tons/yr and CH₄ emissions by 400 metric tons/yr. Calculate the new total CO₂ equivalents after implementation. (1 point) (d) Explain one limitation of using the 100-year GWP metric when evaluating the climate impact of reducing CH₄ emissions, and describe how a 20-year GWP framework (CH₄ GWP₂₀ = 84) would change the interpretation of this policy's effectiveness. (1 point)
Show answer
Rubric (4 points): (a) Total CO₂ equivalents (1 point): CO₂: 800,000 metric tons × 1 = 800,000 metric tons CO₂eq. CH₄: 2,000 × 28 = 56,000 metric tons CO₂eq. N₂O: 500 × 265 = 132,500 metric tons CO₂eq. Total = 800,000 + 56,000 + 132,500 = 988,500 metric tons CO₂eq/yr. Award 1 point for correct calculation with work shown. (b) Gas identification and explanation (1 point): N₂O contributes more CO₂ equivalents (132,500) than CH₄ (56,000) despite its lower mass emissions (500 vs. 2,000 metric tons) because N₂O has a much higher GWP (265 vs. 28), meaning each kilogram of N₂O traps far more heat over 100 years due to its greater radiative efficiency and longer atmospheric lifetime (~121 years). Award 1 point for correctly identifying N₂O and explaining the role of GWP. (c) New total after policy (1 point): New CO₂: 800,000 − 120,000 = 680,000 metric tons CO₂eq. New CH₄: (2,000 − 400) × 28 = 1,600 × 28 = 44,800 metric tons CO₂eq. N₂O unchanged: 132,500 metric tons CO₂eq. New total = 680,000 + 44,800 + 132,500 = 857,300 metric tons CO₂eq/yr. Reduction = 988,500 − 857,300 = 131,200 metric tons CO₂eq/yr (~13.3% reduction). Award 1 point for correct calculation. (d) Limitation and reinterpretation (1 point): The 100-year GWP underestimates the near-term warming impact of CH₄ because methane has a short atmospheric lifetime (~12 years) but very strong radiative forcing during that period. Using the 20-year GWP (84 for CH₄), the CH₄ reduction of 400 metric tons would be valued at 400 × 84 = 33,600 metric tons CO₂eq rather than 400 × 28 = 11,200. This triples the apparent benefit of the CH₄ reduction component, making the bus-electrification policy appear more effective in combating near-term warming. Award 1 point for identifying the temporal limitation and correctly applying GWP₂₀.

SUMMARY

Global Climate Change — Summary Review

Summary

Global climate change is driven by the enhanced greenhouse effect, in which anthropogenic emissions of CO₂, CH₄, and N₂O increase the atmosphere's absorption of outgoing infrared radiation, creating a positive radiative forcing that raises global mean surface temperature. The logarithmic relationship ΔF = 5.35 × ln(C/C₀) quantifies CO₂ forcing, and the climate sensitivity parameter (ΔT = λ × ΔF) translates forcing into temperature change. Global Warming Potential (GWP) enables comparison of different greenhouse gases by converting their warming impacts to CO₂ equivalents.

Positive feedback loops—including the ice-albedo feedback and water-vapor feedback—amplify initial warming and may trigger irreversible tipping points such as permafrost thaw or ice-sheet collapse. The dual threats of atmospheric warming and ocean acidification arise from the same root cause: excess CO₂. Addressing climate change requires both mitigation (reducing emissions and enhancing carbon sinks) and adaptation (adjusting systems to cope with changes already in progress). Master these concepts—along with the ability to perform GWP and radiative forcing calculations—and you will be well prepared for both the multiple-choice and free-response sections of the AP exam.

Varsity Tutors • AP Environmental Science • Global Climate Change