

SECTION 1
Historical Context & Motivation
The distinction between species that thrive across many environments and those that excel within narrow conditions has captivated ecologists since the discipline's earliest days. Charles Darwin's observations of finch beak variation on the Galápagos Islands hinted at the idea that organisms evolve to exploit particular resources, yet it was not until the twentieth century that ecologists formalized this pattern into a coherent theoretical framework. The concept of the ecological niche — the full range of biotic and abiotic conditions under which a species can survive and reproduce — became the foundation for classifying organisms along a continuum from generalists to specialists. Understanding where a species falls on this spectrum is critical for predicting its response to habitat loss, climate change, and invasive species.
1859 • Darwin's On the Origin of Species
1927 • Elton Formalizes the Niche Concept
1957 • Hutchinson's Multidimensional Niche
1968 • MacArthur & Levins — Niche Breadth Theory
2000s • Conservation Applications
This historical progression raises a central question in population ecology: Why do some species evolve broad niches while others become exquisitely adapted to narrow sets of conditions, and what are the consequences of each strategy for population persistence? The answer lies in understanding the trade-offs between versatility and efficiency — a theme that runs through every aspect of this lesson.
SECTION 2
Core Principles & Definitions
The generalist–specialist framework rests on several interconnected ecological principles that link an organism's physiology, behavior, and evolutionary history to the breadth of resources it can exploit and the range of habitats it can occupy. These principles help ecologists predict population dynamics, community structure, and conservation outcomes.
Niche Breadth
Trade-Off Hypothesis
Fundamental vs. Realized Niche
Tolerance Range
Competitive Exclusion & Coexistence
KEY TAKEAWAY
SECTION 3
Visual Explanation — Tolerance Curves
The most intuitive way to visualize the difference between generalists and specialists is through tolerance curves (also called performance curves). These bell-shaped graphs plot an organism's ability to survive or reproduce against a gradient of an environmental variable — such as temperature, salinity, or food particle size. A generalist's curve is broad and flat, indicating moderate performance across a wide range of conditions, while a specialist's curve is narrow and tall, indicating superior performance under optimal conditions but rapid decline outside them.
The diagram above illustrates a key ecological trade-off. At the optimum temperature (25 °C), the specialist outperforms the generalist, gaining a competitive edge in stable environments. However, if conditions shift — say, to 10 °C or 40 °C — the specialist's performance plummets while the generalist maintains functionality. This visual encapsulates the core logic behind conservation concerns: environmental change is far more threatening to species with narrow tolerance curves.
SECTION 4
Ecological Mechanisms & Niche Breadth
While the generalist–specialist concept in AP Environmental Science does not rely on heavy mathematical derivation, it is valuable to understand the quantitative tools ecologists use to measure niche breadth and the mechanistic reasons these strategies evolve. The Levins' niche breadth index provides a straightforward way to quantify where a species falls on the generalist–specialist spectrum.
LEVINS' NICHE BREADTH INDEX
Where B = niche breadth (higher values indicate more generalized use of resources), pᵢ = proportion of individuals (or resource use) found in resource category i. When resources are used equally across all categories, B is maximized (generalist). When all use is concentrated in one category, B = 1 (extreme specialist).
Mechanistic Drivers of Niche Strategy
Several evolutionary and ecological mechanisms push a species toward generalism or specialism. Environmental variability is a primary driver: when conditions fluctuate unpredictably, natural selection favors individuals with broad tolerance ranges because they can survive multiple environmental states. Conversely, stable environments favor specialization because organisms that fine-tune their physiology to local conditions achieve higher efficiency and outcompete less optimized rivals. Interspecific competition also plays a key role: in species-rich communities, resource partitioning drives each species toward narrower niches to reduce overlap, resulting in more specialists. Finally, coevolution can lock a species into specialization — for example, a pollinator that evolves a perfectly matched proboscis for a single flower species becomes dependent on that plant's continued existence.
AP EXAM TIP
SECTION 5
Detailed Examples & Classification
Classifying real organisms as generalists or specialists makes the abstract framework concrete and is essential for AP exam success. The table below contrasts well-known examples across several ecological dimensions, and the diagram that follows illustrates how multiple species partition a shared resource gradient.
| Trait Dimension | Generalist Example | Specialist Example |
|---|---|---|
| Diet | Raccoon (Procyon lotor) — omnivore that eats fruits, insects, fish, garbage, and pet food | Giant panda (Ailuropoda melanoleuca) — diet is >99% bamboo |
| Habitat | White-tailed deer (Odocoileus virginianus) — forests, grasslands, suburban areas across North America | Spotted owl (Strix occidentalis) — requires old-growth coniferous forests in the Pacific Northwest |
| Temperature | Coyote (Canis latrans) — thrives from arctic tundra to tropical deserts | Coral (many species) — requires water temperatures of 23–29 °C; bleaches outside this range |
| Symbiosis | Honeybee (Apis mellifera) — pollinates hundreds of plant species | Fig wasp (Agaonidae) — each species pollinates only one species of fig tree |
| Reproductive Strategy | House mouse (Mus musculus) — r-selected traits, many offspring, colonizes diverse habitats | Koala (Phascolarctos cinereus) — K-selected, slow reproduction, dependent on Eucalyptus leaves |
Representative generalist and specialist species across multiple ecological dimensions
In this resource partitioning diagram, each specialist has evolved to exploit a different size class of food particles with high efficiency. The generalist uses all size classes but cannot match any specialist's peak utilization rate within that specialist's preferred range. The areas of overlap between curves represent zones of competitive interaction, which are minimized by character displacement — an evolutionary process in which sympatric species diverge in traits related to resource use to reduce competition.
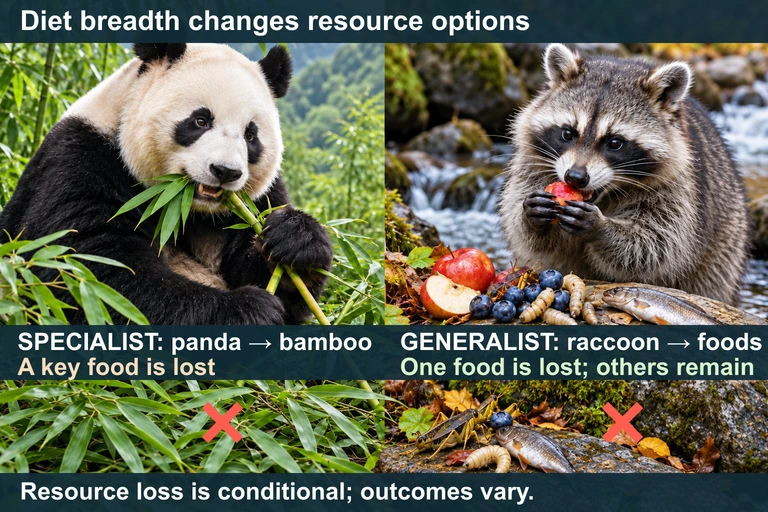 The panda and raccoon examples compare diet breadth. Losing one resource affects a specialist menu differently from a broader menu without proving a universal survival outcome.
SECTION 6
Worked Example — Calculating Niche Breadth
Suppose an ecologist observes two bird species foraging across four habitat types. Species A is found equally across all four habitats, while Species B is concentrated almost entirely in one. We can use Levins' niche breadth index to quantify the difference.
Comparing Niche Breadth for Two Bird Species
- 1
Step 1 — Record Resource Use Proportions
Species A uses four habitat types equally: p₁ = 0.25, p₂ = 0.25, p₃ = 0.25, p₄ = 0.25. Species B is heavily concentrated: p₁ = 0.85, p₂ = 0.05, p₃ = 0.05, p₄ = 0.05. - 2
Step 2 — Calculate Σ pᵢ² for Each Species
Species A: Σ pᵢ² = (0.25)² + (0.25)² + (0.25)² + (0.25)² = 0.0625 × 4 = 0.25. Species B: Σ pᵢ² = (0.85)² + (0.05)² + (0.05)² + (0.05)² = 0.7225 + 0.0025 + 0.0025 + 0.0025 = 0.73. - 3
Step 3 — Compute B = 1 / Σ pᵢ²
Species A: B = 1 / 0.25 = 4.0. Species B: B = 1 / 0.73 ≈ 1.37.Species A (B = 4.0) is a strong generalist; Species B (B ≈ 1.37) is a specialist. - 4
Step 4 — Interpret the Results
Since B ranges from 1 (all resources concentrated in one category) to n (equal use of all n categories), Species A achieves the maximum possible B for four habitats, indicating a perfectly even generalist strategy. Species B's B value of 1.37 is close to the minimum, confirming strong specialization on one habitat type. This difference has direct conservation implications: if habitat type 1 is destroyed, Species B faces a far greater extinction risk than Species A.
SECTION 7
Strengths & Vulnerabilities Compared
Neither the generalist nor the specialist strategy is inherently superior; each confers advantages and disadvantages depending on ecological context. The following comparison highlights the conditions under which each strategy thrives or falters, which is essential knowledge for both the AP exam and real-world conservation planning.
| Criterion | Generalist | Specialist |
|---|---|---|
| Stability in fluctuating environments | High — can switch resources or habitats as conditions change | Low — population declines rapidly if key resource is lost |
| Competitive ability in stable environments | Lower — outcompeted by specialists for specific resources | Higher — superior efficiency within narrow niche |
| Geographic range | Typically broad (e.g., coyote, raccoon) | Typically restricted (e.g., koala, coral) |
| Response to habitat fragmentation | More resilient — can use multiple habitat types in fragmented landscapes | Highly vulnerable — fragments may lack critical resources |
| Response to invasive species | May coexist or adapt diet/behavior | Especially vulnerable if invader competes for the same narrow resource |
| Extinction risk under climate change | Lower — broad thermal and dietary tolerances buffer change | Higher — narrow thermal tolerances mean even small shifts can be lethal |
Comparison of generalist and specialist strengths and vulnerabilities
KEY TAKEAWAY
SECTION 8
Connections to Island Biogeography & Conservation Biology
The generalist–specialist concept intersects with several advanced ecological theories that appear on the AP Environmental Science exam, particularly the theory of island biogeography, r/K selection theory, and keystone species dynamics. Understanding how these frameworks overlap deepens your ability to answer integrative free-response questions.
| Concept | Generalist Connection | Specialist Connection |
|---|---|---|
| Island Biogeography | Generalists colonize islands more readily because they can exploit whatever resources are available, contributing to higher immigration rates | Specialists face higher extinction rates on islands because small area reduces the probability of containing their required resources |
| r/K Selection | Many generalists exhibit r-selected traits: rapid reproduction, small body size, and high dispersal ability (e.g., cockroaches, rats) | Many specialists exhibit K-selected traits: long lifespan, low fecundity, and high parental investment (e.g., pandas, orangutans) |
| Keystone Species | Generalist predators (e.g., sea otters) can regulate multiple prey species, maintaining community diversity | Specialist pollinators (e.g., fig wasps) can be keystone mutualists — their loss eliminates an entire plant species and its dependent food web |
| Endangered Species Act (ESA) | Generalists are rarely listed because large, flexible populations resist decline | Specialists are disproportionately represented on endangered species lists because narrow niches make them vulnerable to anthropogenic disturbance |
Connections between the generalist–specialist framework and other AP Environmental Science topics
As you progress through the AP Environmental Science curriculum, look for opportunities to apply the generalist–specialist lens to new topics. For example, when studying biodiversity hotspots, recognize that these regions often harbor a disproportionate number of endemic specialists whose narrow ranges coincide with specific climatic or geological conditions. Similarly, when analyzing the impacts of deforestation or urbanization, consider how habitat loss differentially affects species with broad versus narrow niches — this type of integrative reasoning earns top scores on the free-response section.
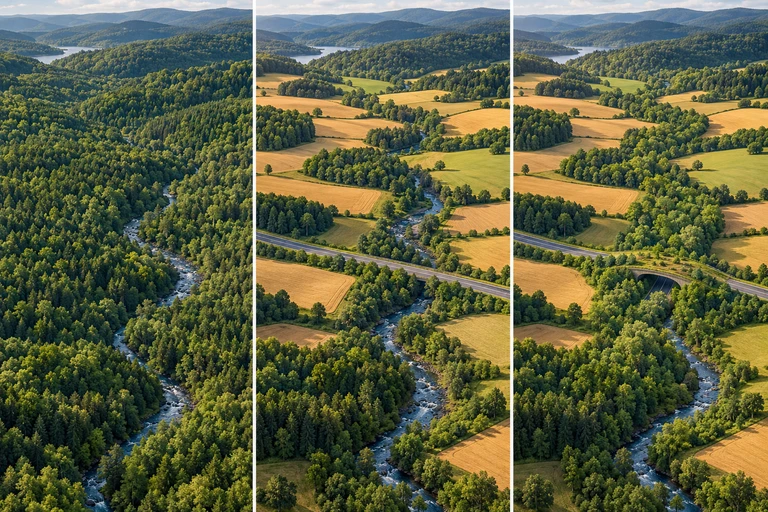 A pine specialist needs suitable habitat structure and resources along a route. A narrow strip of young trees can differ from a corridor containing mature cavity resources and suitable understory.
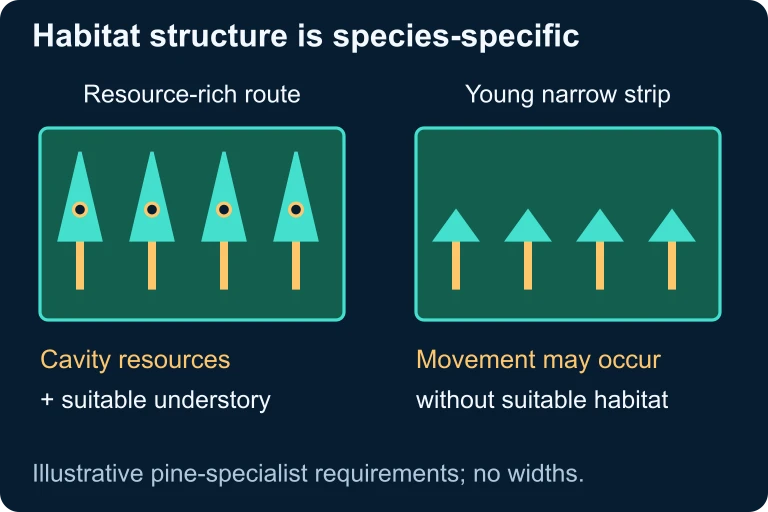 A habitat route must supply the structures and resources needed by the specialist. Compare a mature, resource-rich corridor with a narrow strip of young trees.
SECTION 9
Practice Problems
Question 1: CONCEPTUAL
- A. The warbler is a generalist because it has a highly specialized foraging technique.
- B. The crow is a specialist because it can exploit many different food sources.
- C. The warbler is a specialist with a narrow niche breadth, and the crow is a generalist with a wide niche breadth.
- D. Both species are generalists because both consume insects as part of their diet.
Show answer (C)
Question 2: BASIC CALCULATION
- A. B ≈ 2.17; moderate specialist leaning toward one habitat
- B. B = 3.00; perfect generalist across all three habitats
- C. B = 1.00; extreme specialist using only one habitat
- D. B ≈ 0.46; specialist with extremely narrow niche breadth
Show answer (A)
Question 3: INTERMEDIATE
- A. Species X, because it depends on more plant species that could be disrupted
- B. Species Y, because its narrow niche dependence on interior-dwelling orchids makes it vulnerable to interior habitat disturbance
- C. Both species equally, because selective logging affects all pollinators to the same degree
- D. Species Y, because generalists always outcompete specialists regardless of disturbance type
Show answer (B)
Question 4: APPLIED
4 ptsShow answer
Question 5: CRITICAL THINKING
6 ptsShow answer
SUMMARY
Lesson Summary
Summary
Generalist species possess a wide niche breadth, enabling them to exploit diverse resources and tolerate a broad range of environmental conditions — think of raccoons, coyotes, and crows. Specialist species occupy a narrow niche breadth, achieving superior efficiency within tightly defined conditions but facing high vulnerability to change — think of giant pandas, koalas, and coral. The trade-off hypothesis explains why both strategies persist: generalists sacrifice peak performance for flexibility, while specialists sacrifice flexibility for peak performance.
Quantitatively, Levins' niche breadth index (B = 1 / Σ pᵢ²) measures where a species falls on the generalist–specialist continuum. Visually, tolerance curves reveal this difference: broad, flat curves for generalists and narrow, tall curves for specialists. For conservation, specialists face disproportionately higher extinction risk from habitat fragmentation, climate change, and invasive species because they cannot easily switch resources or relocate. This framework connects directly to island biogeography, r/K selection, and keystone species dynamics — integrative connections that strengthen your performance on AP free-response questions.