AP Environmental Science • Energy Resources and Consumption

Fossil Fuels

Understanding the formation, extraction, environmental impacts, and future of coal, oil, and natural gas.

A sprouting plant framed by Earth and recycling symbols.
Inside this lesson 10 sections 5 questions 8 figures

SECTION 1

Historical Context & Motivation

The story of human civilization over the past three centuries is inseparable from the story of fossil fuels—the carbon-rich deposits of ancient organic matter that power the overwhelming majority of the global economy. Before the widespread adoption of coal in the eighteenth century, human societies relied on biomass (wood, peat, animal dung) and animal labor for energy, which placed hard limits on industrial output and population growth. The shift to fossil fuels unlocked energy densities orders of magnitude greater than biomass, catalyzing the Industrial Revolution and reshaping every dimension of modern life, from agriculture to transportation to geopolitics.

1760s • Coal Powers the Industrial Revolution

James Watt's improved steam engine dramatically increases coal consumption across Britain, replacing water wheels and wood-fired systems in manufacturing and transport.

1859 • Drake's Oil Well in Pennsylvania

Edwin Drake drills the first commercially successful oil well in Titusville, Pennsylvania, launching the petroleum industry that would come to dominate the twentieth century.

1950s • Natural Gas Infrastructure Expands

Post-WWII pipeline construction enables widespread use of natural gas for residential heating, electricity generation, and industrial feedstock across North America and Europe.

1988 • IPCC Established

The Intergovernmental Panel on Climate Change is founded, formalizing scientific concern over greenhouse gas emissions from fossil fuel combustion and their role in global warming.

2015 • Paris Agreement

Nearly 200 nations adopt the Paris Agreement, committing to limit global temperature rise to well below 2 °C—an implicit acknowledgment that fossil fuel dependence must decline.

Today, fossil fuels still supply roughly 80 % of global primary energy, yet their environmental costs—climate change, air pollution, water contamination, and habitat destruction—are driving an urgent reevaluation of energy systems worldwide. The central question for AP Environmental Science is straightforward but far-reaching: how do fossil fuels form, how do we extract and use them, what environmental consequences follow, and what alternatives exist?

SECTION 2

Core Principles & Definitions

Fossil fuels are nonrenewable energy resources derived from the remains of ancient organisms that were buried under sediment and subjected to intense heat and pressure over millions of years. Because their formation timescale (tens to hundreds of millions of years) dwarfs the rate at which humans consume them, they are classified as finite resources. The three major types—coal, petroleum (crude oil), and natural gas—differ in their physical state, chemical composition, energy density, and the environmental impacts associated with their extraction and combustion.

1

Coal

A solid fossil fuel formed from ancient plant matter (primarily ferns and swamp vegetation) compressed in anaerobic conditions. Ranked by carbon content: lignite → sub-bituminous → bituminous → anthracite. Coal combustion is the single largest source of CO₂ emissions from electricity generation.
2

Petroleum (Crude Oil)

A liquid fossil fuel originating from marine microorganisms (plankton, algae) deposited in ocean sediments. After refining, crude oil yields gasoline, diesel, jet fuel, and petrochemical feedstocks. It dominates the transportation sector worldwide.
3

Natural Gas

A gaseous fuel composed primarily of methane (CH₄), often found alongside petroleum deposits or in shale formations. It burns cleaner than coal or oil per unit of energy, producing roughly half the CO₂ of coal per kWh of electricity generated.
4

Energy Density

Fossil fuels store large amounts of chemical energy per unit mass (e.g., ≈ 46 MJ/kg for gasoline), making them efficient to transport and store—a key reason alternatives have been slow to displace them in sectors like aviation and shipping.
5

Nonrenewable Classification

Because fossil fuels require geological timescales to form, they cannot be replenished within a human lifetime. Current reserves are finite, and extraction rates for conventional deposits are projected to peak and decline, a concept known as peak production.
✦

KEY TAKEAWAY

Think of fossil fuels as a geological savings account that took hundreds of millions of years to accumulate. Modern industrial society is withdrawing from this account at a rate roughly one million times faster than deposits are made. Just as overdrawing a bank account leads to a deficit, rapidly depleting fossil fuel reserves while emitting their stored carbon produces an atmospheric carbon deficit that Earth's natural sinks (oceans, forests, soils) cannot balance on any human-relevant timescale.

SECTION 3

Visual Explanation — Formation of Fossil Fuels

Formation of Fossil Fuels Over Geological TimeStage 1Organism Accumulation~300 Mya (Coal)~150 Mya (Oil/Gas)Dead plants/marineorganisms settle inanaerobic environmentsStage 2Burial & CompressionSediment layers buildIncreasing pressurefrom overlying rockcompresses organicmaterial → kerogenStage 3Heat & Pressure TransformDiagenesis / CatagenesisKerogen transforms intocoal (from plant matter)or oil & gas (frommarine organisms)Resulting Fossil Fuel TypesCOALSolid • Plant origin~24 MJ/kg (bituminous)Highest CO₂ per kWhPETROLEUMLiquid • Marine origin~46 MJ/kg (gasoline)Dominates transportNATURAL GASGas • Mixed origin~55 MJ/kg (methane)Lowest CO₂ of the threeKey Conditions for Formation⏱ Millions of years🔥 High temperature⬇ High pressureAnaerobic conditions prevent complete decomposition of organic matter
This diagram illustrates the three-stage formation process shared by all fossil fuels: accumulation of organic material under anaerobic conditions, burial and compression under sedimentary layers, and thermal transformation (diagenesis and catagenesis) into coal, petroleum, or natural gas depending on the source organisms and geological conditions.

The formation pathway diverges depending on the source material. Terrestrial plants in swampy, oxygen-poor environments—predominantly during the Carboniferous period (approximately 360–300 million years ago)—gradually transformed into peat, then lignite, then bituminous coal, and ultimately anthracite as heat and pressure increased with deeper burial. Marine microorganisms (plankton and algae) that settled on ocean floors followed a parallel but distinct path, first becoming kerogen within source rock, and then cracking into liquid hydrocarbons (petroleum) and gaseous hydrocarbons (natural gas) as temperatures rose. The geological window in which oil forms—roughly 60–160 °C—is sometimes called the oil window; above this range, only natural gas is generated.
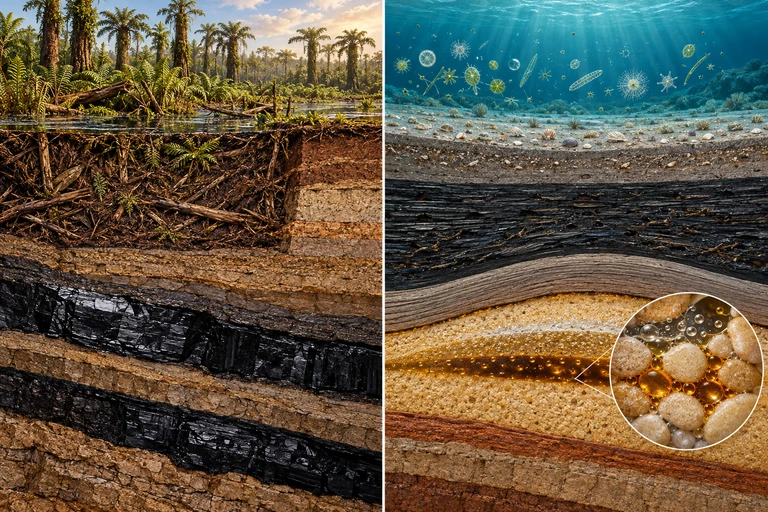
A swamp/coal section and marine petroleum section remain separate. The exact diagram distinguishes coal rank progression from source shale, migration, cap rock and pore-hosted reservoir fluids.Plant-rich peat can progress through coal ranks with burial and heating. Organic-rich aquatic sediment can instead form source-rock kerogen that generates oil and gas, which may migrate into porous reservoir rock beneath a seal.
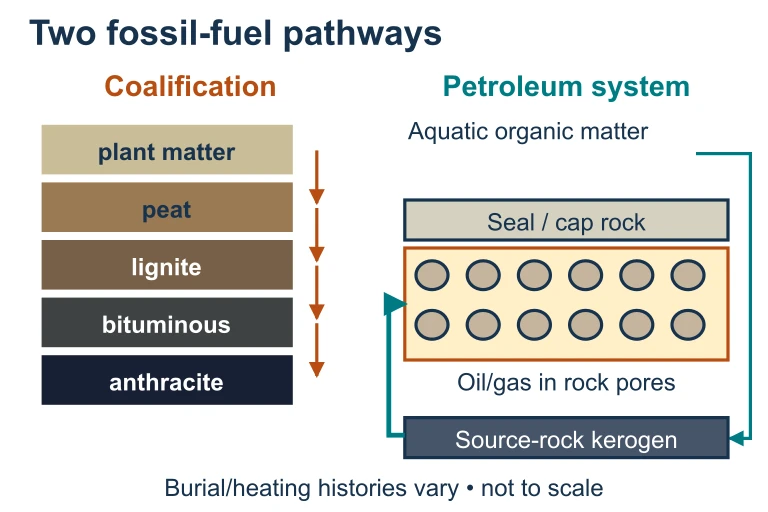
Distinct coal and petroleum formation. Plant-rich peat can progress through coal ranks with burial and heating. Organic-rich aquatic sediment can instead form source-rock kerogen that generates oil and gas, which may migrate into porous reservoir rock beneath a seal.Plant-rich peat can progress through coal ranks with burial and heating. Organic-rich aquatic sediment can instead form source-rock kerogen that generates oil and gas, which may migrate into porous reservoir rock beneath a seal.

SECTION 4

Combustion Chemistry & Energy Calculations

The utility of fossil fuels lies in the exothermic combustion of hydrocarbons. When a hydrocarbon reacts with oxygen, the products are carbon dioxide, water vapor, and heat energy. Understanding the stoichiometry of these reactions allows us to calculate both the energy yield and the carbon emissions per unit of fuel consumed—a critical skill for the AP exam.

METHANE COMBUSTION

CH4+2O2→CO2+2H2O+890kJ/molCH₄ + 2O₂ → CO₂ + 2H₂O + 890 kJ/mol

CH₄ = methane (primary component of natural gas); O₂ = molecular oxygen; CO₂ = carbon dioxide (greenhouse gas); 890 kJ/mol = energy released per mole of methane combusted.

OCTANE COMBUSTION (GASOLINE PROXY)

2C8H18+25O2→16CO2+18H2O+10,940kJ2C₈H₁₈ + 25O₂ → 16CO₂ + 18H₂O + 10,940 kJ

C₈H₁₈ = octane, commonly used as a representative molecule for gasoline. Note that 16 moles of CO₂ are produced for every 2 moles of octane, illustrating petroleum's significant carbon footprint per unit burned.

COAL COMBUSTION (SIMPLIFIED)

C+O2→CO2+393.5kJ/molC + O₂ → CO₂ + 393.5 kJ/mol

Pure carbon combustion represents anthracite coal. Real coal contains impurities (sulfur, mercury, particulates) that produce SO₂, NOx, and ash during burning.

CO₂ EMISSIONS CALCULATION

CO2emitted(kg)=Fuelconsumed(kg)×Carbonfraction×(44/12)CO₂ emitted (kg) = Fuel consumed (kg) × Carbon fraction × (44/12)

The factor 44/12 converts mass of carbon to mass of CO₂ (molecular weight ratio: CO₂ = 44 g/mol, C = 12 g/mol). Carbon fraction varies by fuel: coal ≈ 0.75–0.90, petroleum ≈ 0.85, natural gas ≈ 0.75.

A critical concept for exam preparation is the carbon-to-energy ratio. Natural gas produces approximately 53 kg of CO₂ per million BTU of energy, while coal produces roughly 95 kg per million BTU—nearly twice as much. This disparity explains why the shift from coal to natural gas for electricity generation has reduced emissions in some countries, though it is important to note that methane leakage during natural gas extraction can offset a significant portion of this advantage because methane's global warming potential (GWP) is roughly 80 times that of CO₂ over a 20-year horizon.

SECTION 5

Extraction Methods & Environmental Impacts

Fossil fuel extraction involves a range of techniques, each with distinct environmental consequences. Understanding these methods and their trade-offs is essential for the APES exam, particularly in free-response questions that ask students to evaluate environmental proposals or design investigations related to energy development.

Fossil Fuel Extraction Methods & Environmental ImpactsCOAL MININGSurface Mining• Strip mining• Mountaintop removalSubsurface Mining• Shaft/tunnel miningImpacts:Habitat destruction, AMD,erosion, lung diseaseOIL EXTRACTIONConventional Drilling• Onshore / offshore rigs• Primary/secondary recoveryUnconventional• Tar sands / oil shaleImpacts:Spills, water pollution,deforestation (tar sands)NATURAL GASConventional Wells• Vertical drilling• Associated gas from oilHydraulic Fracturing• Horizontal drilling + frackingImpacts:Methane leaks, water use,induced seismicity, contaminationEnvironmental Impact Spectrum by Fuel TypeCO₂ emissions/kWhCoal: ~1.0 kgOil: ~0.7 kgGas: ~0.4 kgAir pollutantsCoal: SO₂, NOₓ, PM, Hg, ashOil: NOₓ, VOCs, CO, PMGas: NOₓ (minimal SO₂, PM)Water impactsCoal: acid mine drainage (AMD), thermal pollution, coal ash pondsOil: spills, produced water disposal | Gas: fracking wastewater, aquifer risk
This diagram compares the three major fossil fuel extraction methods and their associated environmental impacts. Note the relative CO₂ emissions per kWh (horizontal bars), the range of air pollutants, and the distinct water impact profiles for each fuel type. These comparisons frequently appear in APES free-response questions.

Mountaintop removal mining involves blasting away the summit of a mountain to expose coal seams beneath, depositing the resulting rubble ("overburden") into adjacent valleys. This practice destroys entire ecosystems, buries headwater streams, increases flooding risk, and introduces heavy metals into watersheds. Hydraulic fracturing (fracking) involves injecting high-pressure fluid—water mixed with sand and chemical additives—into shale formations to fracture the rock and release trapped natural gas or oil. While fracking has expanded U.S. energy production dramatically, concerns about groundwater contamination, induced seismicity, and methane fugitive emissions remain active areas of scientific study and regulatory debate.

💡

EXAM TIP

The AP exam frequently asks about acid mine drainage (AMD)—the process by which exposed sulfide minerals in coal mines oxidize and produce sulfuric acid, which leaches heavy metals into streams. Know that AMD can persist for decades after a mine closes and that it lowers water pH, harming aquatic organisms.

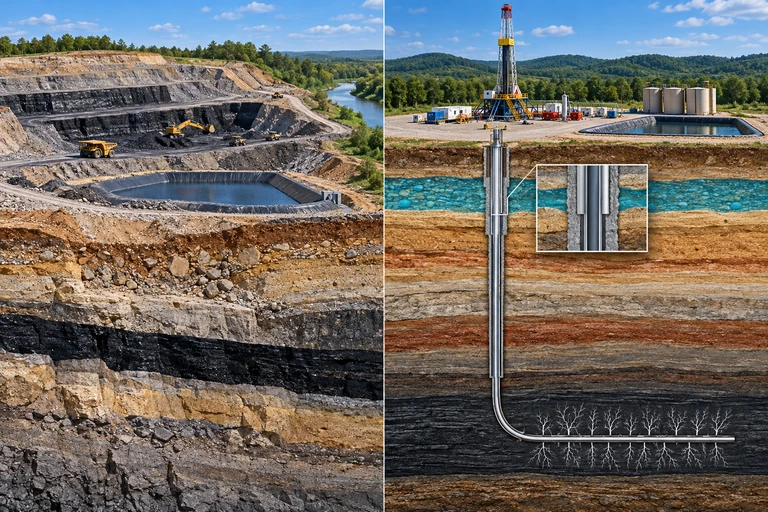
A surface mine and cased horizontal shale well appear side by side. The exact section separates shallow aquifer, deep fractures, intact casing and conditional surface or casing-failure routes.Surface mining can expose sulfides to oxygen and water, enabling acid generation. At a shale well, surface spills and failures of casing or cement create distinct potential contamination pathways.
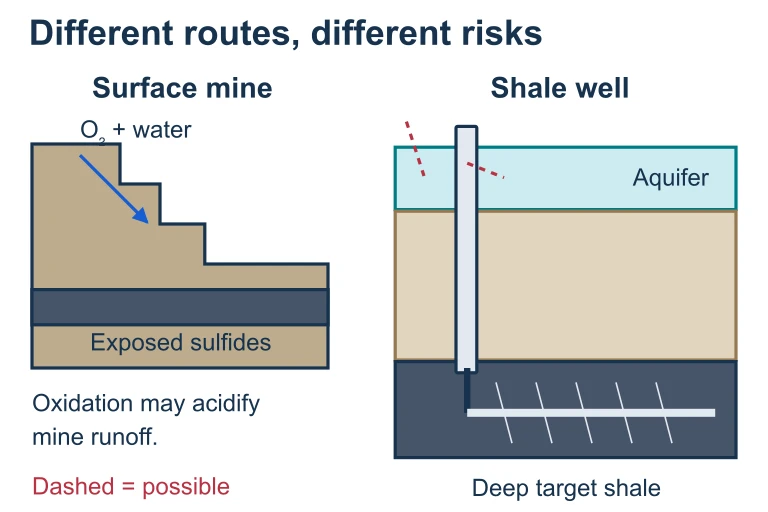
Conditional extraction pathways. Surface mining can expose sulfides to oxygen and water, enabling acid generation. At a shale well, surface spills and failures of casing or cement create distinct potential contamination pathways.Surface mining can expose sulfides to oxygen and water, enabling acid generation. At a shale well, surface spills and failures of casing or cement create distinct potential contamination pathways.

SECTION 6

Worked Example — Calculating CO₂ Emissions

A common APES calculation involves determining how much CO₂ is released from burning a given quantity of fossil fuel. Let's work through a multi-step problem that mirrors what you might encounter on the exam.

CO₂ Emissions from a Coal-Fired Power Plant

  1. 1

    Step 1 — Identify Given Values

    A coal-fired power plant burns 5,000 metric tons of bituminous coal per day. Bituminous coal has a carbon content of approximately 75 % (carbon fraction = 0.75). We need to determine the daily CO₂ emissions in metric tons.
  2. 2

    Step 2 — Calculate Mass of Carbon

    Mass of carbon = mass of coal × carbon fraction = 5,000 metric tons × 0.75
    Mass of carbon = 3,750 metric tons
  3. 3

    Step 3 — Convert Carbon Mass to CO₂ Mass

    Each atom of carbon (atomic mass 12) combines with two oxygen atoms (total atomic mass 32) to form CO₂ (molecular mass 44). Therefore: CO₂ emitted = mass of carbon × (44/12) = 3,750 × 3.667
    CO₂ emitted ≈ 13,750 metric tons per day
  4. 4

    Step 4 — Annualize the Result

    Annual CO₂ = 13,750 metric tons/day × 365 days/year
    Annual CO₂ ≈ 5,018,750 metric tons/year (≈ 5.0 million metric tons)
  5. 5

    Step 5 — Interpret the Result

    This single power plant produces roughly 5 million metric tons of CO₂ annually. For context, total U.S. CO₂ emissions from energy are approximately 5 billion metric tons per year, so a single large coal plant can account for about 0.1 % of national emissions. This calculation also demonstrates why switching fuel sources matters: the same energy output from natural gas would produce roughly half the CO₂.

SECTION 7

Comparing Fossil Fuels — Advantages & Disadvantages

CriterionCoalPetroleumNatural Gas
Energy density~24 MJ/kg (bituminous)~46 MJ/kg (gasoline)~55 MJ/kg (methane)
CO₂ per kWh (electricity)~1.0 kg~0.7 kg~0.4 kg
Primary useElectricity generation, steel productionTransportation, petrochemicalsElectricity, heating, industrial
Key air pollutantsSO₂, NOₓ, PM₂.₅, Hg, CO₂NOₓ, VOCs, CO, PM, CO₂NOₓ, CO₂ (minimal SO₂/PM)
Water impactsAMD, thermal pollution, ash pondsOil spills, produced waterFracking wastewater, aquifer risk
Land impactsMountaintop removal, subsidenceTar sands deforestation, pipeline ROWWell pads, pipeline fragmentation
AdvantagesAbundant reserves, low cost, reliable baseloadHigh energy density, portable, existing infrastructureCleanest-burning fossil fuel, flexible generation

Comparative analysis of the three major fossil fuels across key environmental and practical criteria

✦

KEY TAKEAWAY

No fossil fuel is "clean"—the comparison is one of relative harm. Think of it like choosing a mode of transport for a toxic cargo: a tanker truck, a train, and a pipeline each have different risk profiles, but all carry the same fundamental hazard. Natural gas is often framed as a bridge fuel because it emits less CO₂ per unit of energy than coal or oil, but its value as a climate solution depends critically on controlling methane leakage throughout the supply chain. If the leak rate exceeds roughly 3 %, the climate advantage over coal largely vanishes.

SECTION 8

Policy Approaches & the Energy Transition

The environmental challenges posed by fossil fuels have generated a wide range of policy responses, from market-based mechanisms to direct regulation. Understanding these instruments is important for APES free-response questions that require you to propose or evaluate solutions to environmental problems. The table below contrasts current fossil fuel policy tools with emerging strategies associated with the broader energy transition.

Current Policy ToolsEmerging/Future Strategies
Clean Air Act regulations — limit SO₂, NOₓ, PM, Hg from power plantsCarbon capture & storage (CCS) — capture CO₂ at point sources, store underground
Cap-and-trade systems — set emissions caps, allow trading of permitsCarbon tax — price carbon directly to internalize external costs
CAFE standards — fuel efficiency mandates for vehiclesElectrification of transport — EVs powered by renewable grid electricity
Reclamation laws (SMCRA) — require restoration of mined landJust transition programs — retraining and economic support for fossil fuel communities

Current regulatory tools vs. emerging strategies in the fossil fuel energy transition

Looking ahead, the question is not whether a transition away from fossil fuel dominance will occur, but how quickly and equitably it will unfold. The concept of Hubbert's peak—the point at which the rate of extraction of a finite resource reaches a maximum before declining—applies not just to individual oil fields but to national and global production curves. Whether peak oil will be driven by geology (depletion of accessible reserves) or by policy (reduced demand due to climate action and renewable energy adoption) remains one of the defining questions of twenty-first-century energy systems. For APES, it is essential to understand that externalities—the environmental and health costs not reflected in the market price of fossil fuels—are central to the economic argument for transitioning to cleaner energy sources. When these externalities are internalized through carbon pricing, fossil fuels become significantly less competitive relative to wind, solar, and other renewables.

SECTION 9

Practice Problems

Question 1: CONCEPTUAL

Which of the following best explains why fossil fuels are classified as nonrenewable resources?
  • A. Fossil fuels produce greenhouse gases when combusted, making them environmentally unsustainable.
  • B. The geological processes that form fossil fuels require millions of years, far exceeding the rate at which humans consume them.
  • C. Fossil fuels can only be extracted from a limited number of countries, restricting global supply.
  • D. The technology to extract fossil fuels has not improved significantly over the past century.
Show answer (B)
B is correct. The defining characteristic of a nonrenewable resource is that its formation rate is negligible relative to the rate of human consumption. Fossil fuels require tens to hundreds of millions of years of geological processing, making replenishment on human timescales impossible. A is incorrect because environmental unsustainability relates to impacts of use, not the reason for the nonrenewable classification. C is incorrect because geographic distribution does not determine renewability—some nonrenewable resources are widely distributed. D is incorrect because extraction technology has actually improved dramatically (e.g., fracking, deepwater drilling), which does not change the fundamental formation rate.

Question 2: BASIC CALCULATION

A household consumes 1,200 gallons of heating oil per winter. If each gallon of heating oil produces approximately 10.2 kg of CO₂ when burned, what are the total CO₂ emissions from this household's winter heating, in metric tons?
  • A. 1.22 metric tons
  • B. 12.24 metric tons
  • C. 122.4 metric tons
  • D. 1,224 metric tons
Show answer (B)
B is correct. CO₂ = 1,200 gallons × 10.2 kg/gallon = 12,240 kg. Since 1 metric ton = 1,000 kg, the result is 12,240 ÷ 1,000 = 12.24 metric tons. A (1.22) results from an error in decimal placement (dividing by 10,000 instead of 1,000). C (122.4) results from failing to convert from kg to metric tons properly (multiplying by 0.1 instead of dividing by 1,000, or equivalently, using a wrong conversion). D (1,224) would result from not converting kg to metric tons at all and then making an additional multiplication error.

Question 3: INTERMEDIATE

A region is considering replacing a 500-MW coal-fired power plant with a natural gas combined-cycle plant of the same capacity. The coal plant emits 1.0 kg CO₂/kWh and operates at a 70 % capacity factor. The natural gas plant would emit 0.4 kg CO₂/kWh at the same capacity factor. By how many metric tons would annual CO₂ emissions decrease if the switch is made? (Assume 8,760 hours/year.)
  • A. 1.84 × 10⁶ metric tons
  • B. 3.07 × 10⁶ metric tons
  • C. 1.23 × 10⁶ metric tons
  • D. 2.63 × 10⁶ metric tons
Show answer (A)
A is correct. Annual electricity generation = 500,000 kW × 8,760 h/yr × 0.70 = 3.066 × 10⁹ kWh. Coal CO₂ = 3.066 × 10⁹ kWh × 1.0 kg/kWh = 3.066 × 10⁹ kg. Gas CO₂ = 3.066 × 10⁹ kWh × 0.4 kg/kWh = 1.226 × 10⁹ kg. Reduction = (3.066 − 1.226) × 10⁹ kg = 1.84 × 10⁹ kg = 1.84 × 10⁶ metric tons. B (3.07 × 10⁶) represents the coal plant's total emissions, not the reduction. C (1.23 × 10⁶) represents the gas plant's remaining emissions, not the reduction. D (2.63 × 10⁶) would result from using a 100 % capacity factor for coal but 70 % for gas, an inconsistent approach.

Question 4: APPLIED

4 pts
A team of environmental scientists suspects that hydraulic fracturing (fracking) operations in a rural county are contaminating residential well water with methane. Design an investigation to test this hypothesis. (a) State a testable hypothesis. (1 point) (b) Describe the experimental setup, including identification of treatment and control groups. (1 point) (c) Identify two variables that should be controlled (held constant) and explain why. (1 point) (d) Describe how the data collected would support or refute the hypothesis. (1 point)
Show answer
RUBRIC (4 points): (a) 1 point — Testable hypothesis: "Residential wells located within 1 km of active fracking sites will have significantly higher dissolved methane concentrations than wells located more than 5 km from any fracking activity." The hypothesis must include a measurable variable (dissolved methane concentration) and a comparison between proximity groups. (b) 1 point — Experimental setup: The treatment group consists of water samples collected from residential wells within 1 km of active fracking sites (minimum 15–20 wells for statistical power). The control group consists of water samples from wells of similar depth and geological formation located more than 5 km from any fracking operation in the same county. Samples should be collected at multiple time points (e.g., monthly over 12 months) using standardized protocols. Dissolved methane is measured using gas chromatography. (c) 1 point — Controlled variables (any two with justification): (1) Well depth — wells of different depths may tap different aquifers with naturally different methane levels; controlling for depth ensures differences are attributable to fracking proximity, not aquifer variation. (2) Geological formation — the underlying rock type affects baseline methane presence; sampling from the same formation ensures comparability. Other acceptable answers: season of sampling, sampling methodology, lab analysis protocol. (d) 1 point — Data interpretation: If the mean dissolved methane concentration in wells near fracking sites is statistically significantly higher (e.g., using a t-test, p < 0.05) than in control wells, the data support the hypothesis. If there is no statistically significant difference, the hypothesis is refuted. Additionally, isotopic analysis of the methane (δ¹³C signature) could distinguish thermogenic methane (from deep shale, indicative of fracking-related migration) from biogenic methane (from shallow microbial activity), strengthening causal inference.

Question 5: CRITICAL THINKING

4 pts
The table below shows data for a country's electricity generation in 2020: Source | Generation (TWh) | CO₂ intensity (kg CO₂/kWh) Coal | 800 | 1.00 Natural Gas | 600 | 0.40 Renewables | 400 | 0.00 (a) Calculate the total CO₂ emissions (in metric tons) from electricity generation in 2020. Show your work. (1 point) (b) The country proposes to retire 200 TWh of coal capacity and replace it with 100 TWh of natural gas and 100 TWh of renewables by 2030. Calculate the projected total CO₂ emissions after this change. (1 point) (c) Calculate the percentage reduction in CO₂ emissions resulting from the proposed change. (1 point) (d) A critic argues this plan is insufficient to meet a 50 % emissions reduction target. Using your calculations, evaluate this claim and propose one additional policy measure that could help achieve the target. (1 point)
Show answer
RUBRIC (4 points): (a) 1 point — Total 2020 CO₂ emissions: Coal: 800 TWh × 10⁹ kWh/TWh × 1.00 kg/kWh = 800 × 10⁹ kg = 800 million metric tons. Gas: 600 × 10⁹ × 0.40 = 240 × 10⁹ kg = 240 million metric tons. Renewables: 0. Total = 800 + 240 = 1,040 million metric tons (1.04 × 10⁹ metric tons). (b) 1 point — Projected emissions after change: New coal generation = 800 − 200 = 600 TWh → 600 million metric tons. New gas generation = 600 + 100 = 700 TWh → 700 × 0.40 = 280 million metric tons. New renewables = 400 + 100 = 500 TWh → 0. Total = 600 + 280 = 880 million metric tons. (c) 1 point — Percentage reduction: (1,040 − 880) / 1,040 × 100 = 160/1,040 × 100 ≈ 15.4 %. The proposed switch reduces emissions by approximately 15.4 %. (d) 1 point — Evaluation and policy proposal: The critic's claim is supported by the data. A 50 % reduction target requires emissions to fall to 520 million metric tons, but the plan only achieves 880 million metric tons—still 360 million metric tons above the target. The 15.4 % reduction falls far short of 50 %. One effective additional policy measure would be implementing a carbon tax (e.g., $50–$100 per metric ton of CO₂) that would accelerate the retirement of remaining coal plants and incentivize further investment in renewable energy, energy efficiency improvements, and demand reduction. Alternative acceptable answers include: mandating carbon capture on remaining coal plants, expanding renewable portfolio standards, or investing in grid-scale energy storage to enable higher renewable penetration.

SUMMARY

Fossil Fuels — Summary

Summary

Fossil fuels—coal, petroleum, and natural gas—are nonrenewable energy resources formed over millions of years from ancient organic matter subjected to heat and pressure under anaerobic conditions. Coal originates from terrestrial plant material (primarily during the Carboniferous period), while petroleum and natural gas derive from marine microorganisms that pass through the kerogen stage before cracking into hydrocarbons within the oil window (60–160 °C). These fuels dominate global energy supply (~80 %) due to their high energy density and established infrastructure.

Extraction methods—surface and subsurface mining (coal), conventional drilling and tar sands extraction (oil), and hydraulic fracturing (gas)—each produce distinct environmental impacts, from acid mine drainage to oil spills to groundwater contamination. Combustion releases CO₂ (the primary greenhouse gas driving climate change) along with SO₂, NOₓ, particulate matter, and mercury. Policy tools such as cap-and-trade, carbon taxes, and carbon capture and storage aim to mitigate these impacts. Calculations using the CO₂ emissions formula (fuel mass × carbon fraction × 44/12) and the carbon-to-energy ratio are essential tools for quantifying environmental impacts on the AP exam.

Varsity Tutors • AP Environmental Science • Fossil Fuels