

SECTION 1
Historical Context & Motivation
Long before ecology emerged as a formal discipline, naturalists recognized that organisms depend on one another for sustenance. The earliest attempts to map these dependencies can be traced to the work of Al-Jahiz, a ninth-century Arab scholar who described chains of consumption among animals. However, it was not until the twentieth century that scientists formalized these observations into the conceptual frameworks of food chains and food webs. These models addressed a fundamental ecological question: how does energy captured by photosynthetic organisms propagate through an ecosystem, and what structural patterns govern the transfer of that energy among species?
1927 • Elton's Food Chains
1942 • Lindeman's Trophic Dynamics
1958 • Odum's Energy Flow Model
1966 • Paine's Keystone Species
These pioneering contributions established a central question that remains at the heart of ecosystem ecology: how much energy is available at each trophic level, and how do the interconnections among species determine ecosystem resilience? Answering these questions requires understanding both the linear simplicity of food chains and the branching complexity of food webs—frameworks that the AP Environmental Science curriculum treats as essential tools for analyzing ecosystem structure and predicting the effects of disturbance.
SECTION 2
Core Principles & Definitions
To analyze energy flow through an ecosystem, ecologists organize organisms into trophic levels—feeding positions defined by the number of energy-transfer steps separating an organism from the ecosystem's primary energy source. Each transfer involves metabolic losses, which impose fundamental constraints on ecosystem structure and the abundance of organisms at higher trophic levels.
Producers (Autotrophs)
Primary Consumers (Herbivores)
Secondary & Tertiary Consumers
Decomposers & Detritivores
Food Chain vs. Food Web
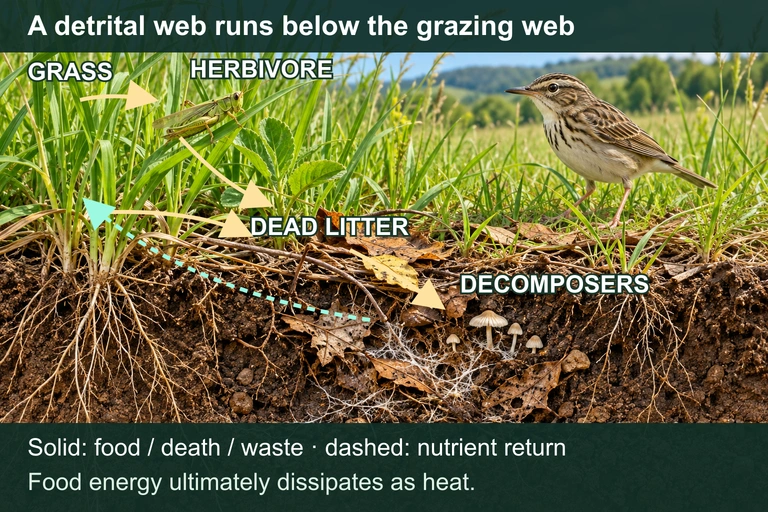 The detrital web transfers chemical energy from dead organic matter to decomposers and consumers. Nutrients return to biological use, while energy ultimately dissipates as heat.
KEY TAKEAWAY
SECTION 3
Visual Explanation: A Terrestrial Food Web
Several structural features of this food web deserve close attention. First, the mouse appears as a food source for both the snake and the fox, meaning its population decline would simultaneously affect two secondary consumers. Second, the hawk is an apex predator—no other organism in this web feeds on it—and its position at trophic level 4 means it receives only a tiny fraction of the energy originally captured by producers. Third, organisms like the fox, which can consume both rabbits and mice, are connected to multiple food chains within the web, which confers a degree of dietary flexibility that can buffer the fox population against the decline of any single prey species. Understanding these interconnections is critical on the AP exam, where you may be asked to predict cascading effects when one species is removed or when a population changes.
SECTION 4
Energy Transfer & Ecological Efficiency
The quantitative backbone of food chain analysis is the concept of ecological efficiency—the percentage of energy at one trophic level that is transferred to the next. When an organism consumes food, most of the ingested energy is lost to cellular respiration (metabolic heat), with additional losses in undigested material (feces) and incomplete assimilation. The remaining energy is incorporated into the consumer's biomass and becomes available to the next trophic level. This pattern is commonly described by the 10% rule, which states that, on average, approximately 10% of the energy at one trophic level is passed to the next, although real values range from roughly 5% to 20% depending on the ecosystem and the organisms involved.
ECOLOGICAL EFFICIENCY
Where n is any given trophic level. For the 10% rule, this ratio ≈ 0.10.
ENERGY AVAILABLE AT TROPHIC LEVEL N
E₁ = energy at producer level (trophic level 1); efficiency = fractional ecological efficiency (e.g., 0.10); n = trophic level number. This exponential decay formula explains why most food chains have only 4–5 trophic levels.
GROSS PRIMARY PRODUCTIVITY VS. NET PRIMARY PRODUCTIVITY
GPP = total energy fixed by photosynthesis; R = energy lost to plant cellular respiration; NPP = energy stored in plant biomass and available to consumers. NPP determines the energy base of the food chain.
WHY MOST FOOD CHAINS ARE SHORT
SECTION 5
Trophic Pyramids & Bioaccumulation
Ecologists visualize the distribution of energy, biomass, or organism numbers across trophic levels using ecological pyramids. Three types are commonly distinguished. A pyramid of energy always takes the shape of an upright pyramid, with the broadest base at the producer level, because of the second law of thermodynamics. A pyramid of biomass is usually upright in terrestrial ecosystems but can be inverted in aquatic ecosystems where phytoplankton reproduce rapidly and are consumed almost as quickly, keeping standing biomass low even though productivity is high. A pyramid of numbers can also be inverted, for example, in a forest where a single large tree supports thousands of insects.
Bioaccumulation & Biomagnification
A critical ecological consequence of food chains is bioaccumulation—the buildup of a persistent substance (such as mercury or DDT) within an individual organism's tissues over its lifetime. When organisms at each trophic level consume many contaminated prey items, the toxin concentration increases at each successive level, a process called biomagnification. This is why apex predators such as tuna, bald eagles, and polar bears often carry the highest concentrations of persistent organic pollutants and heavy metals—a fact with direct implications for both wildlife conservation and human health. Rachel Carson's Silent Spring (1962) documented how DDT biomagnified through aquatic and terrestrial food chains, thinning the eggshells of raptors and nearly driving several species to extinction.
SECTION 6
Worked Example: Energy Calculations in a Food Chain
A common AP Environmental Science problem type asks you to calculate how much producer-level energy is needed to support a given amount of energy (or biomass) at a higher trophic level. Let us work through a representative example.
How Much Grain is Needed to Produce 1 kg of Hawk Biomass?
- 1
Step 1 — Identify the Food Chain and Trophic Levels
The food chain is: Grain (producer, TL 1) → Mouse (primary consumer, TL 2) → Snake (secondary consumer, TL 3) → Hawk (tertiary consumer, TL 4). There are 3 energy transfers between TL 1 and TL 4. - 2
Step 2 — Apply the 10% Rule
For this illustrative biomass conversion only, assume equal energy per kilogram of biomass at every trophic level. Real biomass or feed-conversion ratios require energy-density data and cannot be inferred from a 10% energy-transfer efficiency alone. Using the formula = E₁ × , we can rearrange to find E₁. We want E₄ = 1 kg of hawk biomass, so: E₁ = E₄ ÷ (0.10)³ = 1 ÷ 0.001. - 3
Step 3 — Calculate
E₁ = 1 kg ÷ 0.001 = 1,000 kg of grain. This means that producing 1 kg of hawk requires 1,000 kg of grain at the base of the food chain.1,000 kg of grain is needed to produce 1 kg of hawk biomass - 4
Step 4 — Interpret the Result
This result illustrates why eating lower on the food chain is more energetically efficient. If humans consumed the grain directly instead of passing energy through three trophic levels, only 10 kg of grain (not 1,000 kg) would be needed to produce 1 kg of human biomass. This principle underlies arguments about the environmental efficiency of plant-based diets versus meat-heavy diets.
SECTION 7
Food Chains vs. Food Webs — Strengths & Limitations
| Feature | Food Chain | Food Web |
|---|---|---|
| Complexity | Simple, linear; easy to analyze and teach | Complex, branching; reflects real-world feeding relationships |
| Ecological Realism | Low — organisms rarely eat only one species | High — captures omnivory, multiple prey, and dietary shifts |
| Energy Calculations | Straightforward application of the 10% rule | More difficult; energy is split among multiple pathways |
| Predicting Disturbance | Overly simplistic — predicts total collapse if one link is removed | More accurate — shows how alternative pathways may buffer the system |
| Ecosystem Resilience | Cannot model resilience — no redundancy in the system | Greater web complexity generally implies greater resilience |
Comparison of food chain and food web models for ecosystem analysis
KEY TAKEAWAY
SECTION 8
Connections to Advanced Ecological Theory
Food chain and food web concepts serve as the gateway to several advanced topics that you will encounter in the AP Environmental Science curriculum and beyond. Understanding how energy and matter move through trophic levels connects directly to ecosystem services, conservation biology, and environmental policy.
| Foundational Concept | Advanced Extension |
|---|---|
| 10% rule / ecological efficiency | Trophic cascade theory — removal of top predators causes cascading population changes down through trophic levels (e.g., Yellowstone wolves) |
| Food web complexity and resilience | Biodiversity-stability hypothesis — ecosystems with higher species richness tend to be more stable because of functional redundancy within trophic levels |
| Biomagnification through food chains | Ecotoxicology — modeling how persistent organic pollutants (POPs) and heavy metals accumulate across trophic levels to inform EPA regulations |
| Keystone species in food webs | Conservation prioritization — identifying and protecting species whose removal would disproportionately restructure the food web |
| NPP as the energy base of food chains | Human appropriation of NPP (HANPP) — quantifying how much of Earth's net primary productivity is diverted for human use, reducing energy available to wild food webs |
How foundational food chain concepts extend to advanced ecology and policy
One of the most compelling modern examples of trophic cascade theory is the reintroduction of gray wolves to Yellowstone National Park in 1995. Wolves (tertiary consumers) reduced elk (primary consumer) populations and, more importantly, altered elk grazing behavior through the "ecology of fear." This behavioral shift allowed willows and aspens to regenerate along stream banks, stabilizing riparian zones and increasing habitat for beavers, songbirds, and fish. The Yellowstone case study demonstrates that food web interactions extend far beyond simple energy arithmetic—they reshape landscapes and regulate entire ecosystems through what ecologists call top-down control, in contrast to bottom-up control, where nutrient availability and producer productivity set the constraints on community structure.
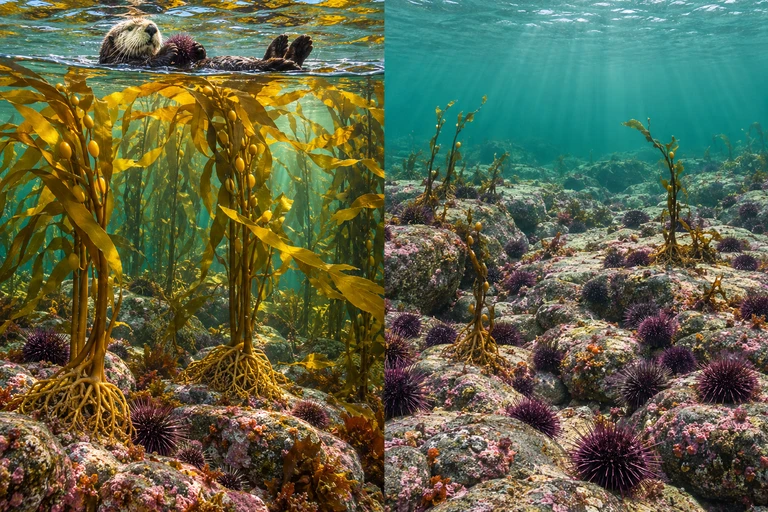 In this kelp–urchin–otter food web, otter feeding can limit urchin grazing and indirectly favor kelp. Other environmental conditions and interactions also influence kelp-forest outcomes.
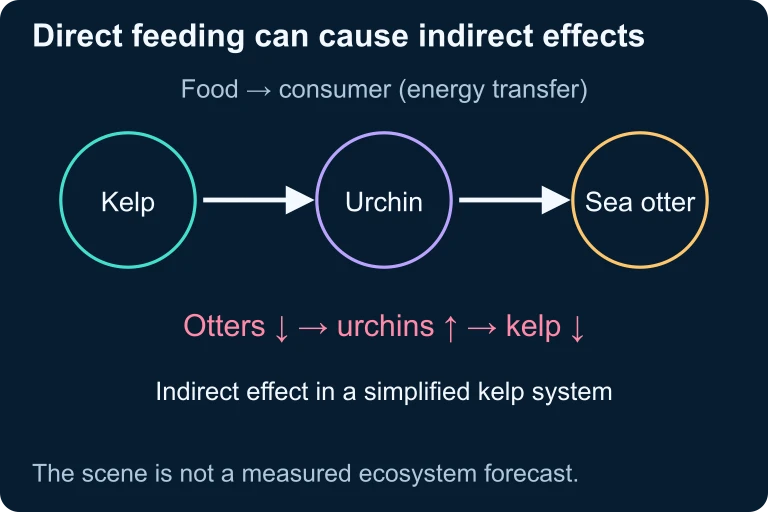 In this kelp–urchin–otter food web, otter feeding can limit urchin grazing and indirectly favor kelp. Other environmental conditions and interactions also influence kelp-forest outcomes.
SECTION 9
Practice Problems
Question 1: CONCEPTUAL
- A. Phytoplankton, because they are in direct contact with the contaminated water
- B. Zooplankton, because they filter large volumes of water
- C. Small fish, because they consume many zooplankton over their lifetime
- D. Large fish, because biomagnification concentrates persistent toxins at higher trophic levels
Show answer (D)
Question 2: BASIC CALCULATION
- A. 8 kcal/m²/yr
- B. 80 kcal/m²/yr
- C. 800 kcal/m²/yr
- D. 8,000 kcal/m²/yr
Show answer (B)
Question 3: INTERMEDIATE
- A. Bottom-up control, in which nutrient limitation determines community structure
- B. A trophic cascade caused by the removal of a keystone predator
- C. Bioaccumulation of toxins at higher trophic levels
- D. Competitive exclusion between sea otters and sea urchins
Show answer (B)
Question 4: APPLIED
4 ptsShow answer
Question 5: CRITICAL THINKING
4 ptsShow answer
SUMMARY
Summary
Summary
Food chains trace a single linear pathway of energy transfer from producers through successive trophic levels, governed by the 10% rule of ecological efficiency. Only about 10% of the energy at one trophic level is transferred to the next because of metabolic losses to cellular respiration, which explains why most food chains have only four to five links and why apex predators are rare. The energy available at any trophic level n can be calculated as E₁ × .
Food webs more realistically represent ecosystem feeding relationships as interconnected networks, revealing how keystone species and trophic cascades can restructure entire communities. Persistent toxins undergo bioaccumulation within organisms and biomagnification across trophic levels, concentrating in top predators. Net primary productivity (NPP) sets the energetic base for all food chains, and ecological pyramids of energy, biomass, and numbers provide visual summaries of trophic structure. Together, these concepts form the foundation for understanding ecosystem resilience, conservation planning, and environmental policy.