

SECTION 1
Historical Context & Motivation
For most of human history, lakes, rivers, and coastal waters cycled nutrients slowly enough that primary producers and decomposers remained in dynamic equilibrium. The industrialization of agriculture in the mid-twentieth century, however, introduced unprecedented quantities of nitrogen (N) and phosphorus (P) into waterways through synthetic fertilizers, concentrated animal feeding operations, and municipal wastewater. Scientists began documenting widespread algal blooms and oxygen-depleted zones that devastated fisheries, tourism economies, and drinking-water supplies. Understanding eutrophication—the process by which excess nutrient loading accelerates biological productivity to the point of ecological collapse—became one of the defining challenges of modern environmental science.
1940s • The Green Revolution Begins
1960s • Lake Erie "Dies"
1972 • U.S. Clean Water Act
1985 • Gulf of Mexico Dead Zone Mapped
2014 • Toledo Water Crisis
These milestones raise a central question for environmental scientists: How do excess nutrients transform aquatic ecosystems, and what strategies can reverse or prevent this transformation? The sections that follow develop the ecological mechanisms, quantitative tools, and policy frameworks you need to answer that question on the AP exam and beyond.
SECTION 2
Core Principles & Definitions
Eutrophication sits at the intersection of nutrient cycling, aquatic ecology, and pollution science. Before examining specific mechanisms, it is essential to distinguish two related but distinct processes. Natural eutrophication is the slow, geological-timescale enrichment of a water body as sediments and organic matter accumulate over millennia—essentially the aging of a lake. Cultural (anthropogenic) eutrophication is the same trajectory compressed into years or decades by human nutrient inputs. The AP exam almost exclusively tests the cultural form.
Limiting Nutrients
Algal Bloom Formation
Decomposition & Oxygen Demand
Hypoxia & Dead Zones
Positive Feedback Loops
KEY TAKEAWAY
SECTION 3
Visual Explanation — The Eutrophication Cascade
The diagram above illustrates the self-reinforcing nature of eutrophication. Notice that stage 4 (hypoxia) circles back into the system via internal phosphorus loading from anoxic sediments. Under aerobic conditions, iron-phosphorus complexes in sediment bind phosphate tightly. When bottom waters become anoxic, these complexes dissolve and release phosphate back into the water column, fueling additional algal blooms. This feedback mechanism explains why many eutrophic lakes remain impaired for years after external nutrient reductions—a phenomenon known as hysteresis in ecological restoration.
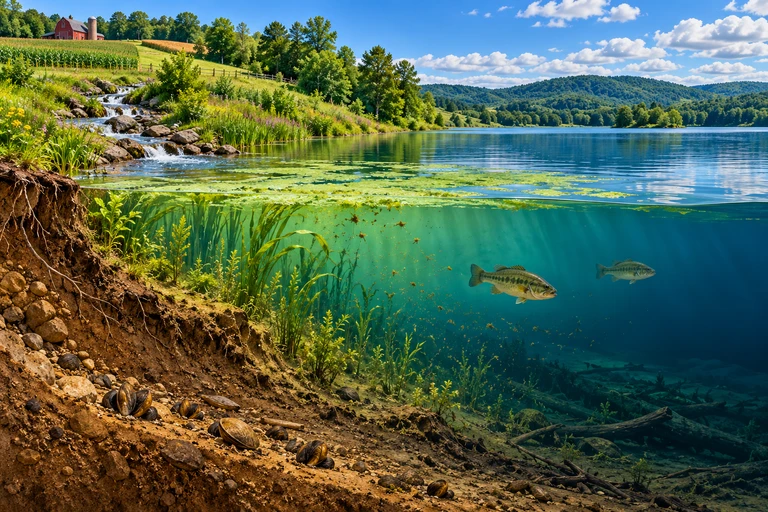 Nutrient enrichment can increase algal production. Aerobic decomposition of sinking organic matter consumes dissolved oxygen, while mixing can replenish it. Hypoxia develops when oxygen demand exceeds replenishment.
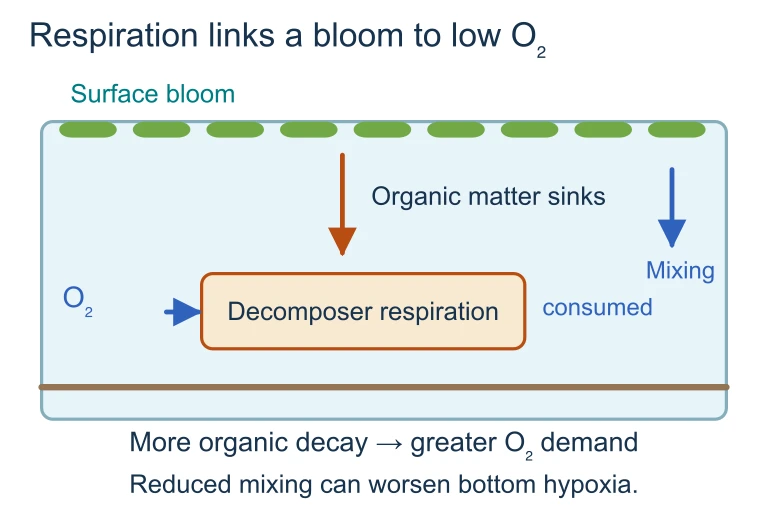 Nutrient enrichment can increase algal production. Aerobic decomposition of sinking organic matter consumes dissolved oxygen, while mixing can replenish it. Hypoxia develops when oxygen demand exceeds replenishment.
SECTION 4
Mechanism — Nutrient Loading & Oxygen Dynamics
Although eutrophication is fundamentally an ecological process, several quantitative relationships appear on the AP Environmental Science exam and provide useful diagnostic tools. The three most relevant are: the relationship between nutrient loading and algal biomass, the biochemical oxygen demand (BOD) concept, and the dissolved oxygen (DO) sag curve.
LIEBIG'S LAW — LIMITING NUTRIENT
Primary productivity is controlled by whichever essential resource is in shortest supply relative to demand. In freshwater, phosphorus (P) is typically limiting because it has no significant gaseous phase and enters water mainly through weathering and runoff. In marine systems, nitrogen (N) is usually limiting because denitrification removes bioavailable N.
BIOCHEMICAL OXYGEN DEMAND (BOD)
BOD₅ quantifies the mass of dissolved oxygen consumed by microorganisms decomposing organic matter in a sealed sample over five days at 20 °C. A pristine stream may have BOD₅ < 2 mg/L, whereas raw sewage can exceed 300 mg/L. Higher BOD signals greater organic pollution and eutrophic potential.
DISSOLVED OXYGEN SAG CURVE (STREETER–PHELPS)
D(t) = oxygen deficit at time t; k₁ = deoxygenation rate constant; k₂ = reaeration rate constant; L₀ = initial BOD; D₀ = initial oxygen deficit. The curve dips to a critical point downstream of a pollution source where oxygen depletion is greatest, then recovers as reaeration exceeds consumption. In eutrophic waters, high L₀ values deepen and extend this sag.
AP Exam Tip
SECTION 5
Nutrient Sources — Point vs. Nonpoint
Effective eutrophication management requires distinguishing between point sources—discrete, identifiable discharge locations such as sewage outfalls and factory drains—and nonpoint sources (NPS), which represent diffuse inputs carried by overland flow, infiltration, and atmospheric deposition across broad landscapes. Since the Clean Water Act largely addressed point sources in the 1970s, nonpoint agricultural runoff has become the dominant contributor to cultural eutrophication in the United States.
This distinction carries enormous policy implications. While point-source controls have achieved remarkable success since the 1970s—reducing phosphorus discharge from wastewater treatment plants by over 50% in many regions—nonpoint-source reductions depend on voluntary adoption of best management practices (BMPs) by millions of individual landowners. Common BMPs include riparian buffer strips, cover cropping, no-till agriculture, precision fertilizer application, and constructed wetlands that intercept nutrient-laden runoff before it reaches surface water. On the AP exam, expect to identify specific BMPs and explain why nonpoint-source pollution remains the dominant eutrophication driver despite decades of Clean Water Act enforcement.
SECTION 6
Worked Example — Phosphorus Loading & BOD Calculation
A municipal wastewater treatment plant discharges treated effluent into a small lake. Use the data below to estimate the annual phosphorus load and evaluate the lake's eutrophic status.
Annual Phosphorus Loading to a Lake
- 1
Step 1 — Identify Given Values
Effluent discharge rate: Q = 5.0 × 10⁶ L/day. Effluent total phosphorus concentration: CP = 1.5 mg/L. Lake surface area: A = 2.0 km². We need the annual P load in kg/yr and the areal loading rate in g P/m²/yr. - 2
Step 2 — Calculate Daily Phosphorus Load
Daily load = Q × CP = (5.0 × 10⁶ L/day)(1.5 mg/L) = 7.5 × 10⁶ mg/day = 7.5 kg/day.Daily P load = 7.5 kg/day - 3
Step 3 — Convert to Annual Load
Annual load = 7.5 kg/day × 365 days/yr = 2,737.5 kg P/yr ≈ 2,738 kg P/yr.Annual P load ≈ 2,738 kg/yr - 4
Step 4 — Calculate Areal Loading Rate
Convert lake area: 2.0 km² = 2.0 × 10⁶ m². Convert annual load to grams: 2,738 kg × 1,000 g/kg = 2,738,000 g. Areal loading = 2,738,000 g ÷ 2.0 × 10⁶ m² = 1.37 g P/m²/yr.Areal loading rate = 1.37 g P/m²/yr - 5
Step 5 — Interpret the Result
The Vollenweider model classifies lakes with areal P loading above approximately 0.3–0.5 g P/m²/yr as eutrophic. At 1.37 g P/m²/yr, this lake exceeds the eutrophic threshold by a factor of roughly 3–4, indicating it is at high risk for persistent algal blooms and hypoxic conditions. Reducing the effluent phosphorus concentration to below 0.5 mg/L (tertiary treatment) would cut the load to approximately 0.46 g P/m²/yr, bringing the lake closer to the mesotrophic–eutrophic boundary.Lake is well above the eutrophic threshold — intervention needed
SECTION 7
Remediation Strategies — Strengths & Limitations
Addressing eutrophication requires a portfolio of strategies operating at different scales—from farm-level nutrient management to basin-wide policy instruments. No single approach is sufficient, and each carries trade-offs between cost, effectiveness, and implementation speed.
| Strategy | Strengths | Limitations |
|---|---|---|
| Tertiary wastewater treatment | Removes >95% of P from effluent; directly enforceable via NPDES permits | Expensive capital and operating costs; addresses only point sources (~20% of load) |
| Riparian buffer zones | Intercepts 50–85% of N and P in surface runoff; provides habitat, bank stabilization | Requires voluntary landowner participation; effectiveness varies with width, vegetation, and slope |
| Constructed wetlands | Low energy cost; removes N via denitrification and P via sedimentation; co-benefits for wildlife | Large land footprint; performance declines in cold climates; periodic harvesting of biomass required |
| Cover crops / no-till farming | Reduces erosion and nutrient runoff 30–60%; improves soil health; sequesters carbon | Requires farmer adoption and training; may slightly reduce yields in transition years; economic incentives needed |
| Alum / clay application (in-lake) | Binds dissolved P in sediment; rapid results; can break internal loading cycle | Treats symptom, not cause; repeated applications may be needed; potential aluminum toxicity at low pH |
Comparison of common eutrophication remediation strategies
KEY TAKEAWAY
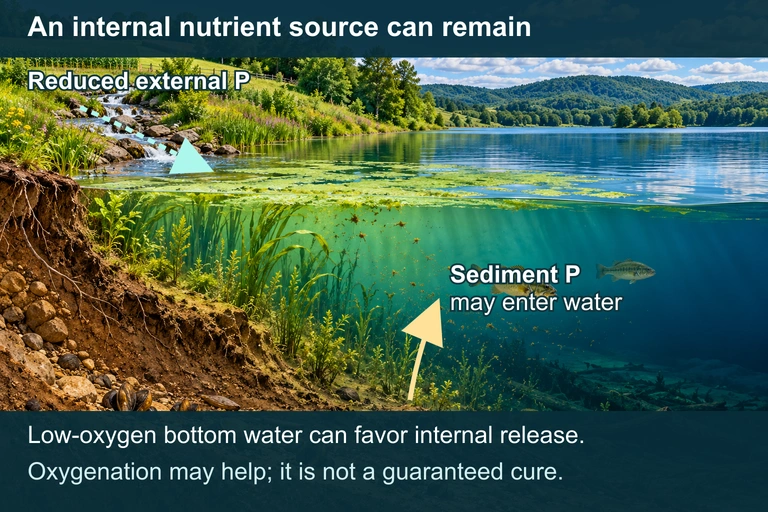 Reducing external phosphorus inputs can leave a conditional internal source in lake sediments. Oxygen conditions and management influence that pathway.
SECTION 8
Global Dead Zones & Climate Connections
Eutrophication is not merely a local water-quality issue—it intersects with several planetary-scale environmental challenges. The Gulf of Mexico dead zone, which averaged roughly 14,000 km² in recent years, is one of over 500 documented coastal hypoxic zones worldwide. Climate change exacerbates eutrophication through multiple pathways: warmer water holds less dissolved oxygen, stronger stratification inhibits mixing and reoxygenation, and more intense precipitation events flush larger nutrient pulses into waterways. Meanwhile, nutrient-enriched wetlands and estuaries produce nitrous oxide (N₂O), a potent greenhouse gas, creating a feedback between water pollution and atmospheric warming.
| Feature | Eutrophication (this lesson) | Ocean Acidification (advanced) |
|---|---|---|
| Primary driver | Excess N and P from agriculture, sewage | Excess CO₂ absorbed by seawater |
| Affected parameter | Dissolved oxygen (DO) | pH and carbonate chemistry |
| Scale | Freshwater and coastal; local to regional | Global ocean |
| Key organisms affected | Fish, benthic invertebrates, submerged vegetation | Corals, mollusks, calcifying plankton |
| Interaction | Decomposition of algal blooms produces CO₂, lowering local pH | Lower pH may favor some harmful algal species, compounding eutrophication |
Eutrophication vs. Ocean Acidification — conceptual comparison
The table above highlights how eutrophication connects to broader biogeochemical disruptions. On the AP exam, you may encounter questions linking eutrophication with climate change, the nitrogen cycle, or harmful algal blooms (HABs) that produce toxins such as microcystin and domoic acid. Recognizing these cross-topic connections will strengthen your ability to answer multi-concept free-response questions.
SECTION 9
Practice Problems
Question 1: CONCEPTUAL
- A. Nitrogen is the limiting nutrient in this lake.
- B. Phosphorus is the limiting nutrient in this lake.
- C. The lake is nitrogen-saturated and phosphorus-depleted, indicating an oligotrophic state.
- D. Both nitrogen and phosphorus must be reduced simultaneously to control algal blooms.
Show answer (B)
Question 2: BASIC CALCULATION
- A. 1.6 kg/day
- B. 16 kg/day
- C. 160 kg/day
- D. 1,600 kg/day
Show answer (B)
Question 3: INTERMEDIATE
- A. Atmospheric nitrogen deposition from nearby power plants has replaced phosphorus as the growth-limiting nutrient.
- B. Invasive fish species are consuming so much zooplankton that grazing pressure on algae has collapsed.
- C. Anoxic bottom sediments are releasing previously stored phosphorus back into the water column, sustaining algal blooms via internal loading.
- D. Climate change has increased water temperatures enough to permanently suppress dissolved oxygen regardless of nutrient levels.
Show answer (C)
Question 4: APPLIED
4 ptsShow answer
Question 5: CRITICAL THINKING
4 ptsShow answer
SUMMARY
Eutrophication — Summary Review
Summary
Eutrophication is the process by which excess nitrogen and phosphorus accelerate primary productivity in aquatic systems, triggering algal blooms that block sunlight, die, and decompose. The aerobic decomposition creates massive biochemical oxygen demand (BOD), driving dissolved oxygen below the hypoxic threshold of ~2 mg/L and creating dead zones. Phosphorus is typically the limiting nutrient in freshwater, while nitrogen limits marine systems. A critical positive feedback loop operates through internal phosphorus loading: anoxic sediments release stored P, fueling additional blooms even after external inputs are curtailed.
Remediation requires addressing both point sources (via tertiary wastewater treatment and NPDES permits) and nonpoint sources (via best management practices such as riparian buffers, cover crops, no-till farming, and constructed wetlands). Nonpoint agricultural runoff accounts for approximately 80% of nutrient loading in the U.S. and remains the greatest challenge. For the AP exam, remember the four-stage cascade (nutrient input → algal bloom → die-off → hypoxia), be prepared to interpret a dissolved oxygen sag curve, and understand why source reduction is more effective than in-lake remediation.