

SECTION 1
Historical Context & Motivation
The question of how energy moves through living systems has occupied ecologists since the discipline's earliest days. In the late nineteenth century, naturalists recognized that predators are far less abundant than their prey, but they lacked a quantitative framework to explain why. The breakthrough came when researchers began applying the laws of thermodynamics — particularly the second law, which states that every energy transformation increases the entropy of the universe — to ecological communities. This thermodynamic perspective transformed ecology from a purely descriptive science into one grounded in measurable energy budgets, enabling scientists to predict the structure and productivity of entire ecosystems.
1927 • Charles Elton's Food Chains
1942 • Lindeman's Trophic-Dynamic Concept
1953 • Howard Odum's Silver Springs Study
1968 • Eugene Odum's Textbook Synthesis
These pioneering studies posed a deceptively simple question: if the Sun bathes the Earth in vast quantities of radiant energy every day, why can ecosystems support only a limited number of top predators? The answer lies in the relentless dissipation of energy as metabolic heat at every trophic transfer — a principle now formalized as the 10% rule and central to AP Environmental Science.
SECTION 2
Core Principles & Definitions
Energy flow in an ecosystem is governed by a small set of thermodynamic and ecological principles that together explain why food chains are short, why biomass pyramids narrow upward, and why large carnivores require enormous home ranges. Unlike nutrients, which cycle through biogeochemical pathways, energy moves through ecosystems in a single direction — from the Sun to producers to consumers — and is ultimately dissipated as thermal energy. This unidirectional flow means that ecosystems are inherently open systems with respect to energy, requiring continuous solar input to sustain biological organization.
Trophic Level
Gross Primary Productivity (GPP)
Net Primary Productivity (NPP)
Ecological Efficiency (10% Rule)
Biomass & Energy Pyramids
KEY TAKEAWAY
SECTION 3
Visual Explanation — The Energy Pyramid
The diagram above captures the central insight of ecosystem energetics: energy pyramids are always upright because thermodynamic losses prevent higher trophic levels from accumulating more energy than the levels that support them. At the base, producers fix solar energy through photosynthesis, generating gross primary productivity. After subtracting their own respiratory costs, the remaining net primary productivity enters the consumer food web. At each subsequent transfer — herbivore to carnivore to top predator — approximately 90% of the ingested energy is expended on metabolic processes (movement, thermoregulation, cellular maintenance) and released as heat. Only the fraction assimilated into new biomass (growth and reproduction) is available to the next trophic level. This exponential decline explains why most food chains have no more than four or five trophic levels: there simply is not enough energy remaining to support a viable population of sixth-level consumers.
SECTION 4
Mathematical Framework
The quantitative treatment of energy flow relies on a handful of relationships that connect primary productivity to consumer-level energetics. These equations are essential tools for AP Environmental Science free-response questions, particularly those requiring calculations of energy availability at different trophic levels.
NET PRIMARY PRODUCTIVITY
Where NPP = net primary productivity (energy available to consumers), GPP = gross primary productivity (total photosynthetic output), and R = energy lost to plant cellular respiration.
TROPHIC EFFICIENCY (THE 10% RULE)
Typically ≈ 10%, though real values range from about 5% to 20% depending on the organism and ecosystem. Endotherms tend to have lower efficiencies (~5%) because they expend more energy on thermoregulation, while ectotherms can reach ~15–20%.
ENERGY AT TROPHIC LEVEL n
Where E₁ = energy at the producer level, n = the trophic level of interest, and efficiency = the fractional trophic efficiency (0.10 for a standard 10% assumption). For example, at the fourth trophic level: E₄ = E₁ × (0.10)³ = E₁ × 0.001.
AP Exam Tip
SECTION 5
Energy Budgets at Each Trophic Level
To appreciate why only ≈10% of energy transfers between trophic levels, it helps to examine the complete energy budget of an individual consumer. When an herbivore ingests plant material, not all of it becomes available for growth. A significant fraction passes through the digestive tract undigested (feces), and that energy goes to decomposers. Of the energy that is assimilated, the majority is consumed by cellular respiration to power locomotion, maintain body temperature (in endotherms), and carry out biosynthetic reactions. Only the small remainder — energy converted into new tissue — constitutes net secondary productivity, the fraction available to the next consumer in the chain.
| Fate of Energy | Amount (kcal) | % of Ingested | Destination |
|---|---|---|---|
| Feces (undigested) | 330 | 33% | Decomposers / detritivores |
| Cellular respiration | 570 | 57% | Lost as metabolic heat |
| Net production (growth) | 100 | 10% | Available to next trophic level |
Breakdown of energy fate for a typical consumer ingesting 1,000 kcal
 Suppose a consumer ingests 1,000 kcal: 330 kcal leaves in feces, 570 kcal supports respiration, and 100 kcal becomes new biomass. The 10% ratio of production to ingestion is gross growth efficiency; whole-trophic transfer efficiency uses a different system boundary.
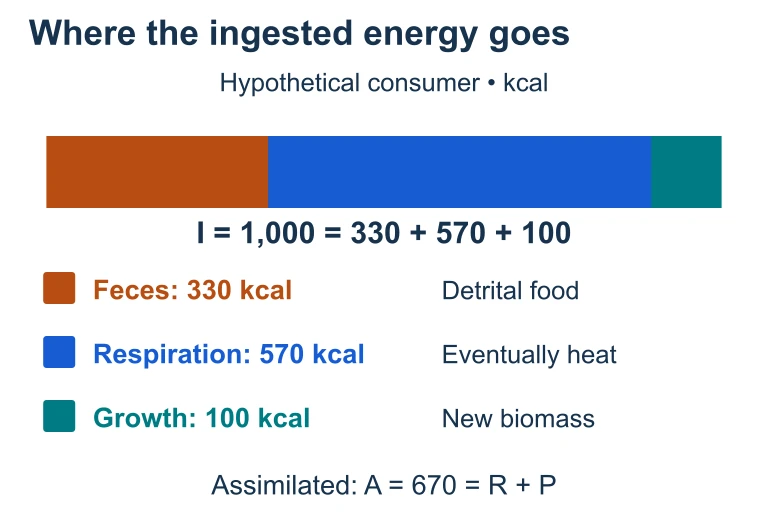 Suppose a consumer ingests 1,000 kcal: 330 kcal leaves in feces, 570 kcal supports respiration, and 100 kcal becomes new biomass. The 10% ratio of production to ingestion is gross growth efficiency; whole-trophic transfer efficiency uses a different system boundary.
SECTION 6
Worked Example — Calculating Trophic-Level Energy
A common AP Environmental Science scenario provides producer-level energy and asks how much energy is available at a specified consumer level. The following worked example demonstrates the step-by-step approach you should use on both multiple-choice and free-response questions.
Prairie Ecosystem Energy Calculation
- 1
Step 1 — Identify Given Values
A prairie ecosystem has a gross primary productivity (GPP) of 8,000 kcal/m²/yr. The plants use 3,000 kcal/m²/yr for their own cellular respiration. We want to find how much energy is available to a hawk (tertiary consumer, trophic level 4). Assume 10% trophic efficiency at each transfer. - 2
Step 2 — Calculate NPP
Net primary productivity is the energy remaining after plant respiration: NPP = GPP − R = 8,000 − 3,000 = 5,000 kcal/m²/yr. This NPP represents the energy at trophic level 1 that enters the consumer food web.NPP = 5,000 kcal/m²/yr - 3
Step 3 — Apply the 10% Rule for Each Transfer
From producers (TL 1) to primary consumers (TL 2): 5,000 × 0.10 = 500 kcal/m²/yr. From primary consumers (TL 2) to secondary consumers (TL 3): 500 × 0.10 = 50 kcal/m²/yr. From secondary consumers (TL 3) to tertiary consumers (TL 4): 50 × 0.10 = 5 kcal/m²/yr.TL 2 = 500 | TL 3 = 50 | TL 4 = 5 kcal/m²/yr - 4
Step 4 — Verify with the Exponent Formula
Alternatively, use the direct formula: E₄ = E₁ × (0.10)³ = 5,000 × 0.001 = 5 kcal/m²/yr. The exponent is (n − 1) = (4 − 1) = 3 because there are three trophic transfers between the first and fourth levels.E₄ = 5 kcal/m²/yr available to hawks - 5
Step 5 — Interpret the Result
Only 5 out of the original 5,000 kcal/m²/yr of NPP reaches the tertiary consumer level — just 0.1% of the energy that entered the food web. This massive energy loss explains why top predators like hawks require large home ranges and exist at low population densities.
SECTION 7
Strengths & Limitations of the 10% Rule
The 10% rule is a powerful heuristic, but like any generalization in ecology, it has important caveats. Understanding both its utility and its limitations will strengthen your ability to evaluate data-based questions on the AP exam, where actual efficiencies may deviate from the textbook average.
| Strengths | Limitations |
|---|---|
| Provides a quick, reliable approximation for calculating energy availability across trophic levels | Actual trophic efficiency ranges from 5% to 20%; using exactly 10% may overestimate or underestimate real values |
| Explains why food chains are short and why top predator populations are small | Does not account for detritivore and decomposer pathways, which can recycle significant energy |
| Applicable across nearly all terrestrial and aquatic ecosystems as a first approximation | Endotherms (birds, mammals) have lower efficiencies (~5%) than ectotherms (insects, fish) (~15–20%) |
| Supported by decades of empirical studies from Lindeman (1942) through modern ecosystem monitoring | Assumes discrete trophic levels, but many organisms are omnivores feeding at multiple levels simultaneously |
Strengths and limitations of the 10% trophic efficiency approximation
KEY TAKEAWAY
SECTION 8
Connections to Sustainability & Advanced Ecology
The implications of energy flow extend far beyond theoretical ecology. Because only ≈10% of energy transfers between trophic levels, the trophic position at which humans choose to harvest food has enormous consequences for the carrying capacity of the planet. Eating lower on the food chain — consuming grains rather than grain-fed beef — is inherently more energy-efficient and requires less land, water, and fossil fuel input per calorie delivered to the consumer. This thermodynamic reality underpins many arguments in sustainable agriculture and food security policy.
| Concept | Basic Ecosystem Energetics | Advanced / Applied Connections |
|---|---|---|
| Energy availability | 10% rule determines energy at each trophic level | Ecological footprint analysis quantifies land area required to support diets at different trophic levels |
| Food chain length | Typically 3–5 trophic levels due to energy loss | Bioaccumulation and biomagnification of toxins (e.g., DDT, mercury) are amplified at higher trophic levels |
| Productivity | NPP = GPP − R as a measure of ecosystem output | Human appropriation of NPP (HANPP) estimates that humans redirect ~25–40% of terrestrial NPP for food, fiber, and fuel |
| Trophic cascades | Energy limits predator populations | Removing top predators can trigger trophic cascades that restructure entire ecosystems (e.g., wolves in Yellowstone) |
Connections between basic energy flow concepts and advanced/applied ecology
As you advance beyond AP Environmental Science, you will encounter more refined models of energy flow. Ecosystem ecologists now use network analysis to trace energy through complex food webs rather than simple linear chains, and they incorporate the microbial loop — a pathway in which dissolved organic matter is consumed by bacteria, which are then grazed by protists, effectively recycling energy back into the web. These advanced frameworks do not invalidate the 10% rule so much as they enrich it, revealing the full complexity of thermodynamic constraints on living systems.
SECTION 9
Practice Problems
Question 1: CONCEPTUAL
- A. Producers are inefficient at photosynthesis, converting less than 1% of incoming solar radiation to chemical energy.
- B. Energy is lost as metabolic heat at each trophic transfer, so only about 10% of the net primary productivity passes to primary consumers, and about 10% of that reaches secondary consumers.
- C. Decomposers consume all of the energy that primary consumers do not eat, leaving very little for secondary consumers.
- D. Secondary consumers are endotherms and therefore require ten times more energy than ectothermic primary consumers.
Show answer (B)
Question 2: BASIC CALCULATION
- A. 45.0
- B. 4.5
- C. 0.45
- D. 450
Show answer (B)
Question 3: INTERMEDIATE
- A. 10%
- B. 2.25%
- C. 15%
- D. 22.5%
Show answer (C)
Question 4: APPLIED
4 ptsShow answer
Question 5: CRITICAL THINKING
4 ptsShow answer
SUMMARY
Summary
Summary
Energy flows through ecosystems in a single direction — from the Sun to producers to consumers — and cannot be recycled. Gross primary productivity (GPP) measures total photosynthetic output, while net primary productivity (NPP = GPP − R) represents the energy available to the consumer food web after plant respiration. At each trophic transfer, roughly 90% of energy is lost as metabolic heat from cellular respiration, leaving only about 10% of energy to pass to the next level — the 10% rule.
This exponential decline in available energy explains why energy pyramids are always upright, why food chains rarely exceed four or five trophic levels, and why top predators exist at low population densities. For calculations, use Eₙ = E₁ × (0.10)ⁿ⁻¹ where n is the target trophic level. Remember that actual efficiencies vary (5–20%) depending on whether organisms are endotherms or ectotherms, so always use the efficiency specified in the problem rather than defaulting to 10% when data are provided.