

SECTION 1
Historical Context & Motivation
For most of human history, energy was derived from biomass—wood, dung, and animal power—and demand was modest enough that conservation was not a deliberate concern. The Industrial Revolution fundamentally altered this equation: coal, and later petroleum and natural gas, unlocked enormous quantities of energy, but at escalating environmental and geopolitical costs. Energy conservation emerged as a formal policy objective only after a series of supply shocks and environmental crises forced societies to reckon with finite resources and the externalities of combustion.
1973 • OPEC Oil Embargo
1975 • CAFE Standards Enacted
1992 • ENERGY STAR Program
2007 • Energy Independence and Security Act
2015 • Paris Agreement
These milestones reveal a recurring pattern: energy conservation rises on the policy agenda when economic shocks or environmental evidence expose the true cost of unconstrained consumption. The central question the AP Environmental Science curriculum asks you to engage with is: How can individuals, industries, and governments reduce energy demand in ways that are economically viable and ecologically meaningful?
SECTION 2
Core Principles & Definitions
Before diving into strategies, it is essential to distinguish between two related but distinct concepts. Energy conservation refers broadly to reducing the total amount of energy consumed, whether through behavioral changes (e.g., turning off lights) or structural improvements (e.g., insulating buildings). Energy efficiency is a subset of conservation that focuses specifically on obtaining the same service or output using less energy input—producing the same lumens with fewer watts, for instance. On the AP exam, you may be asked to differentiate these terms or to evaluate which strategy is more effective in a given scenario.
Conservation vs. Efficiency
The Second Law Constraint
Demand-Side Management
The Rebound Effect
SECTION 3
Visualizing Energy Flow & Loss
A Sankey-style flow diagram is one of the most powerful ways to understand where energy is lost in a system. The diagram below traces the journey of 100 units of energy from a coal-fired power plant to the useful light output of an incandescent bulb versus an LED bulb. At each stage, energy is dissipated as waste heat, and the width of each arrow is proportional to the energy remaining.
Notice that the power plant itself accounts for the largest single loss: roughly 65% of the chemical energy in coal is rejected as waste heat, a consequence of the second law of thermodynamics. Transmission and distribution lines lose another 5–10%. By the time electricity reaches an end-use device, the cumulative efficiency is already low—making the choice of end-use technology (incandescent vs. LED) disproportionately impactful on total system demand.
SECTION 4
Mathematical Framework
Energy conservation questions on the AP exam frequently require quantitative reasoning. Below are the key equations you should master, all centered on the concept of efficiency and its application to energy savings calculations.
ENERGY EFFICIENCY
Useful energy output is the energy that performs the desired service (light, motion, heat in the target space). Total energy input is the fuel or electrical energy consumed. This ratio is always less than 100% for real systems.
ENERGY SAVED
P represents the power rating (watts) of the old and new devices; t is operating time. Multiply watt-hours by the number of devices and days to scale to annual savings.
KILOWATT-HOUR CONVERSION
The kilowatt-hour is the billing unit for electricity. A 100 W bulb running for 10 hours uses 1 kWh. Cost = kWh × rate ($/kWh).
CO₂ EMISSIONS AVOIDED
The U.S. average grid emission factor is approximately 0.42 kg CO₂ per kWh (as of 2023). Coal-heavy grids may exceed 0.9 kg CO₂/kWh, while hydro-dominant grids may be near zero.
SECTION 5
Conservation Strategies by Sector
In the United States, energy consumption is conventionally divided into four major sectors: residential, commercial, industrial, and transportation. Each sector has distinct conservation opportunities, and effective policy targets the sectors where marginal savings yield the greatest environmental benefit per dollar invested. The diagram below summarizes the approximate share of total U.S. energy consumption by sector and highlights key conservation strategies for each.
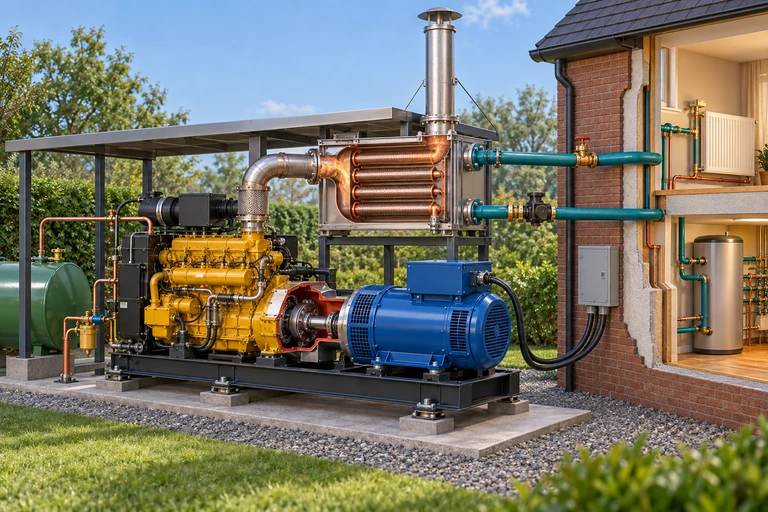 Suppose CHP converts 100 kWh of fuel into 30 kWh of electricity and 50 kWh of useful heat. Separate electricity generation at 30% efficiency and heat production at 80% efficiency require 162.5 kWh for the same services. Recovered heat must match demand in temperature, place and time.
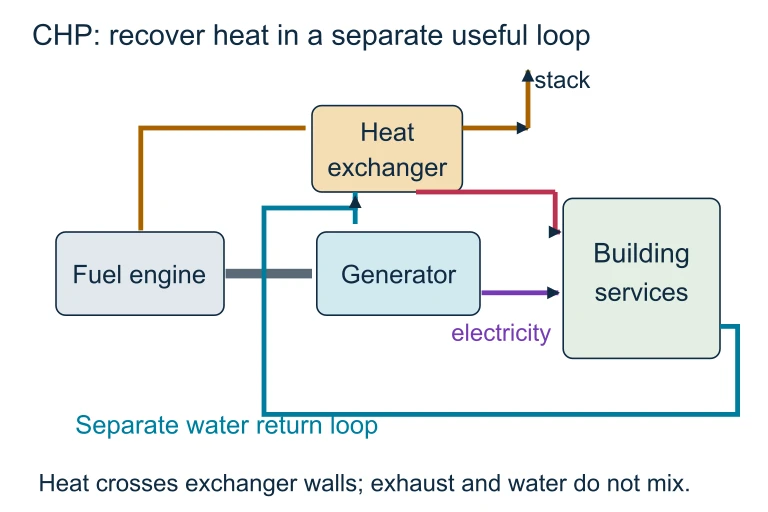 Suppose CHP converts 100 kWh of fuel into 30 kWh of electricity and 50 kWh of useful heat. Separate electricity generation at 30% efficiency and heat production at 80% efficiency require 162.5 kWh for the same services. Recovered heat must match demand in temperature, place and time.
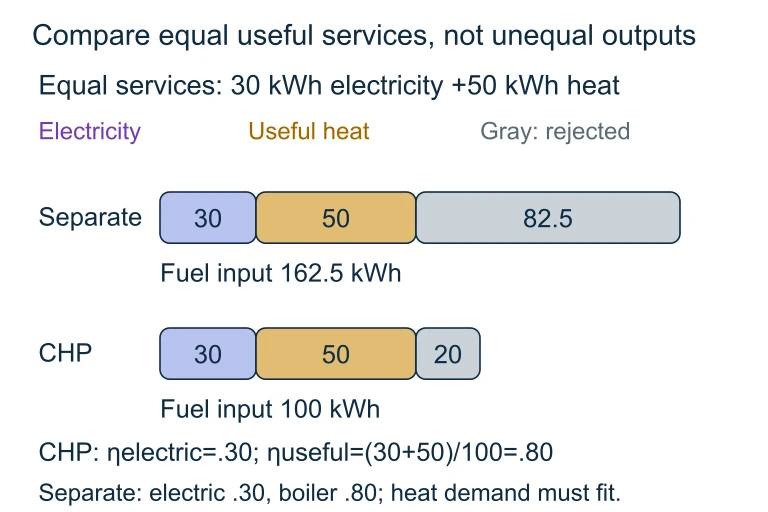 Suppose CHP converts 100 kWh of fuel into 30 kWh of electricity and 50 kWh of useful heat. Separate electricity generation at 30% efficiency and heat production at 80% efficiency require 162.5 kWh for the same services. Recovered heat must match demand in temperature, place and time.
SECTION 6
Worked Example: Calculating Savings from an LED Retrofit
A school has 500 incandescent bulbs rated at 60 W each. The administration replaces them with 10 W LED bulbs that produce equivalent light. The lights operate an average of 10 hours per day, 250 days per year. Electricity costs $0.12/kWh and the grid emission factor is 0.42 kg CO₂/kWh. Calculate: (a) annual energy saved, (b) annual cost savings, and (c) annual CO₂ emissions avoided.
Worked example
- 1
Step 1 — Calculate annual energy use for incandescent bulbs
Energy = Power × Time × Number of bulbs. Each bulb uses 60 W for 10 h/day × 250 days = 2,500 h/year. Energy per bulb = 60 W × 2,500 h = 150,000 Wh = 150 kWh. Total = 500 × 150 kWh = 75,000 kWh/year.75,000 kWh/year (incandescent) - 2
Step 2 — Calculate annual energy use for LED bulbs
Each LED uses 10 W for 2,500 h/year. Energy per bulb = 10 W × 2,500 h = 25,000 Wh = 25 kWh. Total = 500 × 25 kWh = 12,500 kWh/year.12,500 kWh/year (LED) - 3
Step 3 — Calculate annual energy saved
Energy saved = 75,000 − 12,500 = 62,500 kWh/year.62,500 kWh saved per year - 4
Step 4 — Calculate annual cost savings
Cost savings = 62,500 kWh × $0.12/kWh = $7,500/year.$7,500 saved per year - 5
Step 5 — Calculate CO₂ emissions avoided
CO₂ avoided = 62,500 kWh × 0.42 kg CO₂/kWh = 26,250 kg = 26.25 metric tons of CO₂ per year.26.25 metric tons CO₂ avoided per year
SECTION 7
Strengths, Limitations & the Rebound Effect
| Conservation Strategy | Strengths | Limitations |
|---|---|---|
| Behavioral changes (turning off lights, adjusting thermostats) | No capital cost; immediate effect; accessible to all income levels | Relies on sustained motivation; difficult to enforce at scale; small per-action savings |
| Efficiency upgrades (LED bulbs, ENERGY STAR appliances) | Persistent savings without ongoing effort; often pays for itself via reduced utility bills | Upfront cost can be a barrier; subject to the rebound effect; embodied energy of manufacturing |
| Building standards (insulation codes, LEED certification) | Locks in savings for decades; applies to new construction at low marginal cost | Does not retrofit existing stock; implementation varies by jurisdiction; compliance costs |
| Transportation policies (CAFE, public transit investment) | Reduces oil dependence and air pollution; systemic, economy-wide impact | Long lead times; political resistance; infrastructure-intensive; may increase urban sprawl if not well-designed |
| Cogeneration (CHP) | Dramatically raises overall efficiency (60–80%); reduces grid dependence | High capital investment; requires co-located thermal demand; still relies on fossil fuel combustion in most cases |
Comparison of major energy conservation strategies
Key takeaway
SECTION 8
Policy Instruments & Connection to Sustainability
Energy conservation does not exist in a policy vacuum; it intersects with broader frameworks of sustainable development, climate mitigation, and environmental justice. Understanding the policy toolbox is essential for the FRQ portion of the AP exam, where you may be asked to propose or evaluate a conservation solution.
| Policy Instrument | Mechanism | Example |
|---|---|---|
| Command-and-control regulation | Government sets mandatory standards (e.g., minimum appliance efficiency) | CAFE standards; building energy codes; incandescent bulb phase-out |
| Market-based incentives | Uses price signals to internalize externalities and incentivize conservation | Carbon tax; cap-and-trade; tiered electricity pricing |
| Voluntary programs | Provides information and recognition to encourage voluntary action | ENERGY STAR labeling; LEED certification; utility rebate programs |
| Research & development | Government funds innovation to lower costs of efficient technologies | DOE Advanced Research Projects Agency–Energy (ARPA-E) |
Policy instruments for energy conservation
Looking forward, energy conservation is increasingly viewed not as a standalone goal but as an integral component of the energy transition—the shift from fossil fuels to renewable sources. Conservation reduces the total capacity of wind, solar, and storage infrastructure needed to meet demand, thereby lowering the cost and accelerating the timeline of decarbonization. The International Energy Agency (IEA) estimates that energy efficiency improvements alone could deliver more than 40% of the emissions reductions needed to meet the Paris Agreement targets by 2040, making conservation the single largest contributor to climate mitigation in many modeling scenarios.
SECTION 9
Practice Problems
Question 1: CONCEPTUAL
- A. Turning off lights when leaving a room
- B. Lowering the thermostat by 2 °F in winter
- C. Replacing an old furnace with a high-efficiency model
- D. Carpooling to work three days a week
Show answer (C)
Question 2: BASIC CALCULATION
- A. $121
- B. $242
- C. $484
- D. $48
Show answer (B)
Question 3: INTERMEDIATE
- A. Approximately 1,629,000 kWh
- B. Approximately 1,515,000 kWh
- C. Approximately 538,000 kWh
- D. Approximately 830,000 kWh
Show answer (A)
Question 4: APPLIED
Show answer
Question 5: CRITICAL THINKING